
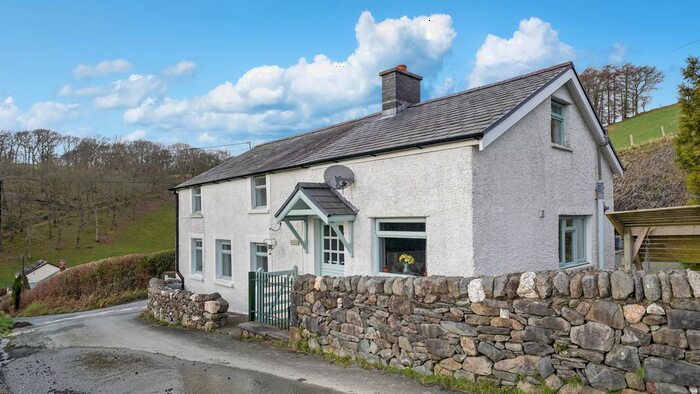
Houses for sale & to rent in Ceulanamaesmawr, Machynlleth
House Prices in Ceulanamaesmawr
Properties in Ceulanamaesmawr have an average house price of £259,551.00 and had 50 Property Transactions within the last 3 years¹.
Ceulanamaesmawr is an area in Machynlleth, Sir Ceredigion - Ceredigion with 381 households², where the most expensive property was sold for £750,000.00.
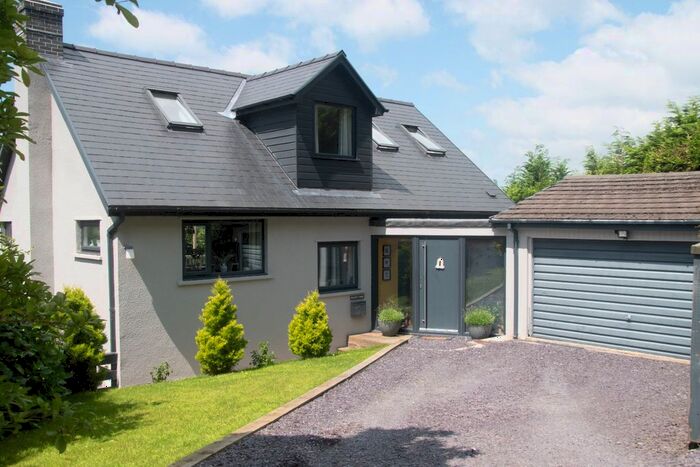
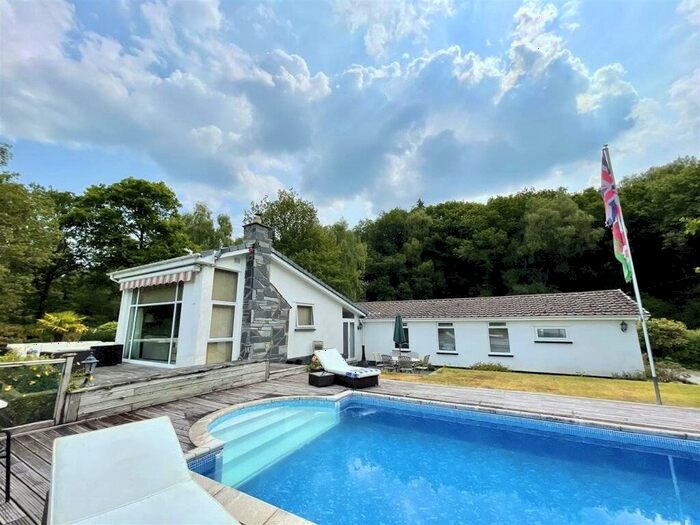
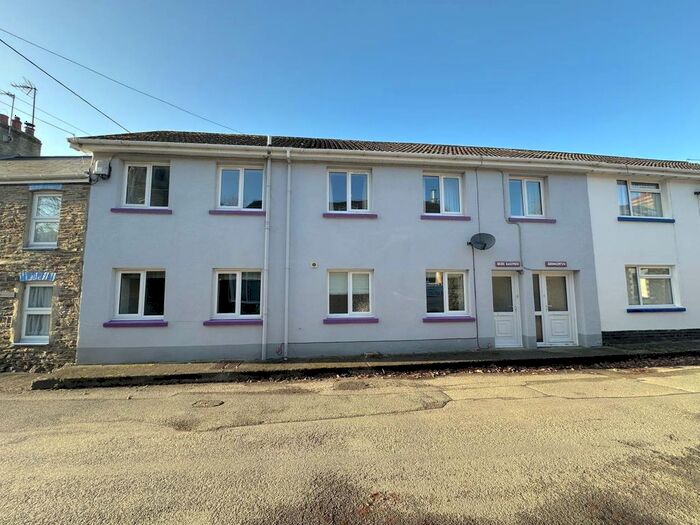
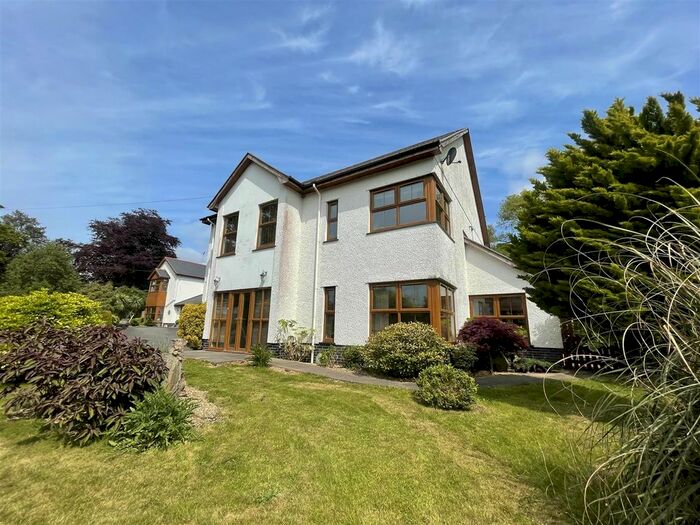
Properties for sale in Ceulanamaesmawr


Roads and Postcodes in Ceulanamaesmawr
Navigate through our locations to find the location of your next house in Ceulanamaesmawr, Machynlleth for sale or to rent.
| Streets | Postcodes |
|---|---|
| Cae Bitffald | SY20 8QE |
| Einion Terrace | SY20 8PH |
| Maes Clettwr | SY20 8QB |
| Mill Street | SY20 8PR |
| New Terrace | SY20 8JJ |
| North Road | SY20 8PP |
| Park Terrace | SY20 8SU |
| Pencae | SY20 8JW |
| Plas Mawr | SY20 8SZ |
| Sea View | SY20 8JN |
| Tanyfoel | SY20 8SY |
| Terrace Row | SY20 8JL |
| Wesley Terrace | SY20 8JQ |
| SY20 8JG SY20 8JH SY20 8JP SY20 8JR SY20 8JS SY20 8ND SY20 8PG SY20 8PJ SY20 8PL SY20 8PN SY20 8PQ SY20 8PT SY20 8PU SY20 8PX SY20 8QD SY20 8SS SY20 8SX SY20 8TD SY20 8TF SY20 8PD SY20 8PW SY20 8TA SY20 8TB SY20 8TE |
Transport near Ceulanamaesmawr

- FAQ
- Price Paid By Year
- Property Type Price
Frequently asked questions about Ceulanamaesmawr
What is the average price for a property for sale in Ceulanamaesmawr?
The average price for a property for sale in Ceulanamaesmawr is £259,551. There are 190 property listings for sale in Ceulanamaesmawr.
What streets have the most expensive properties for sale in Ceulanamaesmawr?
The streets with the most expensive properties for sale in Ceulanamaesmawr are Mill Street at an average of £355,000 and Pencae at an average of £172,000.
What streets have the most affordable properties for sale in Ceulanamaesmawr?
The streets with the most affordable properties for sale in Ceulanamaesmawr are Tanyfoel at an average of £149,666 and North Road at an average of £163,500.
Which train stations are available in or near Ceulanamaesmawr?
Some of the train stations available in or near Ceulanamaesmawr are Dovey Junction, Penhelig and Aberdovey.
Property Price Paid in Ceulanamaesmawr by Year
The average sold property price by year was:
| Year | Average Sold Price | Price Change |
Sold Properties
|
|---|---|---|---|
| 2023 | £281,853 | 11% |
14 Properties |
| 2022 | £250,855 | - |
19 Properties |
| 2021 | £250,905 | 39% |
17 Properties |
| 2020 | £153,428 | -16% |
7 Properties |
| 2019 | £177,375 | -12% |
12 Properties |
| 2018 | £198,795 | -7% |
10 Properties |
| 2017 | £212,484 | 21% |
12 Properties |
| 2016 | £167,925 | -8% |
14 Properties |
| 2015 | £180,750 | 13% |
14 Properties |
| 2014 | £157,937 | -17% |
8 Properties |
| 2013 | £184,500 | 16% |
6 Properties |
| 2012 | £154,833 | 30% |
6 Properties |
| 2011 | £108,500 | -71% |
2 Properties |
| 2010 | £185,750 | -20% |
6 Properties |
| 2009 | £223,431 | 26% |
11 Properties |
| 2008 | £164,375 | -41% |
4 Properties |
| 2007 | £231,214 | 35% |
14 Properties |
| 2006 | £150,566 | -3% |
9 Properties |
| 2005 | £154,933 | -24% |
15 Properties |
| 2004 | £192,866 | 46% |
15 Properties |
| 2003 | £104,412 | 30% |
14 Properties |
| 2002 | £73,340 | -29% |
17 Properties |
| 2001 | £94,965 | 24% |
17 Properties |
| 2000 | £72,642 | 17% |
7 Properties |
| 1999 | £60,650 | 25% |
8 Properties |
| 1998 | £45,562 | -25% |
8 Properties |
| 1997 | £57,118 | -16% |
11 Properties |
| 1996 | £66,000 | 36% |
2 Properties |
| 1995 | £42,004 | - |
11 Properties |
Property Price per Property Type in Ceulanamaesmawr
Here you can find historic sold price data in order to help with your property search.
The average Property Paid Price for specific property types in the last three years are:
| Property Type | Average Sold Price | Sold Properties |
|---|---|---|
| Semi Detached House | £210,000.00 | 5 Semi Detached Houses |
| Terraced House | £167,865.00 | 16 Terraced Houses |
| Detached House | £318,680.00 | 29 Detached Houses |