
Houses for sale & to rent in Llanfihangel Ystrad, Lampeter
House Prices in Llanfihangel Ystrad
Properties in Llanfihangel Ystrad have an average house price of £298,979.00 and had 64 Property Transactions within the last 3 years¹.
Llanfihangel Ystrad is an area in Lampeter, Sir Ceredigion - Ceredigion with 862 households², where the most expensive property was sold for £760,000.00.
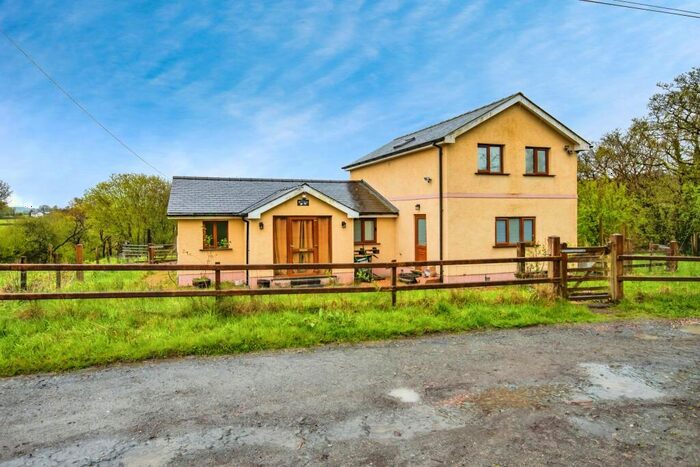
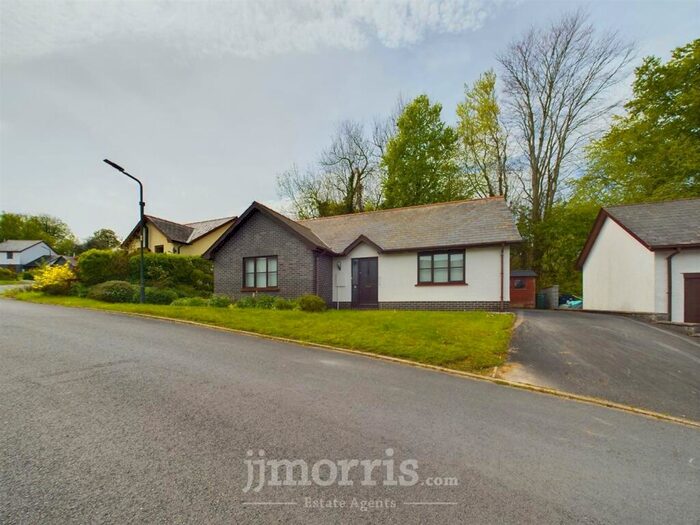
Properties for sale in Llanfihangel Ystrad


Roads and Postcodes in Llanfihangel Ystrad
Navigate through our locations to find the location of your next house in Llanfihangel Ystrad, Lampeter for sale or to rent.
Transport near Llanfihangel Ystrad

- FAQ
- Price Paid By Year
- Property Type Price
Frequently asked questions about Llanfihangel Ystrad
What is the average price for a property for sale in Llanfihangel Ystrad?
The average price for a property for sale in Llanfihangel Ystrad is £298,979. This amount is 16% higher than the average price in Lampeter. There are 612 property listings for sale in Llanfihangel Ystrad.
What streets have the most expensive properties for sale in Llanfihangel Ystrad?
The streets with the most expensive properties for sale in Llanfihangel Ystrad are Cysgod Y Gaer at an average of £425,000, Chapel Cottages at an average of £380,500 and Troedyrhiw at an average of £246,000.
What streets have the most affordable properties for sale in Llanfihangel Ystrad?
The streets with the most affordable properties for sale in Llanfihangel Ystrad are Bro Silin at an average of £129,250, Bro Henllys at an average of £168,507 and Cwrt Maesmynach at an average of £222,475.
Which train stations are available in or near Llanfihangel Ystrad?
Some of the train stations available in or near Llanfihangel Ystrad are Aberystwyth, Llanwrda and Cynghordy.
Property Price Paid in Llanfihangel Ystrad by Year
The average sold property price by year was:
| Year | Average Sold Price | Price Change |
Sold Properties
|
|---|---|---|---|
| 2024 | £190,000 | -60% |
1 Property |
| 2023 | £304,761 | -8% |
17 Properties |
| 2022 | £328,029 | 14% |
17 Properties |
| 2021 | £282,318 | 32% |
29 Properties |
| 2020 | £192,958 | -3% |
24 Properties |
| 2019 | £198,358 | 14% |
25 Properties |
| 2018 | £171,560 | -28% |
25 Properties |
| 2017 | £219,825 | 27% |
26 Properties |
| 2016 | £160,693 | -24% |
23 Properties |
| 2015 | £199,955 | 7% |
27 Properties |
| 2014 | £186,941 | -6% |
17 Properties |
| 2013 | £198,500 | 24% |
10 Properties |
| 2012 | £150,235 | -30% |
17 Properties |
| 2011 | £195,136 | 11% |
11 Properties |
| 2010 | £173,178 | -24% |
14 Properties |
| 2009 | £214,868 | 5% |
16 Properties |
| 2008 | £205,150 | 17% |
10 Properties |
| 2007 | £169,515 | -20% |
23 Properties |
| 2006 | £203,391 | -7% |
23 Properties |
| 2005 | £217,550 | 22% |
17 Properties |
| 2004 | £170,374 | 31% |
12 Properties |
| 2003 | £117,589 | 26% |
28 Properties |
| 2002 | £86,850 | 9% |
31 Properties |
| 2001 | £79,296 | -8% |
25 Properties |
| 2000 | £85,796 | 32% |
26 Properties |
| 1999 | £58,497 | -17% |
35 Properties |
| 1998 | £68,200 | 16% |
17 Properties |
| 1997 | £57,191 | 16% |
24 Properties |
| 1996 | £47,916 | 16% |
12 Properties |
| 1995 | £40,287 | - |
12 Properties |
Property Price per Property Type in Llanfihangel Ystrad
Here you can find historic sold price data in order to help with your property search.
The average Property Paid Price for specific property types in the last three years are:
| Property Type | Average Sold Price | Sold Properties |
|---|---|---|
| Semi Detached House | £174,571.00 | 14 Semi Detached Houses |
| Terraced House | £162,333.00 | 3 Terraced Houses |
| Detached House | £344,759.00 | 47 Detached Houses |