
Houses for sale & to rent in Llangybi, Lampeter
House Prices in Llangybi
Properties in Llangybi have an average house price of £317,497.00 and had 41 Property Transactions within the last 3 years¹.
Llangybi is an area in Lampeter, Sir Ceredigion - Ceredigion with 598 households², where the most expensive property was sold for £677,500.00.
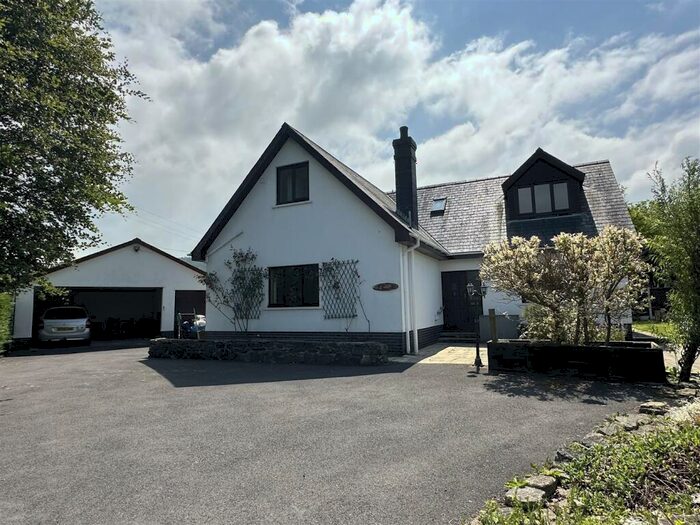
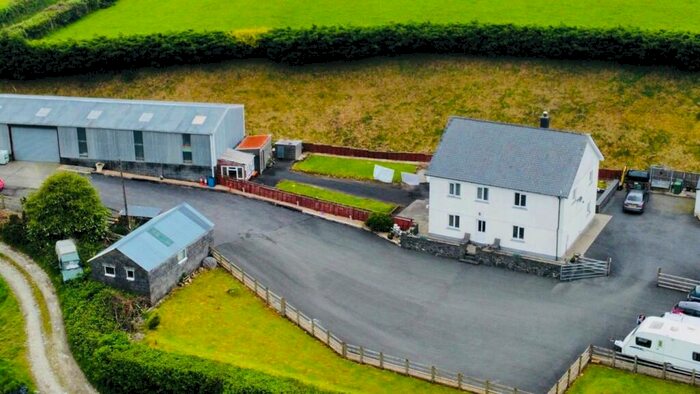
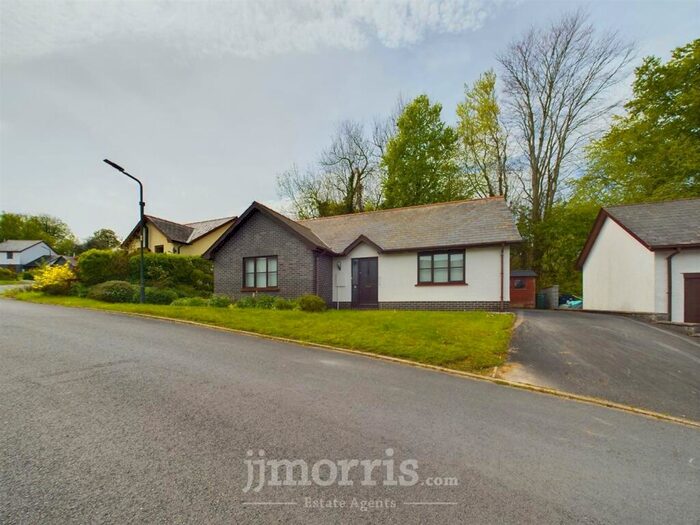
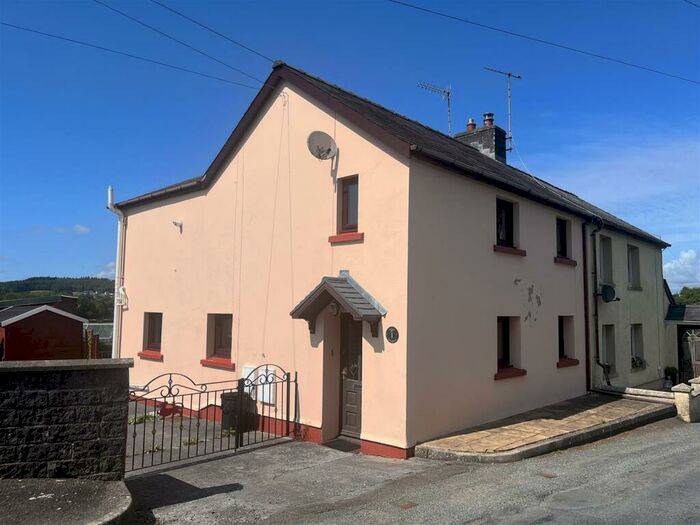
Properties for sale in Llangybi


Roads and Postcodes in Llangybi
Navigate through our locations to find the location of your next house in Llangybi, Lampeter for sale or to rent.
| Streets | Postcodes |
|---|---|
| Bro Clywedog | SA48 8LD |
| Bro Meillion | SA48 8HZ |
| Bro Tawela | SA48 8AT |
| Broderi | SA48 8NX |
| Clos Tawela | SA48 8AJ |
| Creuddyn Bridge | SA48 8BL |
| Cysgod Y Bryn | SA48 8JH |
| Forest Lane Terrace | SA48 8LZ |
| Llanfair Road | SA48 8JZ |
| Nant Fach | SA48 8NR |
| Sarn Helen | SA48 8HW |
| Water Street | SA48 8NG |
| SA48 8AB SA48 8AP SA48 8AR SA48 8AS SA48 8AX SA48 8HU SA48 8HX SA48 8HY SA48 8JA SA48 8JB SA48 8JD SA48 8JE SA48 8JF SA48 8JG SA48 8LA SA48 8LB SA48 8LG SA48 8LH SA48 8LJ SA48 8LQ SA48 8LY SA48 8NA SA48 8NB SA48 8NH SA48 8NJ SA48 8NN SA48 8NP SA48 8NQ SA48 8NU SA48 8NW SA48 8PA SA48 8PB SA48 8PR SA48 8AU SA48 8JQ SA48 8LE SA48 8LU SA48 8LX SA48 8ND SA48 8NE SA48 8NL SA48 8NY SA48 8PD SA48 8PE SA48 8PS |
Transport near Llangybi

- FAQ
- Price Paid By Year
- Property Type Price
Frequently asked questions about Llangybi
What is the average price for a property for sale in Llangybi?
The average price for a property for sale in Llangybi is £317,497. This amount is 22% higher than the average price in Lampeter. There are 169 property listings for sale in Llangybi.
What streets have the most expensive properties for sale in Llangybi?
The streets with the most expensive properties for sale in Llangybi are Water Street at an average of £320,000 and Clos Tawela at an average of £189,000.
What streets have the most affordable properties for sale in Llangybi?
The streets with the most affordable properties for sale in Llangybi are Bro Tawela at an average of £125,000 and Broderi at an average of £180,300.
Which train stations are available in or near Llangybi?
Some of the train stations available in or near Llangybi are Cynghordy, Llandovery and Llanwrda.
Property Price Paid in Llangybi by Year
The average sold property price by year was:
| Year | Average Sold Price | Price Change |
Sold Properties
|
|---|---|---|---|
| 2024 | £291,875 | 2% |
4 Properties |
| 2023 | £286,166 | -5% |
6 Properties |
| 2022 | £300,846 | -15% |
13 Properties |
| 2021 | £345,661 | 28% |
18 Properties |
| 2020 | £249,416 | 5% |
18 Properties |
| 2019 | £237,821 | 4% |
14 Properties |
| 2018 | £227,833 | 14% |
18 Properties |
| 2017 | £194,894 | 9% |
19 Properties |
| 2016 | £176,800 | -14% |
21 Properties |
| 2015 | £201,545 | 13% |
11 Properties |
| 2014 | £174,849 | -18% |
10 Properties |
| 2013 | £205,494 | 9% |
10 Properties |
| 2012 | £186,991 | -33% |
6 Properties |
| 2011 | £248,491 | 27% |
6 Properties |
| 2010 | £180,937 | -18% |
16 Properties |
| 2009 | £214,076 | 9% |
13 Properties |
| 2008 | £194,928 | -15% |
14 Properties |
| 2007 | £223,385 | 5% |
10 Properties |
| 2006 | £212,844 | 15% |
20 Properties |
| 2005 | £181,779 | 29% |
17 Properties |
| 2004 | £128,742 | -1% |
14 Properties |
| 2003 | £129,559 | 24% |
19 Properties |
| 2002 | £98,306 | 8% |
16 Properties |
| 2001 | £90,476 | 8% |
23 Properties |
| 2000 | £83,645 | -3% |
10 Properties |
| 1999 | £85,951 | 39% |
14 Properties |
| 1998 | £52,833 | -14% |
6 Properties |
| 1997 | £60,458 | 23% |
12 Properties |
| 1996 | £46,693 | -14% |
8 Properties |
| 1995 | £53,350 | - |
10 Properties |
Property Price per Property Type in Llangybi
Here you can find historic sold price data in order to help with your property search.
The average Property Paid Price for specific property types in the last three years are:
| Property Type | Average Sold Price | Sold Properties |
|---|---|---|
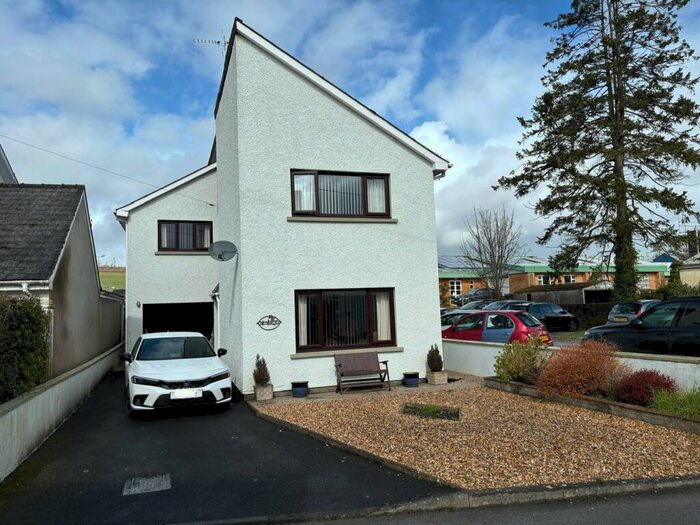
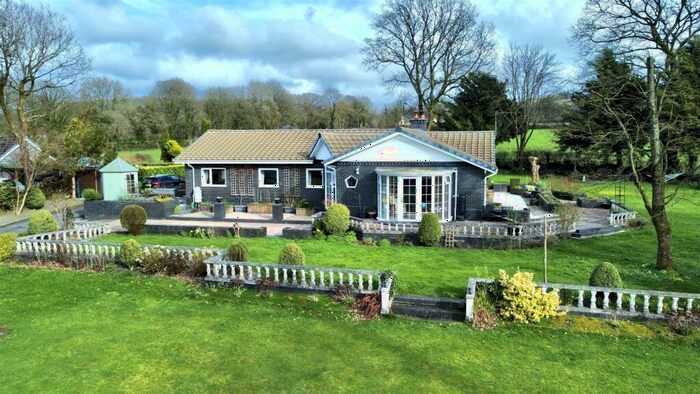
| Detached House | £370,365.00 | 30 Detached Houses |
| Terraced House | £168,000.00 | 4 Terraced Houses |
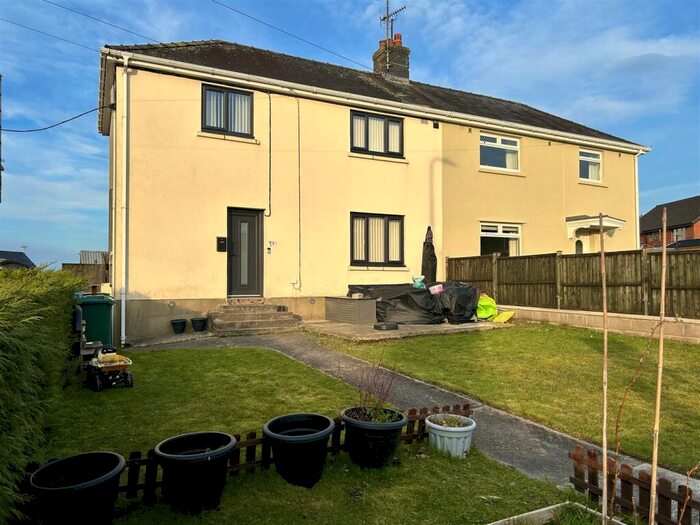
| Semi Detached House | £176,350.00 | 7 Semi Detached Houses |