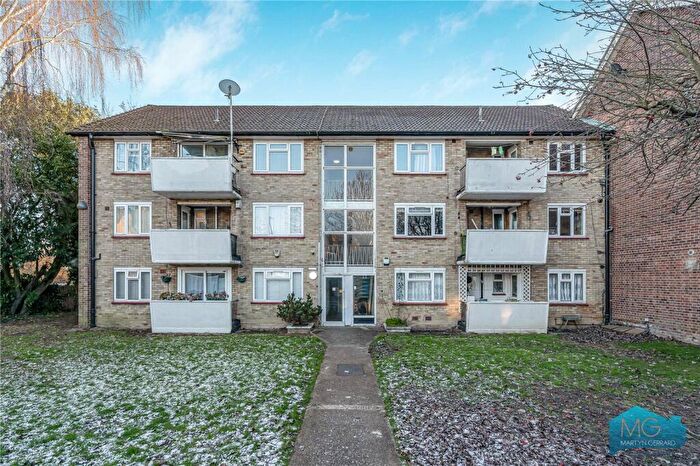
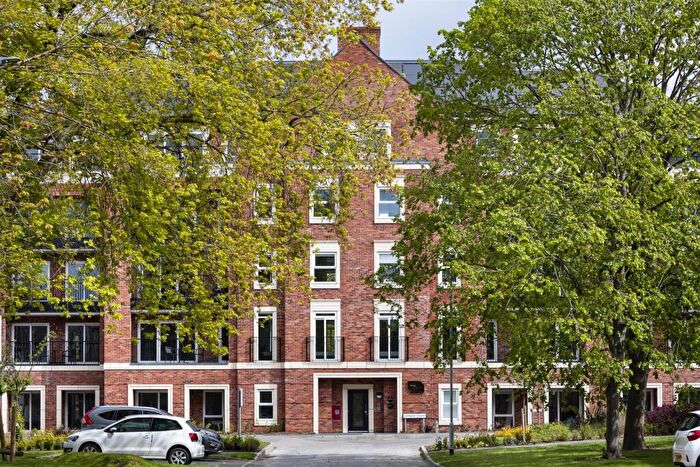
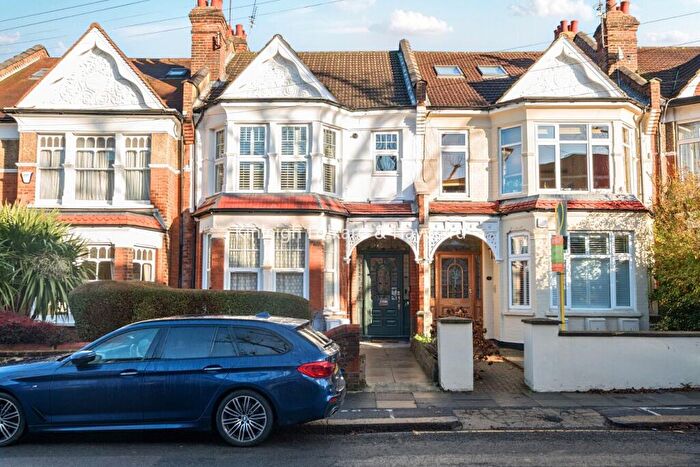
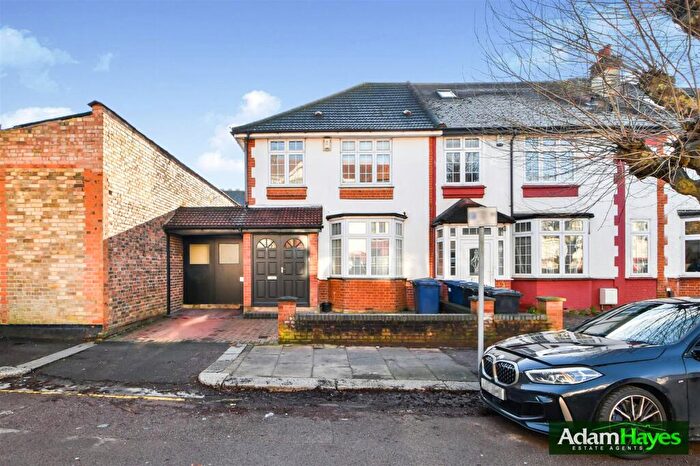
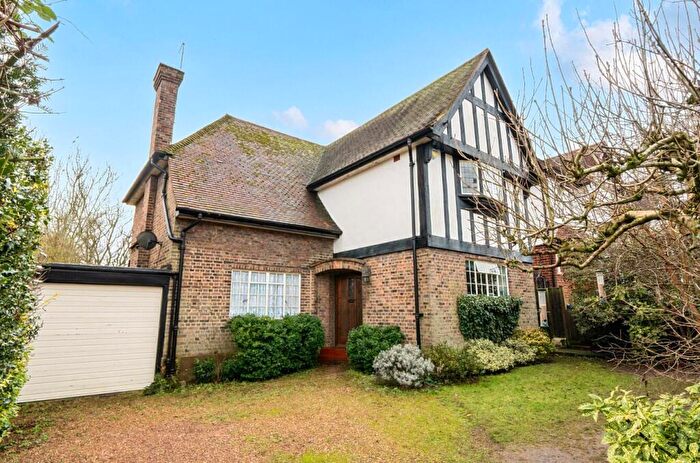
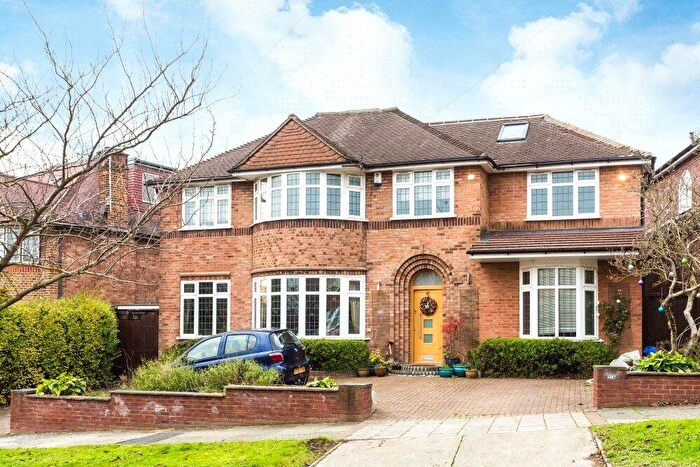
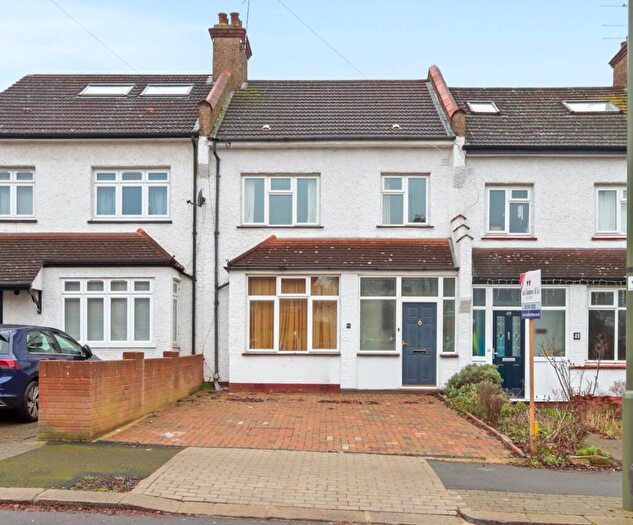
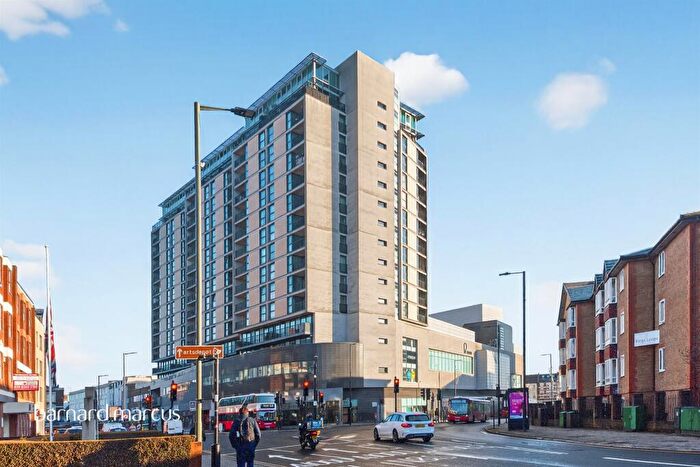
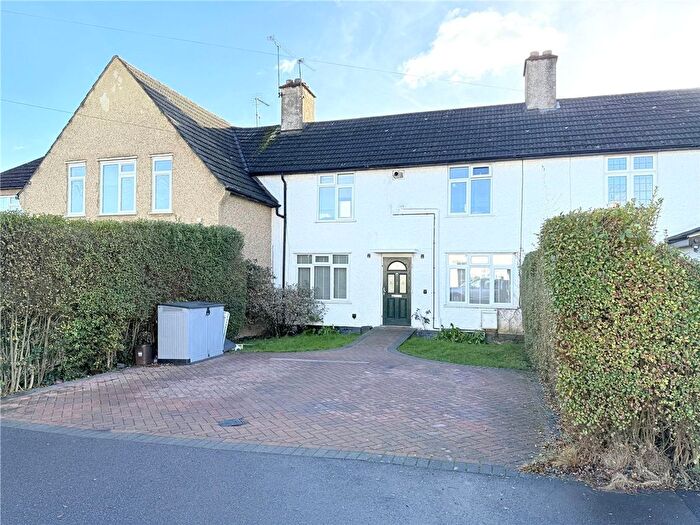
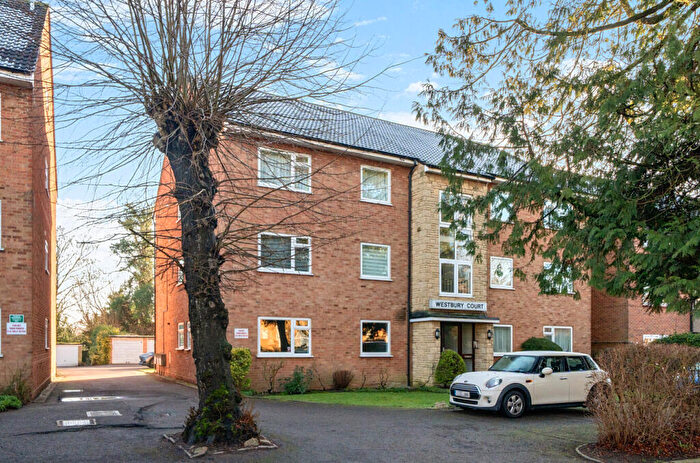
Houses for sale & to rent in Totteridge, London
House Prices in Totteridge
Properties in this part of Totteridge within London have an average house price of £864,160.00 and had 744 Property Transactions within the last 3 years¹. This area has 5,734 households² , where the most expensive property was sold for £9,500,000.00.
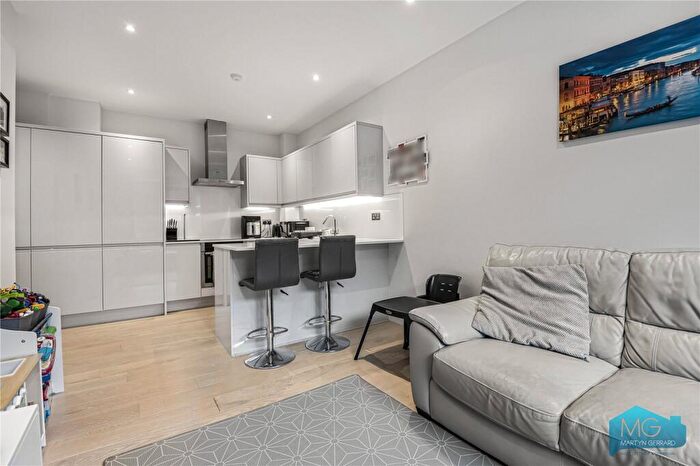
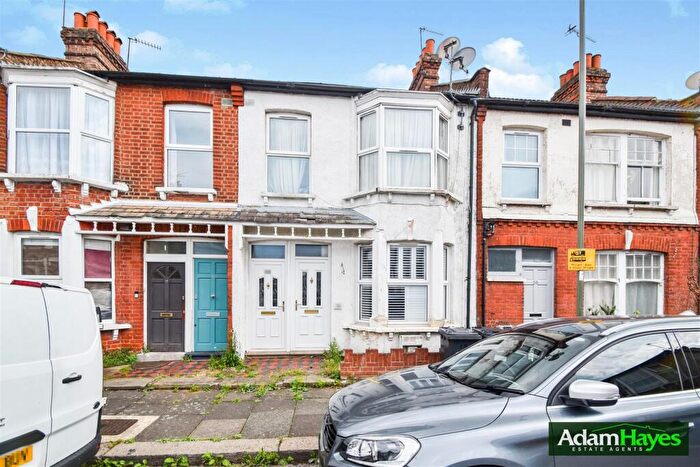
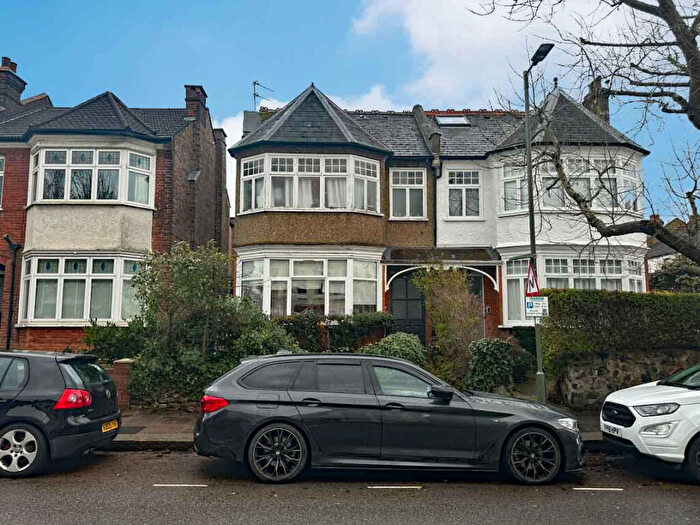
Properties for sale in Totteridge
Roads and Postcodes in Totteridge
Navigate through our locations to find the location of your next house in Totteridge, London for sale or to rent.
Transport near Totteridge
-
Totteridge and Whetstone Station
-
Woodside Park Station
-
West Finchley Station
-
Oakleigh Park Station
-
Mill Hill East Station
-
Finchley Central Station
-
New Barnet Station
-
High Barnet Station
-
New Southgate Station
-
Arnos Grove Station
- FAQ
- Price Paid By Year
- Property Type Price
Frequently asked questions about Totteridge
What is the average price for a property for sale in Totteridge?
The average price for a property for sale in Totteridge is £864,160. This amount is 7% higher than the average price in London. There are 8,262 property listings for sale in Totteridge.
What streets have the most expensive properties for sale in Totteridge?
The streets with the most expensive properties for sale in Totteridge are Grange Avenue at an average of £4,300,000, Totteridge Common at an average of £3,753,333 and Northcliffe Drive at an average of £3,150,000.
What streets have the most affordable properties for sale in Totteridge?
The streets with the most affordable properties for sale in Totteridge are Cliveden Close at an average of £285,333, Greenside Close at an average of £286,325 and Ashbourne Close at an average of £322,875.
Which train stations are available in or near Totteridge?
Some of the train stations available in or near Totteridge are Oakleigh Park, New Barnet and New Southgate.
Which tube stations are available in or near Totteridge?
Some of the tube stations available in or near Totteridge are Totteridge and Whetstone, Woodside Park and West Finchley.
Property Price Paid in Totteridge by Year
The average sold property price by year was:
| Year | Average Sold Price | Price Change |
Sold Properties
|
|---|---|---|---|
| 2025 | £795,171 | -3% |
110 Properties |
| 2024 | £822,176 | -1% |
211 Properties |
| 2023 | £828,734 | -17% |
203 Properties |
| 2022 | £971,610 | 8% |
220 Properties |
| 2021 | £893,209 | 13% |
262 Properties |
| 2020 | £774,837 | 4% |
225 Properties |
| 2019 | £743,070 | 12% |
252 Properties |
| 2018 | £654,696 | -3% |
262 Properties |
| 2017 | £676,031 | - |
336 Properties |
| 2016 | £676,178 | -12% |
232 Properties |
| 2015 | £757,013 | 4% |
188 Properties |
| 2014 | £729,637 | 5% |
192 Properties |
| 2013 | £692,459 | 12% |
226 Properties |
| 2012 | £607,404 | 10% |
166 Properties |
| 2011 | £548,687 | -13% |
191 Properties |
| 2010 | £622,137 | 11% |
192 Properties |
| 2009 | £555,438 | 5% |
145 Properties |
| 2008 | £530,401 | 2% |
114 Properties |
| 2007 | £519,975 | 7% |
272 Properties |
| 2006 | £483,280 | 14% |
271 Properties |
| 2005 | £416,502 | -4% |
240 Properties |
| 2004 | £434,166 | 15% |
254 Properties |
| 2003 | £367,469 | 6% |
217 Properties |
| 2002 | £344,538 | 5% |
298 Properties |
| 2001 | £325,710 | 16% |
235 Properties |
| 2000 | £274,039 | 17% |
300 Properties |
| 1999 | £227,145 | 4% |
339 Properties |
| 1998 | £217,669 | 7% |
260 Properties |
| 1997 | £202,627 | 18% |
305 Properties |
| 1996 | £166,541 | 21% |
255 Properties |
| 1995 | £131,286 | - |
245 Properties |
Property Price per Property Type in Totteridge
Here you can find historic sold price data in order to help with your property search.
The average Property Paid Price for specific property types in the last three years are:
| Property Type | Average Sold Price | Sold Properties |
|---|---|---|
| Semi Detached House | £1,042,900.00 | 188 Semi Detached Houses |
| Detached House | £1,952,339.00 | 100 Detached Houses |
| Terraced House | £765,140.00 | 105 Terraced Houses |
| Flat | £488,024.00 | 351 Flats |

