
Houses for sale & to rent in West Hendon, London
House Prices in West Hendon
Properties in this part of West Hendon within London have an average house price of £582k and had 346 Property Transactions within the last 3 years¹. This area has 6,194 households² , where the most expensive property was sold for £2.25M.
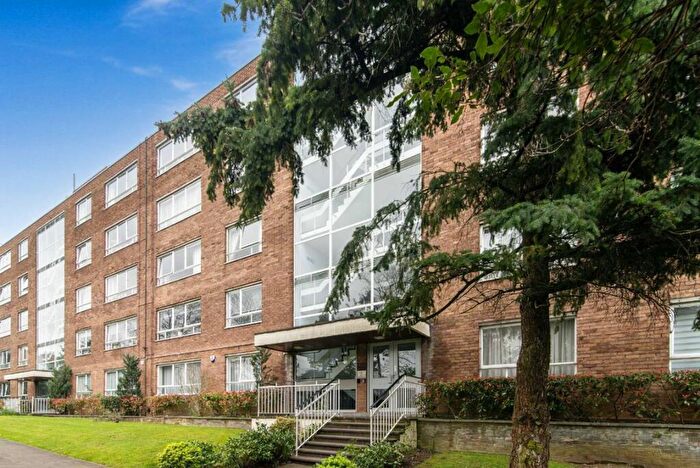
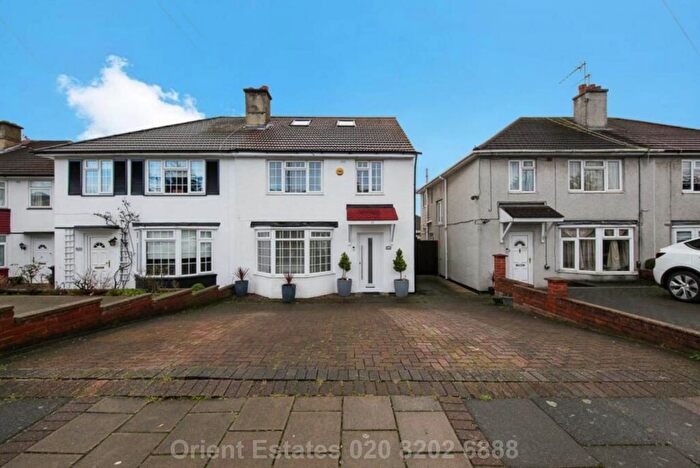
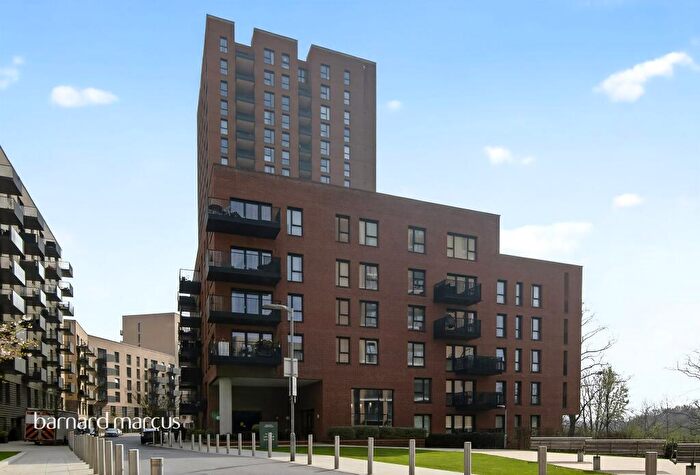
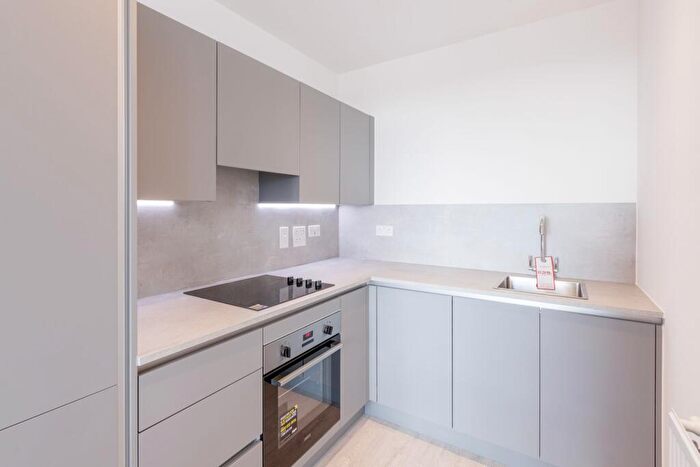
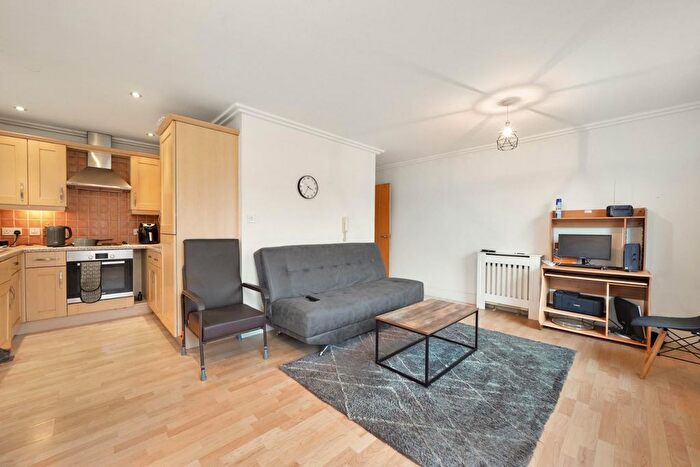
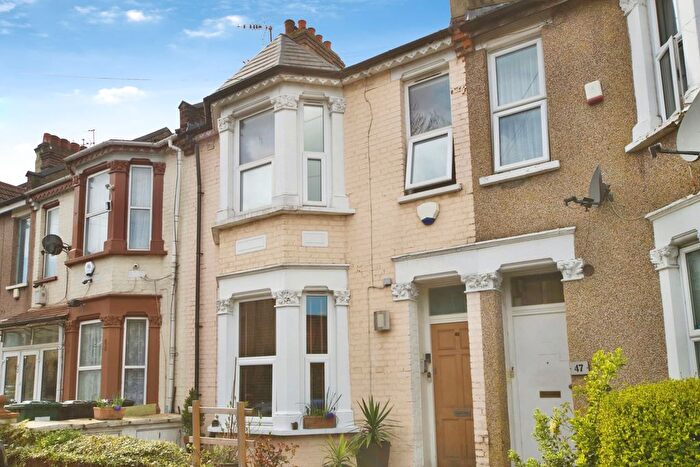
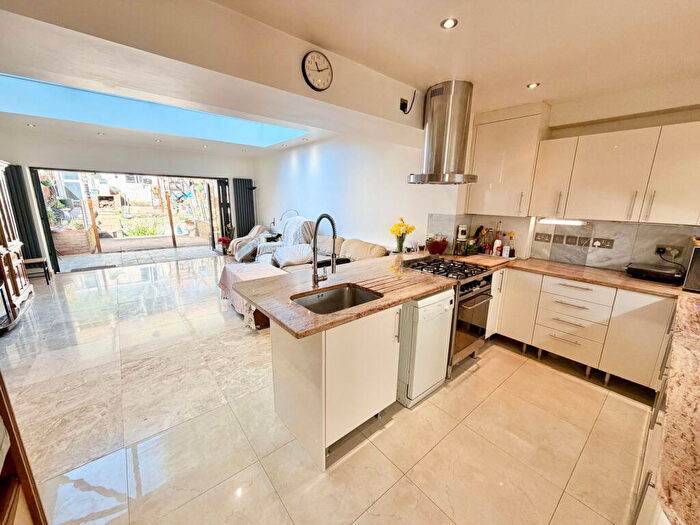
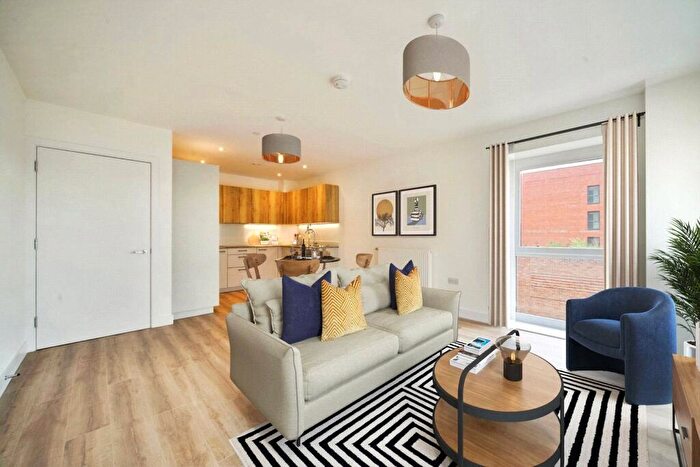
Properties for sale in West Hendon
![]()
If you are looking to sell your house, let it out, or receive a property valuation, an expert can help you.
Click the button below to get started.
Roads and Postcodes in West Hendon
Navigate through our locations to find the location of your next house in West Hendon, London for sale or to rent.
Transport near West Hendon
-
 Hendon Station
 -
 Hendon Central Station
 -
Brent Cross Station
-
Colindale Station
-
Cricklewood Station
-
Golders Green Station
-
Neasden Station
-
Kingsbury Station
-
Dollis Hill Station
-
Burnt Oak Station
- FAQ
- Price Paid By Year
- Property Type Price
Frequently asked questions about West Hendon
What is the average price for a property for sale in West Hendon?
The average price for a property for sale in West Hendon is £582,302. This amount is 26% lower than the average price in London. There are 3,164 property listings for sale in West Hendon.
What streets have the most expensive properties for sale in West Hendon?
The streets with the most expensive properties for sale in West Hendon are Woodward Avenue at an average of £1,662,500, Allington Road at an average of £1,616,666 and Edgeworth Crescent at an average of £1,440,000.
What streets have the most affordable properties for sale in West Hendon?
The streets with the most affordable properties for sale in West Hendon are Garrick Road at an average of £158,600, Caldicote Green at an average of £175,000 and Amroth Green at an average of £191,000.
Which train stations are available in or near West Hendon?
Some of the train stations available in or near West Hendon are Hendon and Cricklewood.
Which tube stations are available in or near West Hendon?
Some of the tube stations available in or near West Hendon are Hendon Central, Brent Cross and Colindale.
Property Price Paid in West Hendon by Year
The average sold property price by year was:
| Year | Average Sold Price | Price Change |
Sold Properties
|
|---|---|---|---|
| 2026 | £1,100,000 | 51% |
1 Property |
| 2025 | £543,139 | -11% |
115 Properties |
| 2024 | £603,563 | 1% |
113 Properties |
| 2023 | £595,837 | -19% |
117 Properties |
| 2022 | £707,379 | 22% |
178 Properties |
| 2021 | £551,754 | 1% |
194 Properties |
| 2020 | £547,331 | 13% |
136 Properties |
| 2019 | £475,841 | -6% |
247 Properties |
| 2018 | £506,391 | -3% |
260 Properties |
| 2017 | £519,105 | 6% |
154 Properties |
| 2016 | £487,659 | 8% |
297 Properties |
| 2015 | £450,190 | 9% |
299 Properties |
| 2014 | £408,658 | 19% |
183 Properties |
| 2013 | £329,431 | -5% |
277 Properties |
| 2012 | £344,332 | -15% |
147 Properties |
| 2011 | £396,401 | 13% |
141 Properties |
| 2010 | £345,886 | 20% |
159 Properties |
| 2009 | £278,157 | 1% |
138 Properties |
| 2008 | £274,453 | -20% |
148 Properties |
| 2007 | £330,385 | 16% |
266 Properties |
| 2006 | £278,156 | -1% |
244 Properties |
| 2005 | £280,775 | 6% |
212 Properties |
| 2004 | £264,013 | 5% |
230 Properties |
| 2003 | £250,010 | 17% |
283 Properties |
| 2002 | £207,443 | 8% |
270 Properties |
| 2001 | £191,847 | 18% |
322 Properties |
| 2000 | £156,863 | 15% |
296 Properties |
| 1999 | £132,697 | 13% |
291 Properties |
| 1998 | £116,103 | 5% |
283 Properties |
| 1997 | £110,460 | 16% |
247 Properties |
| 1996 | £92,513 | 10% |
235 Properties |
| 1995 | £83,078 | - |
200 Properties |
Property Price per Property Type in West Hendon
Here you can find historic sold price data in order to help with your property search.
The average Property Paid Price for specific property types in the last three years are:
| Property Type | Average Sold Price | Sold Properties |
|---|---|---|
| Semi Detached House | £716,901.00 | 75 Semi Detached Houses |
| Detached House | £1,150,770.00 | 37 Detached Houses |
| Terraced House | £575,140.00 | 69 Terraced Houses |
| Flat | £396,641.00 | 165 Flats |