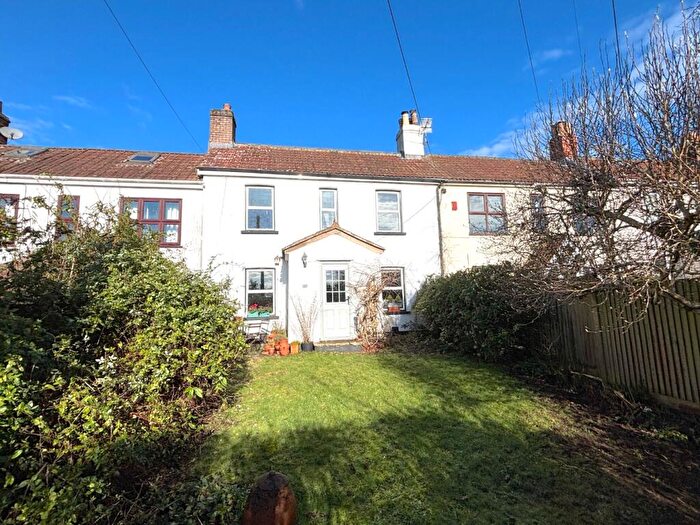
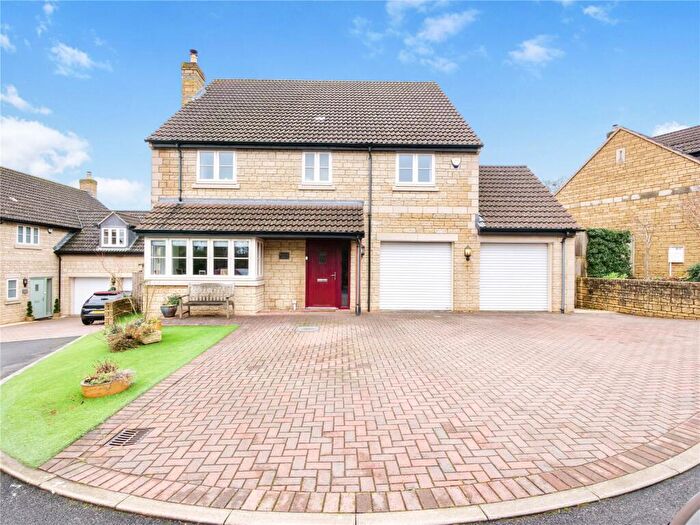
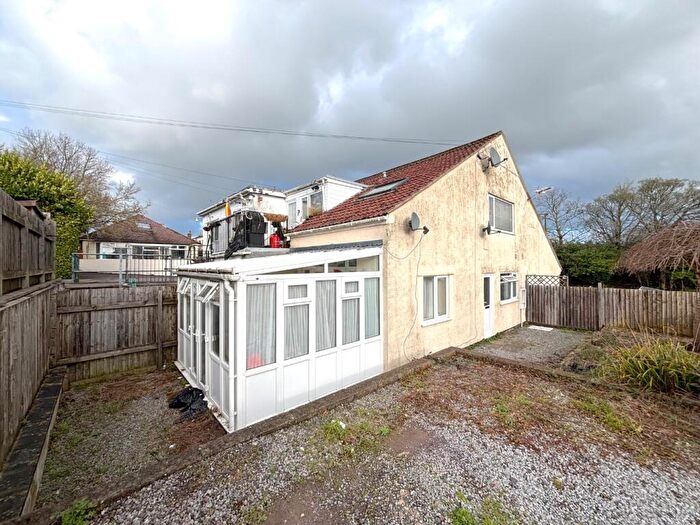
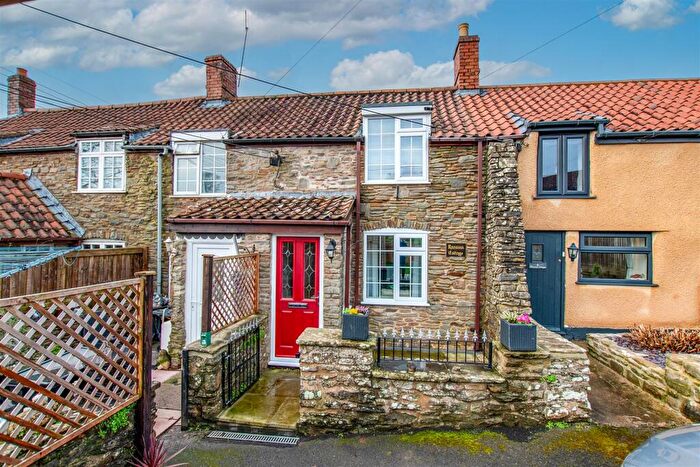
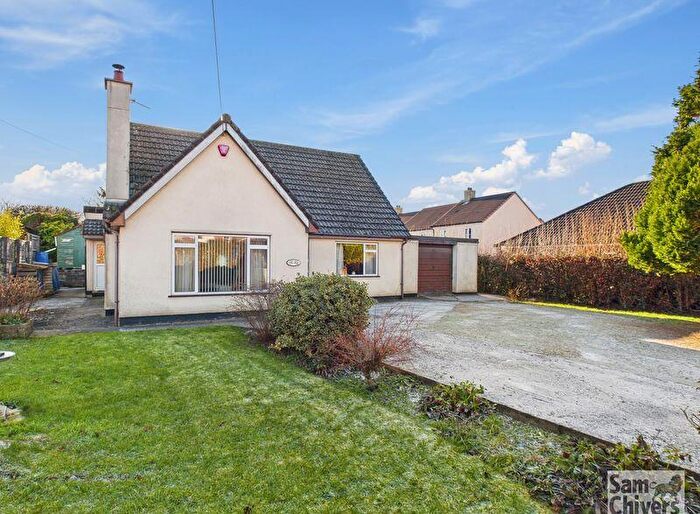
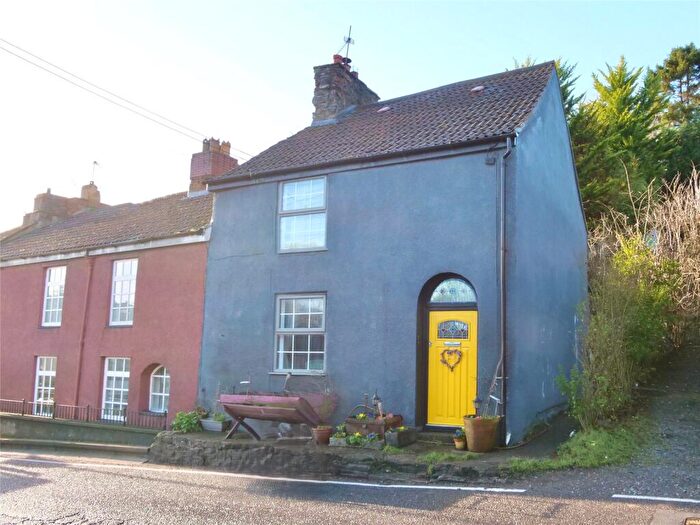
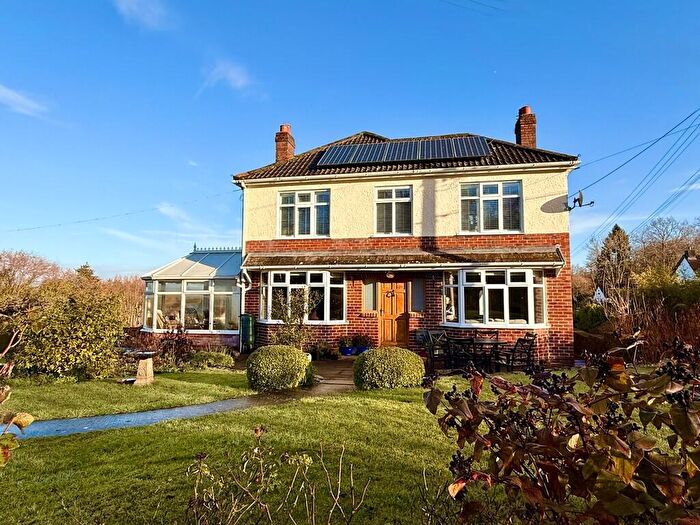
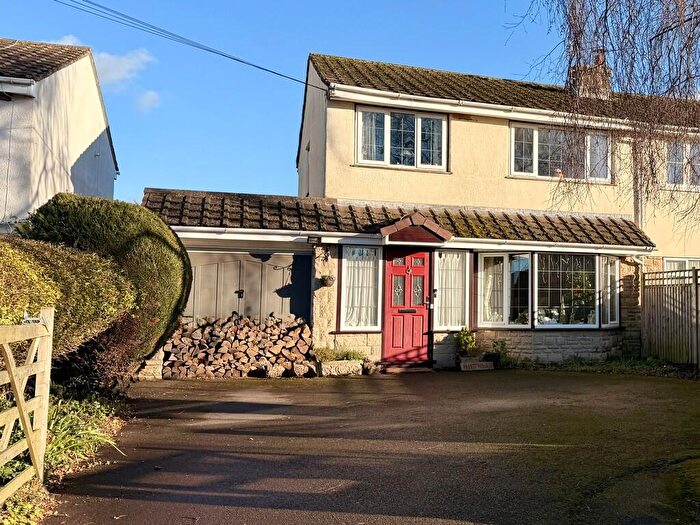
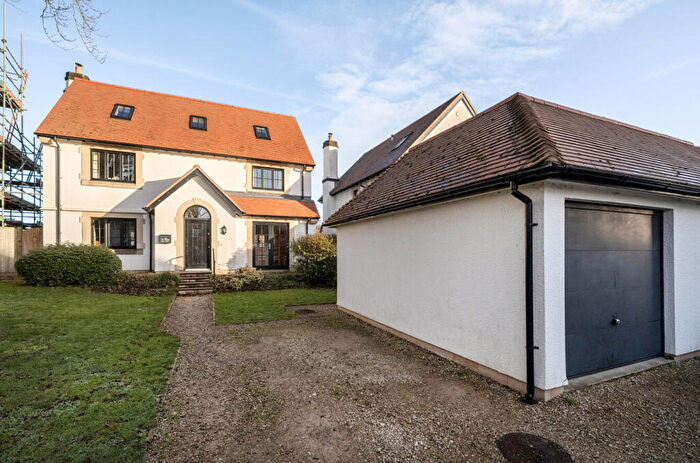
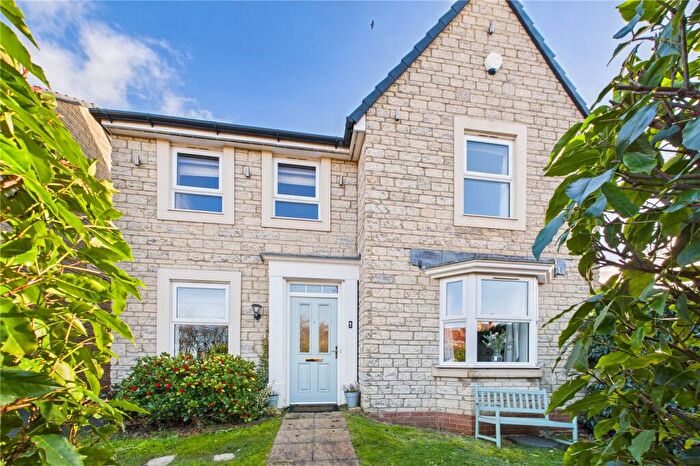
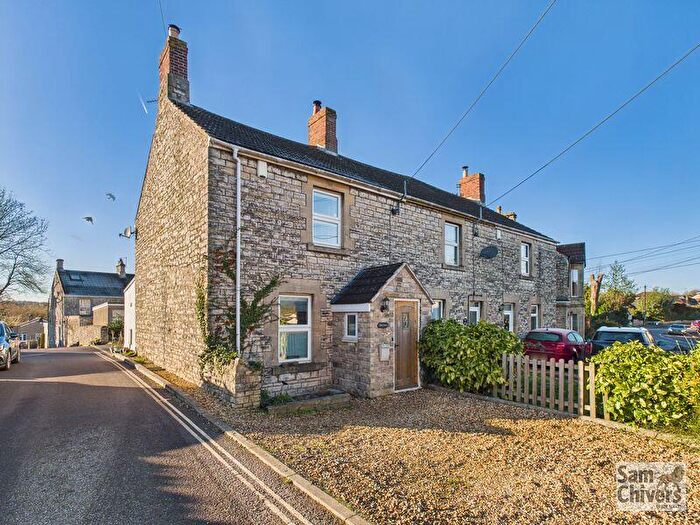
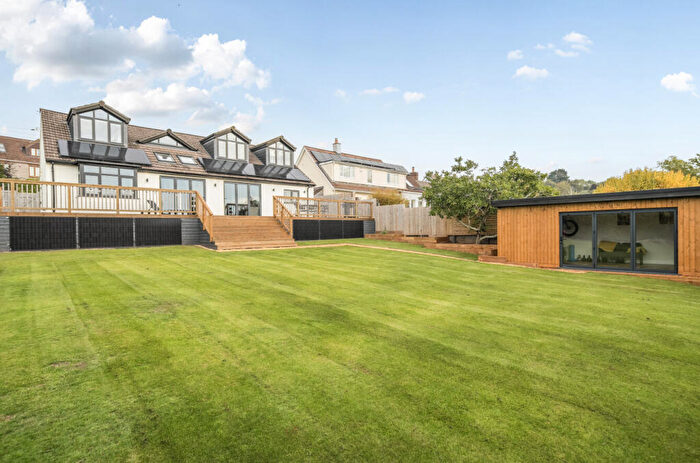
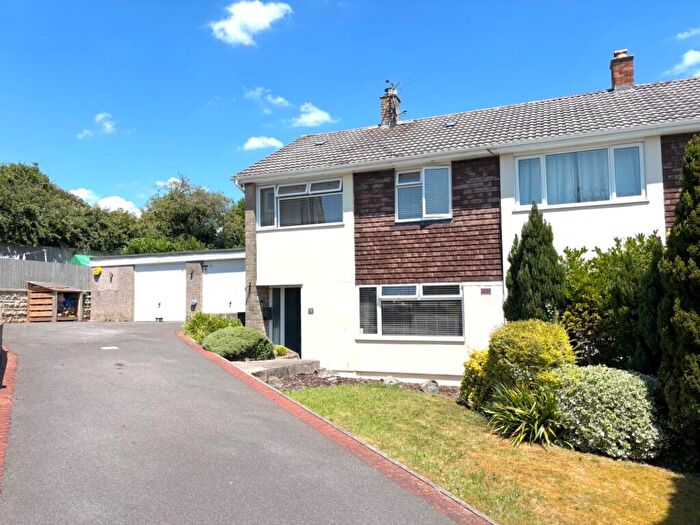
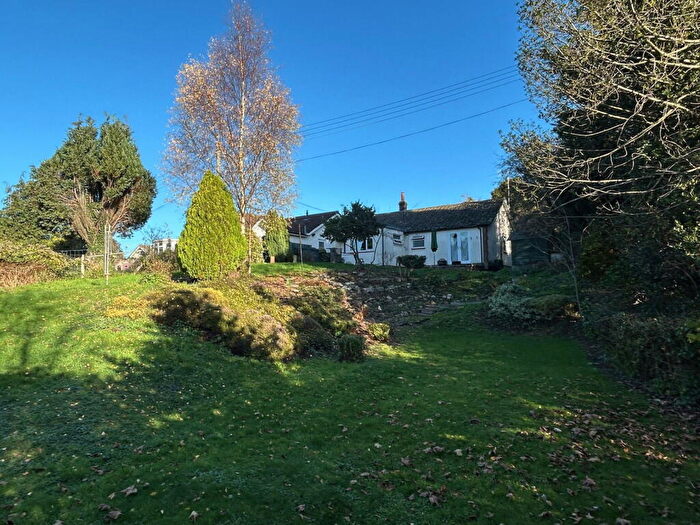
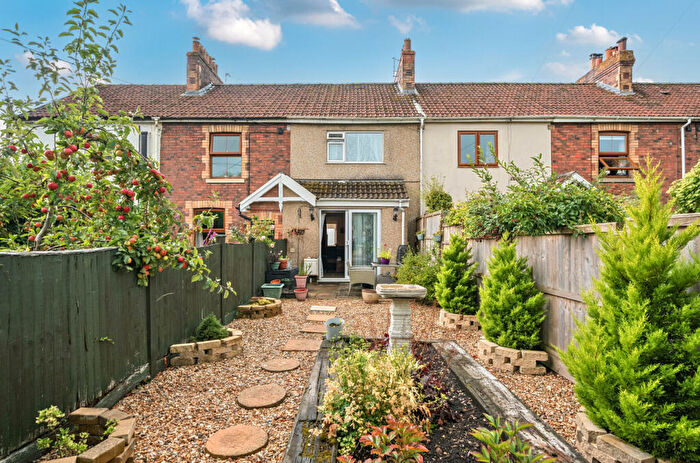
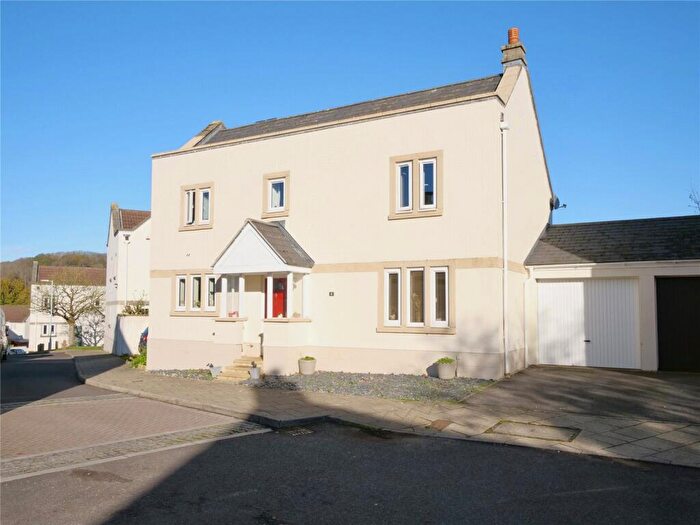
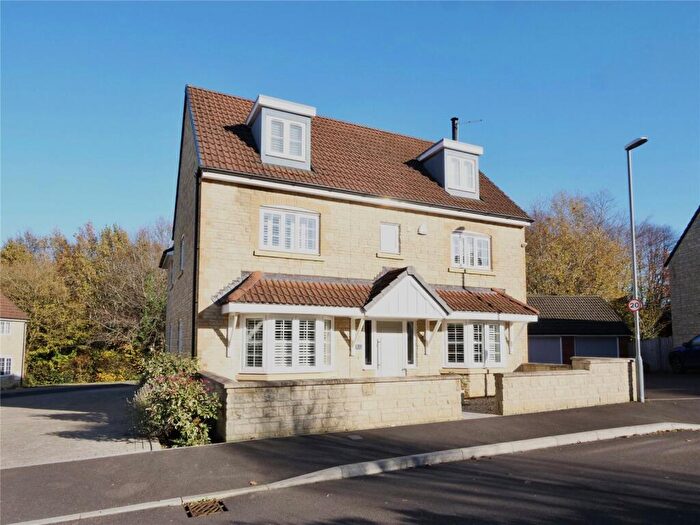
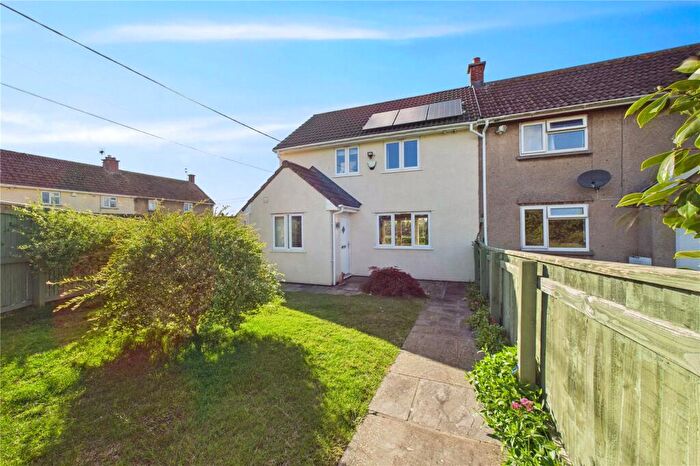
Houses for sale & to rent in Clutton, Bristol
House Prices in Clutton
Properties in Clutton have an average house price of £439,226.00 and had 55 Property Transactions within the last 3 years¹.
Clutton is an area in Bristol, Bath and North East Somerset with 923 households², where the most expensive property was sold for £1,100,000.00.
Properties for sale in Clutton
Roads and Postcodes in Clutton
Navigate through our locations to find the location of your next house in Clutton, Bristol for sale or to rent.
| Streets | Postcodes |
|---|---|
| Barn Lane | BS39 5QW |
| Bendalls Bridge | BS39 5SJ |
| Bromley Road | BS39 4DF BS39 4DJ |
| Bromley Villas | BS39 4DE |
| Broomhill Lane | BS39 5SA BS39 5SD |
| Burchill Close | BS39 5PR |
| Carlton Close | BS39 5SS |
| Church Lane | BS39 5SE BS39 5SF |
| Church Square | BS39 5SH |
| Clutton Hill | BS39 5QE BS39 5QQ |
| Clutton Hill Cottages | BS39 5QF |
| Cooks Hill | BS39 5RB BS39 5RD BS39 5RE |
| Cuckoo Lane | BS39 5QD BS39 6YJ |
| Featherbed Lane | BS39 5RL |
| Furnleaze | BS39 5SB |
| Gloucester Cottages | BS39 4EJ |
| Greenridge | BS39 5PE |
| Greensbrook | BS39 5PG |
| Greyfield Wood | BS39 6YE |
| Highfields | BS39 4DH |
| Holbrook | BS39 4DT |
| King Lane | BS39 5QA |
| Kings Oak Meadow | BS39 5SU |
| Lower Bristol Road | BS39 5PA BS39 5PB BS39 5QT |
| Lower Clutton Hill | BS39 5PH |
| Main Road | BS39 4NR |
| Maynard Terrace | BS39 5PL BS39 5PN BS39 5PW |
| Maypole Close | BS39 5PP |
| Moorsfield | BS39 5SR |
| Northend | BS39 5QP BS39 5QS |
| Old Tarnwell | BS39 4EA |
| Rogers Close | BS39 5RS BS39 5RT BS39 5RU BS39 5RX |
| Sandy Lane | BS39 4EL |
| Stanton Wick | BS39 4BX BS39 4BY BS39 4BZ BS39 4DA BS39 4DB BS39 4DD |
| Station Road | BS39 5PD BS39 5PF BS39 5RA |
| Sunnyside | BS39 5QG |
| Tarnwell | BS39 4DZ BS39 4ED BS39 4EE |
| The Barton | BS39 4DY |
| The Crescent | BS39 4DG |
| The Drive | BS39 4DQ |
| The Mead | BS39 5RF BS39 5RQ |
| The Orchard | BS39 4DS |
| The Sidings | BS39 5EF |
| Tynings | BS39 5RR BS39 5RZ |
| Tynings Way | BS39 5RY |
| Upper Bristol Road | BS39 5RH BS39 5RW BS39 5TA BS39 5TB BS39 5TE |
| Upper Stanton | BS39 4EF BS39 4EG BS39 4EQ |
| Valley View | BS39 5SN |
| Venus Lane | BS39 5SP BS39 5SW |
| Warwick Gardens | BS39 5RP |
| Wick Lane | BS39 4BT BS39 4BU |
| BS39 4EN BS39 4EP BS39 4ER BS39 4ES BS39 4EW BS39 4JL BS39 4NH BS39 4NJ BS39 4NN BS39 4NW |
Transport near Clutton
-
Keynsham Station
-
Parson Street Station
-
Bedminster Station
-
Bristol Temple Meads Station
-
Oldfield Park Station
-
Lawrence Hill Station
-
Stapleton Road Station
-
Bath Spa Station
-
Clifton Down Station
-
Montpelier Station
- FAQ
- Price Paid By Year
- Property Type Price
Frequently asked questions about Clutton
What is the average price for a property for sale in Clutton?
The average price for a property for sale in Clutton is £439,226. This amount is 4% higher than the average price in Bristol. There are 526 property listings for sale in Clutton.
What streets have the most expensive properties for sale in Clutton?
The streets with the most expensive properties for sale in Clutton are The Barton at an average of £770,000, Broomhill Lane at an average of £560,000 and Kings Oak Meadow at an average of £525,000.
What streets have the most affordable properties for sale in Clutton?
The streets with the most affordable properties for sale in Clutton are Clutton Hill at an average of £250,000, Tynings at an average of £267,500 and Bromley Road at an average of £269,100.
Which train stations are available in or near Clutton?
Some of the train stations available in or near Clutton are Keynsham, Parson Street and Bedminster.
Property Price Paid in Clutton by Year
The average sold property price by year was:
| Year | Average Sold Price | Price Change |
Sold Properties
|
|---|---|---|---|
| 2025 | £396,452 | -11% |
22 Properties |
| 2024 | £440,022 | -19% |
22 Properties |
| 2023 | £523,181 | 16% |
11 Properties |
| 2022 | £440,295 | 4% |
22 Properties |
| 2021 | £423,038 | 0,2% |
32 Properties |
| 2020 | £422,338 | 25% |
31 Properties |
| 2019 | £317,611 | -11% |
18 Properties |
| 2018 | £350,998 | 6% |
37 Properties |
| 2017 | £330,871 | 7% |
35 Properties |
| 2016 | £308,079 | -3% |
36 Properties |
| 2015 | £316,272 | 8% |
32 Properties |
| 2014 | £290,557 | 5% |
35 Properties |
| 2013 | £276,807 | -12% |
13 Properties |
| 2012 | £309,450 | 4% |
21 Properties |
| 2011 | £298,352 | -8% |
22 Properties |
| 2010 | £323,382 | 17% |
29 Properties |
| 2009 | £269,226 | -8% |
23 Properties |
| 2008 | £289,500 | -6% |
19 Properties |
| 2007 | £306,772 | 15% |
31 Properties |
| 2006 | £261,388 | 8% |
42 Properties |
| 2005 | £239,443 | 1% |
36 Properties |
| 2004 | £236,226 | 1% |
28 Properties |
| 2003 | £233,273 | 24% |
36 Properties |
| 2002 | £177,554 | 13% |
47 Properties |
| 2001 | £154,784 | 6% |
39 Properties |
| 2000 | £145,830 | -4% |
38 Properties |
| 1999 | £151,166 | 31% |
39 Properties |
| 1998 | £104,036 | -11% |
33 Properties |
| 1997 | £115,122 | 16% |
47 Properties |
| 1996 | £96,897 | 10% |
58 Properties |
| 1995 | £86,941 | - |
31 Properties |
Property Price per Property Type in Clutton
Here you can find historic sold price data in order to help with your property search.
The average Property Paid Price for specific property types in the last three years are:
| Property Type | Average Sold Price | Sold Properties |
|---|---|---|
| Semi Detached House | £348,941.00 | 17 Semi Detached Houses |
| Detached House | £522,712.00 | 28 Detached Houses |
| Terraced House | £358,950.00 | 10 Terraced Houses |

