
Houses for sale & to rent in Keynsham North, Bristol
House Prices in Keynsham North
Properties in Keynsham North have an average house price of £350,127.00 and had 300 Property Transactions within the last 3 years¹.
Keynsham North is an area in Bristol, Bath and North East Somerset with 2,238 households², where the most expensive property was sold for £900,000.00.
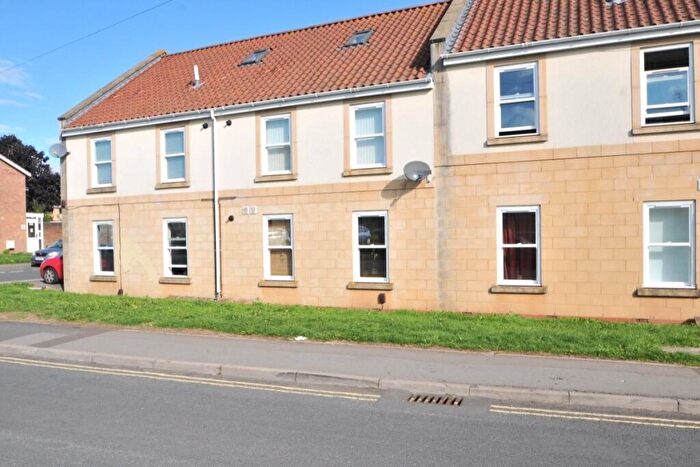
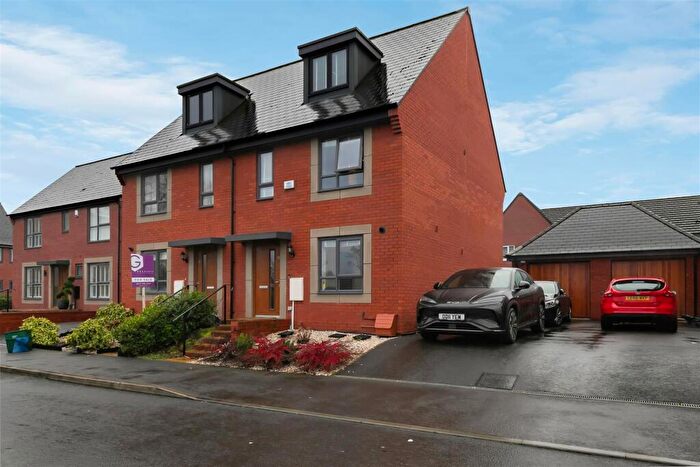
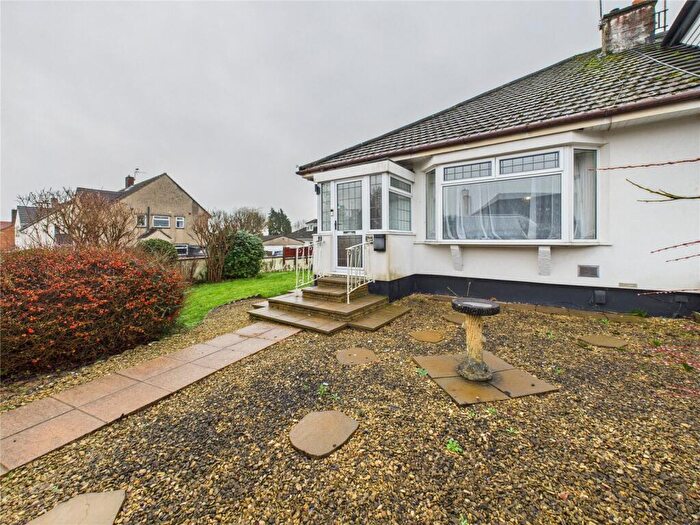
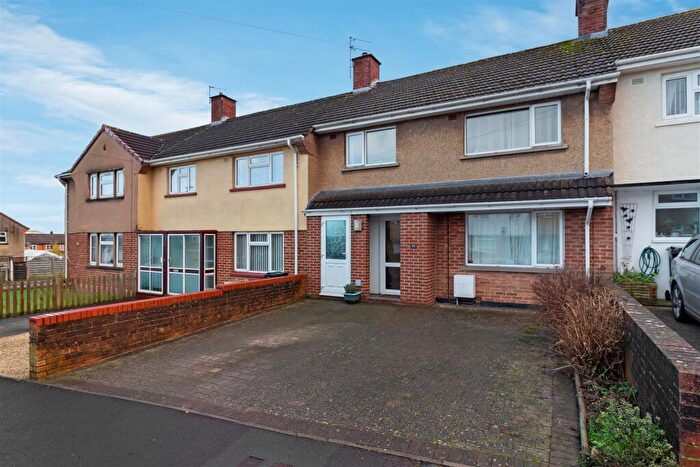
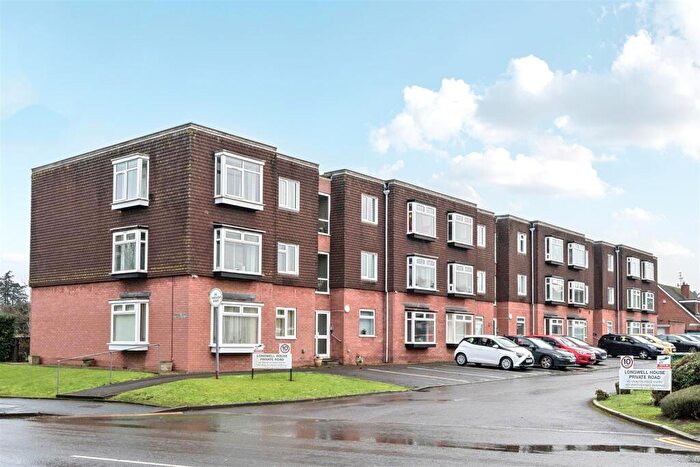
Properties for sale in Keynsham North
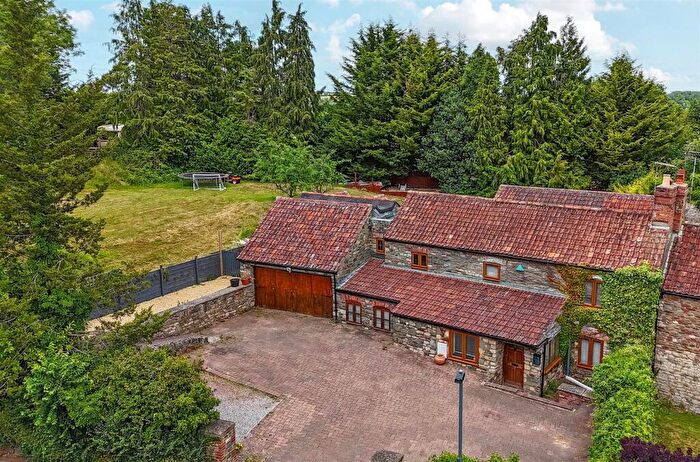
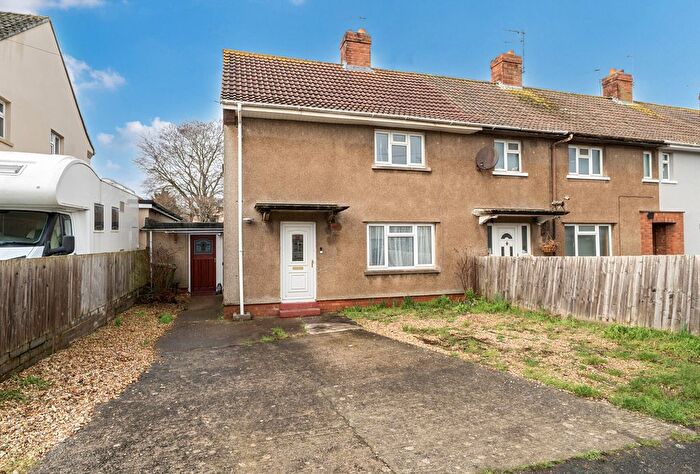
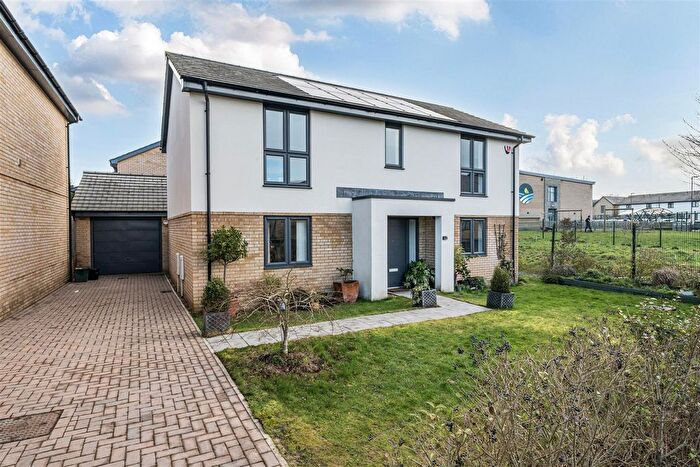
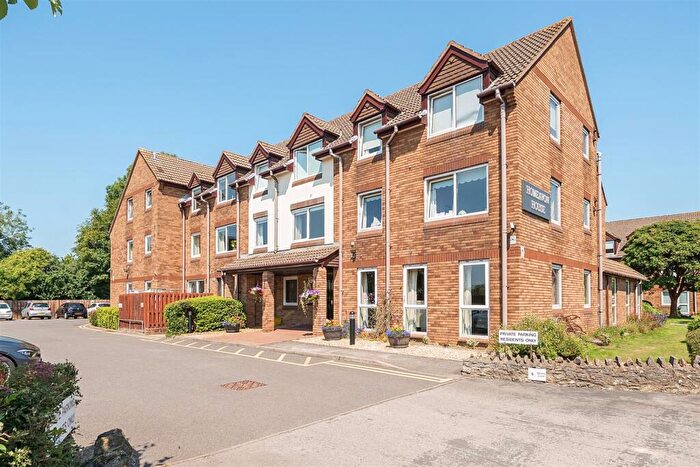

![]()
If you are looking to sell your house, let it out, or receive a property valuation, an expert can help you.
Click the button below to get started.
Roads and Postcodes in Keynsham North
Navigate through our locations to find the location of your next house in Keynsham North, Bristol for sale or to rent.
Transport near Keynsham North
-
 Keynsham Station
 -
Lawrence Hill Station
-
Bristol Temple Meads Station
-
Bedminster Station
-
Stapleton Road Station
-
Parson Street Station
- FAQ
- Price Paid By Year
- Property Type Price
Frequently asked questions about Keynsham North
What is the average price for a property for sale in Keynsham North?
The average price for a property for sale in Keynsham North is £350,127. This amount is 17% lower than the average price in Bristol. There are 1,695 property listings for sale in Keynsham North.
What streets have the most expensive properties for sale in Keynsham North?
The streets with the most expensive properties for sale in Keynsham North are The Redwoods at an average of £815,000, Hadrian Close at an average of £675,000 and Severus Street at an average of £635,700.
What streets have the most affordable properties for sale in Keynsham North?
The streets with the most affordable properties for sale in Keynsham North are Harlech Close at an average of £102,000, DANES LANE at an average of £192,500 and Via Traversus at an average of £213,000.
Which train stations are available in or near Keynsham North?
Some of the train stations available in or near Keynsham North are Keynsham, Lawrence Hill and Bristol Temple Meads.
Property Price Paid in Keynsham North by Year
The average sold property price by year was:
| Year | Average Sold Price | Price Change |
Sold Properties
|
|---|---|---|---|
| 2025 | £376,850 | 4% |
87 Properties |
| 2024 | £360,255 | 10% |
91 Properties |
| 2023 | £323,515 | -14% |
122 Properties |
| 2022 | £369,336 | 9% |
148 Properties |
| 2021 | £334,876 | 6% |
185 Properties |
| 2020 | £313,661 | -7% |
189 Properties |
| 2019 | £335,349 | -2% |
185 Properties |
| 2018 | £343,171 | 1% |
180 Properties |
| 2017 | £340,022 | 7% |
197 Properties |
| 2016 | £315,708 | 13% |
160 Properties |
| 2015 | £275,475 | 14% |
176 Properties |
| 2014 | £235,598 | 8% |
112 Properties |
| 2013 | £217,108 | 10% |
79 Properties |
| 2012 | £195,956 | -2% |
74 Properties |
| 2011 | £199,511 | 4% |
51 Properties |
| 2010 | £192,468 | 7% |
59 Properties |
| 2009 | £178,873 | -14% |
65 Properties |
| 2008 | £203,109 | -3% |
44 Properties |
| 2007 | £208,485 | 4% |
84 Properties |
| 2006 | £199,484 | 8% |
129 Properties |
| 2005 | £182,881 | -8% |
95 Properties |
| 2004 | £198,174 | 11% |
98 Properties |
| 2003 | £177,167 | 23% |
70 Properties |
| 2002 | £136,181 | 12% |
104 Properties |
| 2001 | £119,344 | 11% |
85 Properties |
| 2000 | £106,166 | 16% |
82 Properties |
| 1999 | £88,855 | 17% |
78 Properties |
| 1998 | £73,559 | -0,3% |
61 Properties |
| 1997 | £73,795 | 17% |
84 Properties |
| 1996 | £61,311 | -5% |
101 Properties |
| 1995 | £64,495 | - |
58 Properties |
Property Price per Property Type in Keynsham North
Here you can find historic sold price data in order to help with your property search.
The average Property Paid Price for specific property types in the last three years are:
| Property Type | Average Sold Price | Sold Properties |
|---|---|---|
| Flat | £275,035.00 | 121 Flats |
| Semi Detached House | £425,476.00 | 73 Semi Detached Houses |
| Detached House | £558,556.00 | 22 Detached Houses |
| Terraced House | £338,223.00 | 84 Terraced Houses |