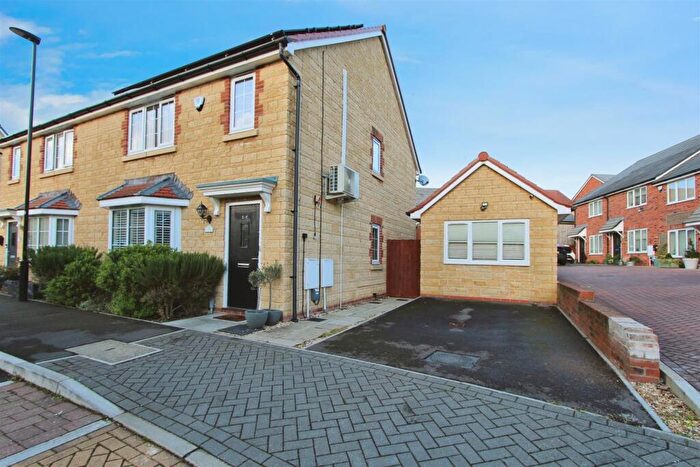
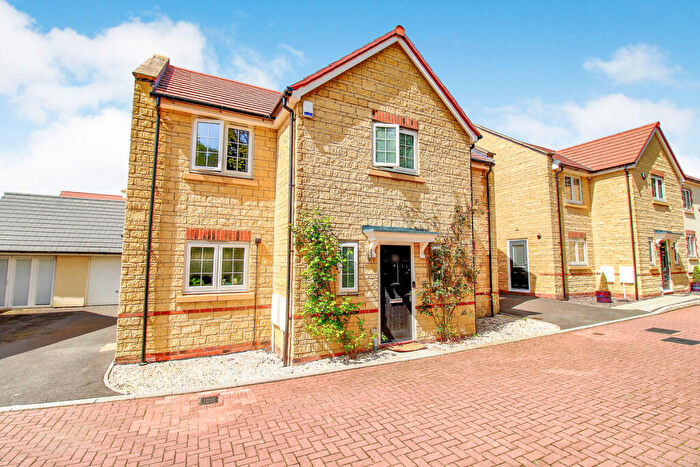
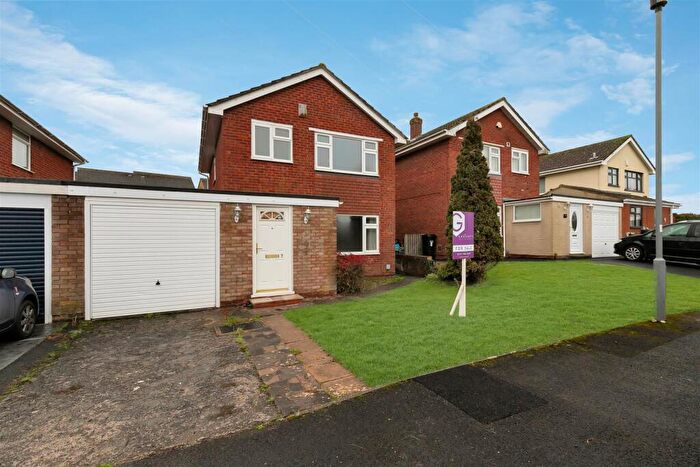
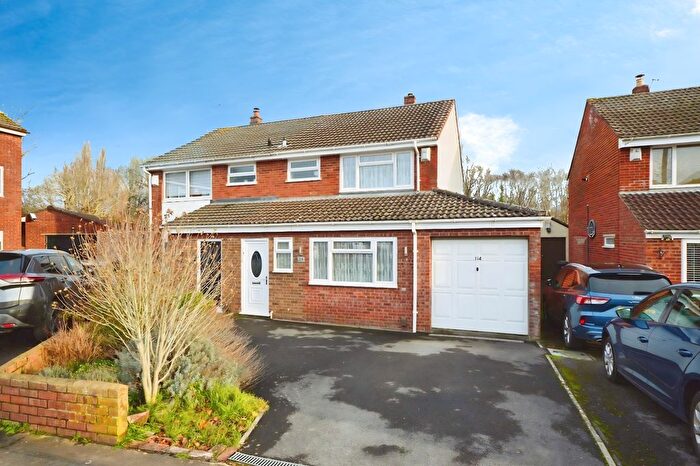
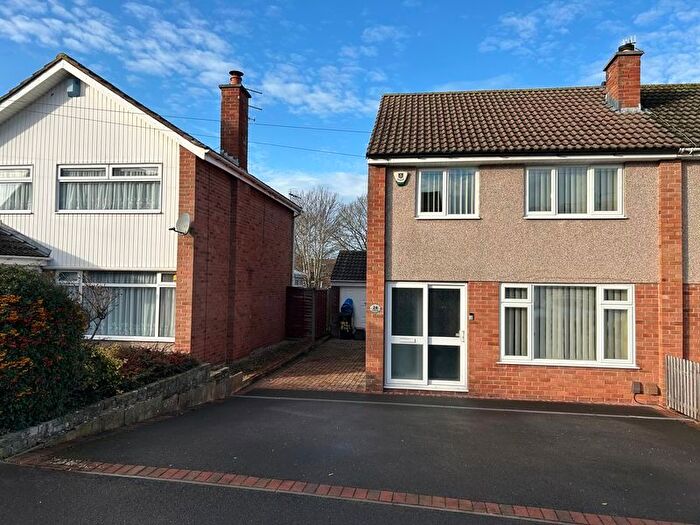
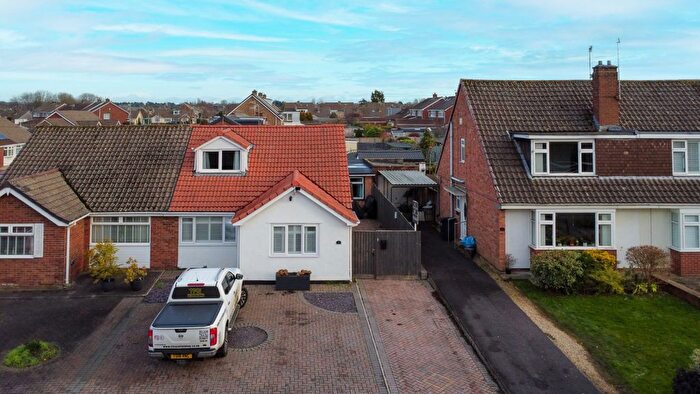
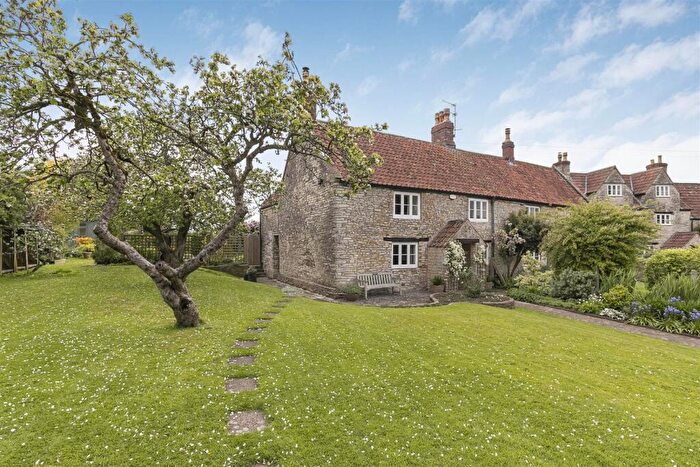
Houses for sale & to rent in Publow And Whitchurch, Bristol
House Prices in Publow And Whitchurch
Properties in Publow And Whitchurch have an average house price of £467,048.00 and had 85 Property Transactions within the last 3 years¹.
Publow And Whitchurch is an area in Bristol, Bath and North East Somerset with 856 households², where the most expensive property was sold for £1,800,000.00.
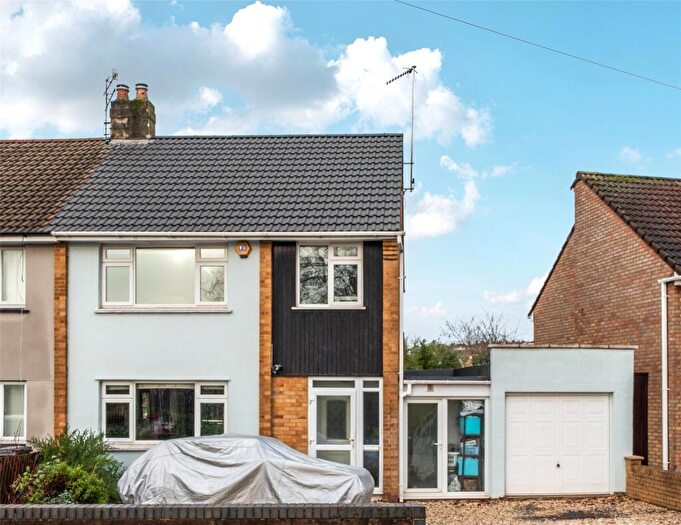
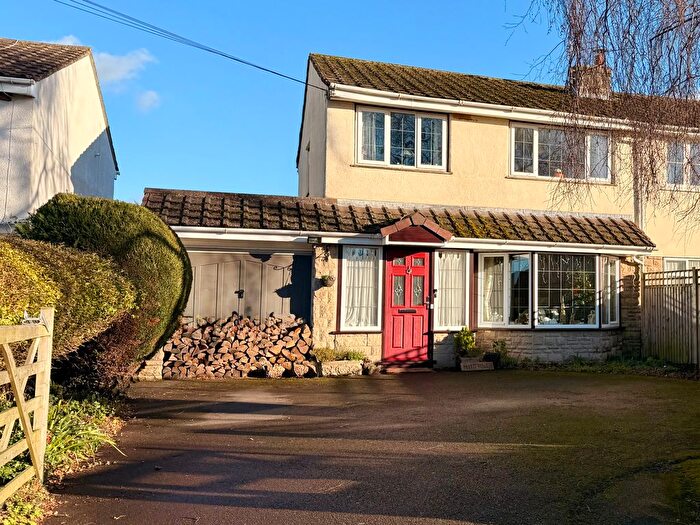
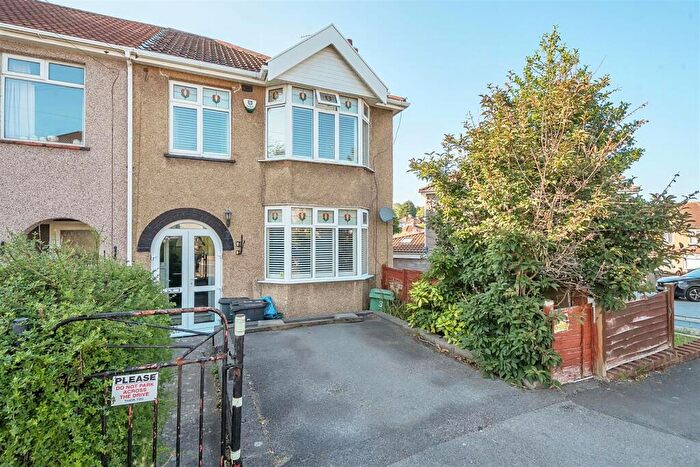
Properties for sale in Publow And Whitchurch
Roads and Postcodes in Publow And Whitchurch
Navigate through our locations to find the location of your next house in Publow And Whitchurch, Bristol for sale or to rent.
| Streets | Postcodes |
|---|---|
| Belluton | BS39 4JJ |
| Belluton Villas | BS39 4JG |
| Blackrock Lane | BS39 4HZ BS39 4JA |
| Bridge Close | BS14 0TS |
| Bristol Road | BS14 0PF BS14 0PQ BS14 0PT BS14 0PU BS14 0PX BS14 0PY BS14 0QW BS39 4JQ |
| Church Meadows | BS14 0BS |
| Church Road | BS14 0EZ BS14 0PN BS14 0PP BS14 0PR |
| Church Street | BS39 4AH BS39 4AJ BS39 4AQ |
| Churchways | BS14 0PL |
| Culvery Lane | BS39 4AG |
| Dene Road | BS14 0PG |
| Halt End | BS14 0TR |
| High Street | BS39 4BH BS39 4BQ BS39 4HN |
| Hillcrest | BS39 4AS BS39 4AT BS39 4AU BS39 4AX BS39 4BD BS39 4BE |
| Hillside Cottages | BS39 4AB |
| Hillside Villas | BS39 4AD |
| Hursley Hill | BS14 0QZ |
| Knights Cottages | BS39 4AN |
| Lines Way | BS14 0TT |
| Maggs Lane | BS14 0PH |
| Mill Lane | BS39 4HX |
| Millstream Cottages | BS39 4AL |
| Norton Lane | BS14 0BT |
| Old Road | BS39 4BB BS39 4ND |
| Oldbridge Road | BS14 0TP |
| Parsonage Lane | BS39 4JD |
| Peats Hill | BS39 4HR |
| Pensford Hill | BS39 4AA BS39 4AF BS39 4JF |
| Police Lane | BS39 4BP |
| Priestdown | BS39 4HS |
| Publow Lane | BS39 4HP BS39 4HW BS39 4HY |
| Queen Charlton Lane | BS14 0QP |
| Ringspit Lane | BS14 0QX |
| Salters Brook | BS39 4AP |
| Saltwell Avenue | BS14 0PE |
| Sleep Lane | BS14 0QN |
| St Nicholas Road | BS14 0PJ |
| Station Approach | BS39 4AE |
| Staunton Fields | BS14 0QD |
| Staunton Lane | BS14 0QF BS14 0QG BS14 0QL BS14 0QQ |
| Staunton Way | BS14 0TU |
| The Orchard | BS39 4BG |
| The Witheys | BS14 0QB |
| Wells Road | BS39 4NA |
| Whitley Batts | BS39 4NE |
| Wick Lane | BS39 4AW |
| Woollard Lane | BS14 0QR BS14 0QS BS14 0QT BS39 4HT |
| BS39 4NQ |
Transport near Publow And Whitchurch
-
Keynsham Station
-
Parson Street Station
-
Bedminster Station
-
Bristol Temple Meads Station
-
Lawrence Hill Station
- FAQ
- Price Paid By Year
- Property Type Price
Frequently asked questions about Publow And Whitchurch
What is the average price for a property for sale in Publow And Whitchurch?
The average price for a property for sale in Publow And Whitchurch is £467,048. This amount is 12% higher than the average price in Bristol. There are 2,681 property listings for sale in Publow And Whitchurch.
What streets have the most expensive properties for sale in Publow And Whitchurch?
The streets with the most expensive properties for sale in Publow And Whitchurch are Old Road at an average of £1,257,500, Blackrock Lane at an average of £1,200,000 and Priestdown at an average of £831,500.
What streets have the most affordable properties for sale in Publow And Whitchurch?
The streets with the most affordable properties for sale in Publow And Whitchurch are Maggs Lane at an average of £280,000, Knights Cottages at an average of £284,999 and Church Street at an average of £305,000.
Which train stations are available in or near Publow And Whitchurch?
Some of the train stations available in or near Publow And Whitchurch are Keynsham, Parson Street and Bedminster.
Property Price Paid in Publow And Whitchurch by Year
The average sold property price by year was:
| Year | Average Sold Price | Price Change |
Sold Properties
|
|---|---|---|---|
| 2025 | £473,562 | -3% |
16 Properties |
| 2024 | £489,093 | -0,2% |
26 Properties |
| 2023 | £490,231 | 13% |
16 Properties |
| 2022 | £428,222 | 4% |
27 Properties |
| 2021 | £412,017 | 2% |
40 Properties |
| 2020 | £405,146 | 7% |
31 Properties |
| 2019 | £378,794 | 0,1% |
29 Properties |
| 2018 | £378,570 | 6% |
24 Properties |
| 2017 | £353,964 | 6% |
22 Properties |
| 2016 | £333,434 | -2% |
42 Properties |
| 2015 | £341,680 | 2% |
41 Properties |
| 2014 | £334,462 | 9% |
30 Properties |
| 2013 | £303,749 | -9% |
25 Properties |
| 2012 | £331,266 | 15% |
15 Properties |
| 2011 | £281,969 | -3% |
24 Properties |
| 2010 | £290,555 | 0,4% |
18 Properties |
| 2009 | £289,496 | -0,5% |
15 Properties |
| 2008 | £290,863 | 6% |
15 Properties |
| 2007 | £272,327 | -10% |
36 Properties |
| 2006 | £298,435 | 12% |
45 Properties |
| 2005 | £262,527 | 11% |
31 Properties |
| 2004 | £233,496 | 1% |
31 Properties |
| 2003 | £232,130 | 22% |
45 Properties |
| 2002 | £180,925 | 10% |
43 Properties |
| 2001 | £162,895 | 25% |
35 Properties |
| 2000 | £121,653 | -8% |
31 Properties |
| 1999 | £131,964 | 16% |
30 Properties |
| 1998 | £110,935 | 23% |
24 Properties |
| 1997 | £85,399 | -7% |
41 Properties |
| 1996 | £91,638 | 3% |
50 Properties |
| 1995 | £88,889 | - |
24 Properties |
Property Price per Property Type in Publow And Whitchurch
Here you can find historic sold price data in order to help with your property search.
The average Property Paid Price for specific property types in the last three years are:
| Property Type | Average Sold Price | Sold Properties |
|---|---|---|
| Semi Detached House | £377,531.00 | 30 Semi Detached Houses |
| Detached House | £624,133.00 | 35 Detached Houses |
| Terraced House | £359,733.00 | 15 Terraced Houses |
| Flat | £226,499.00 | 5 Flats |

