Houses for sale & to rent in Blendon And Penhill, Bexley
House Prices in Blendon And Penhill
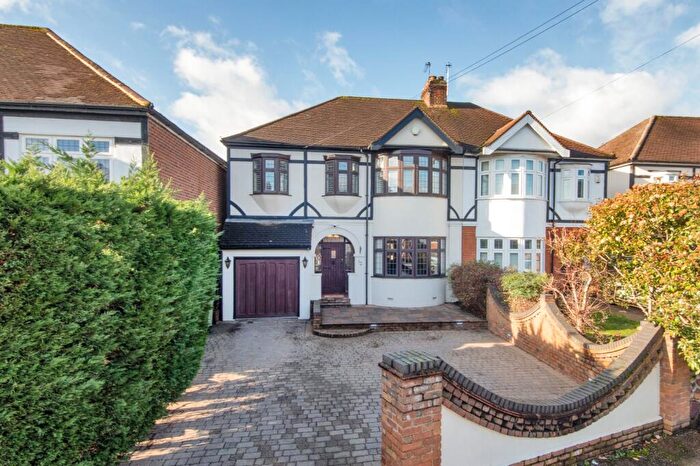
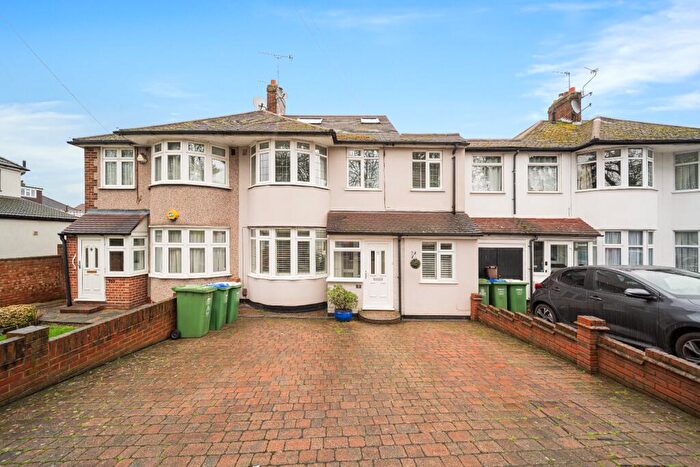
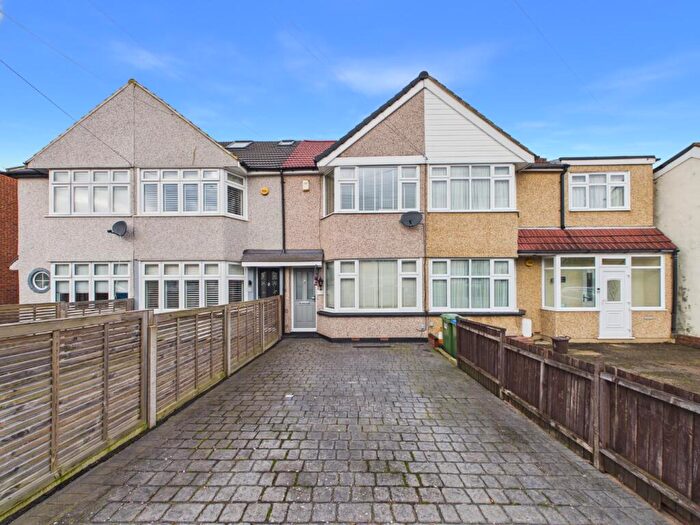
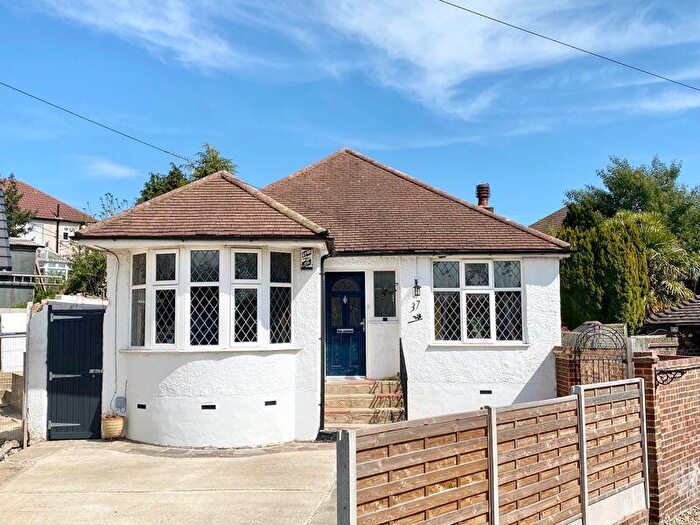
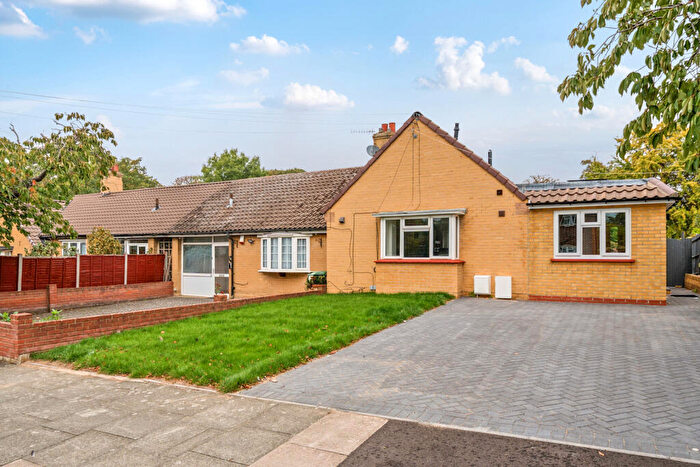
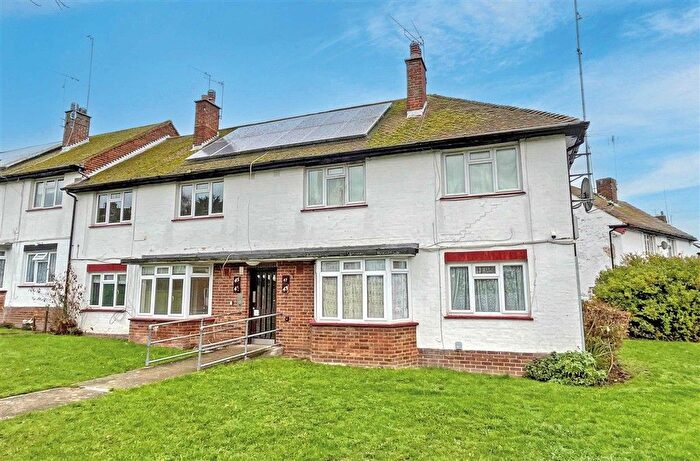
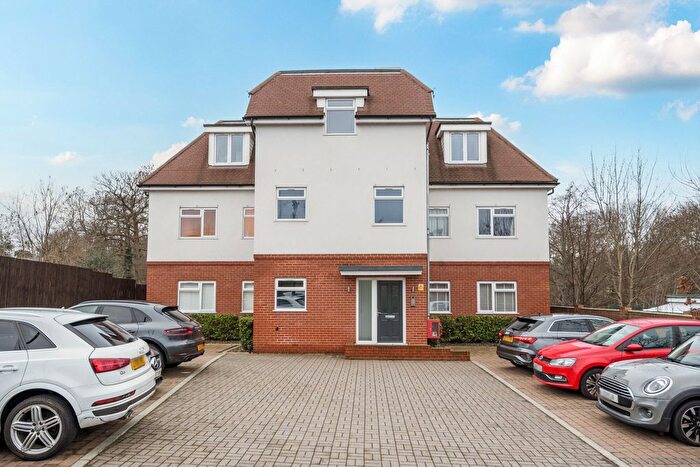
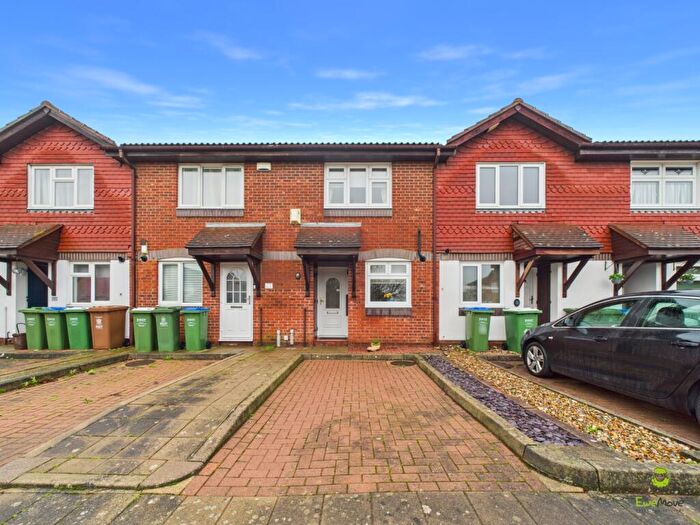
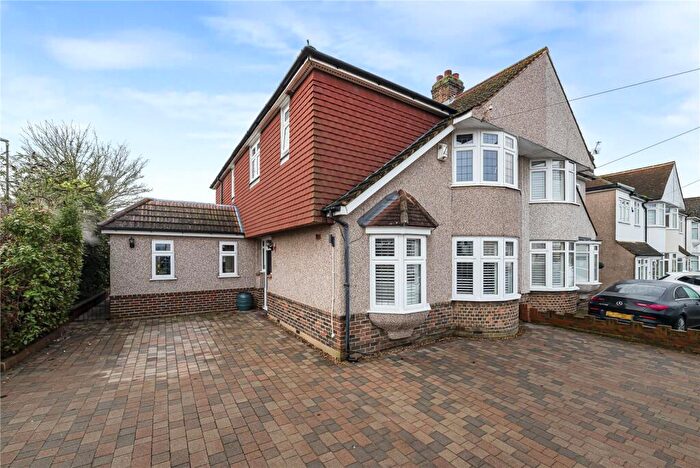
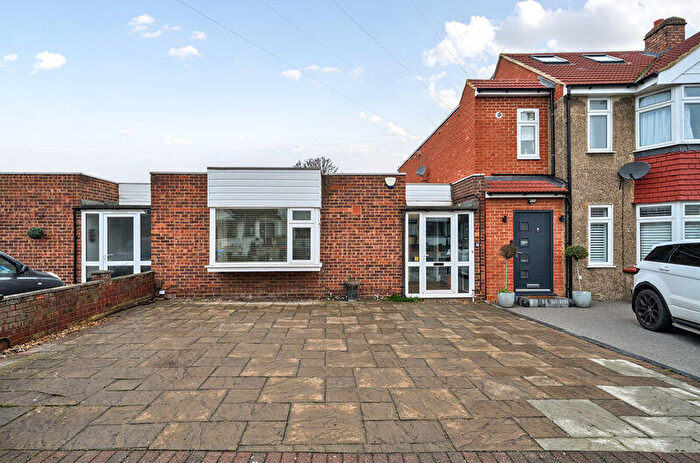
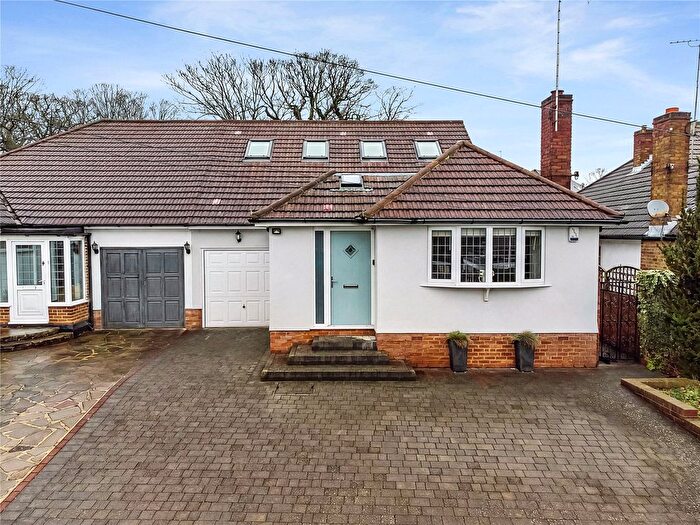
Properties in this part of Blendon And Penhill within Bexley have an average house price of £550,216.00 and had 148 Property Transactions within the last 3 years¹. This area has 1,690 households² , where the most expensive property was sold for £1,150,000.00.
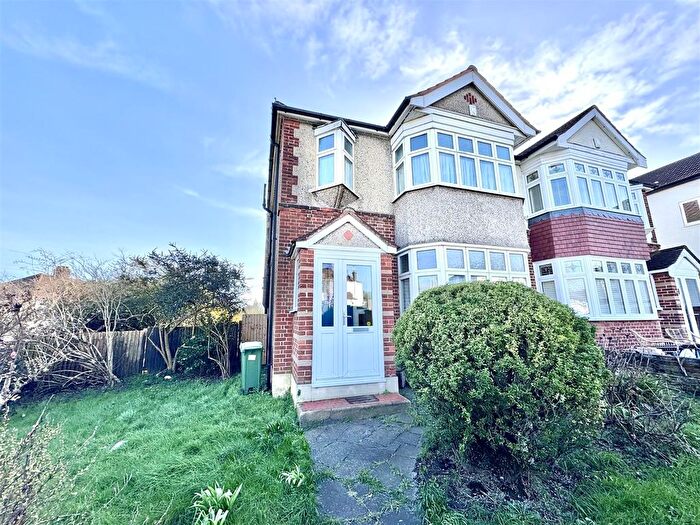
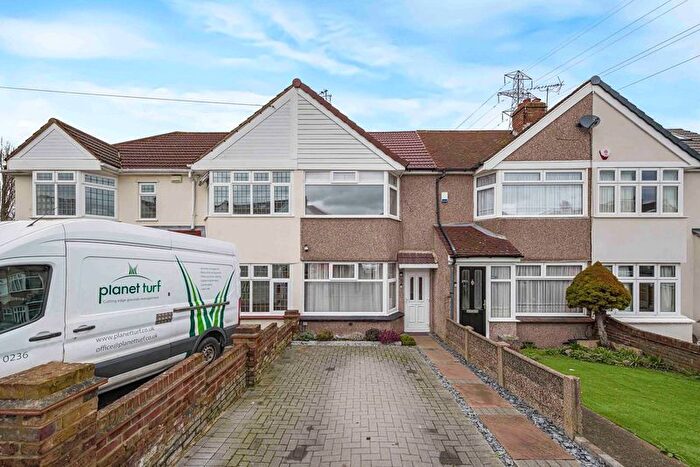
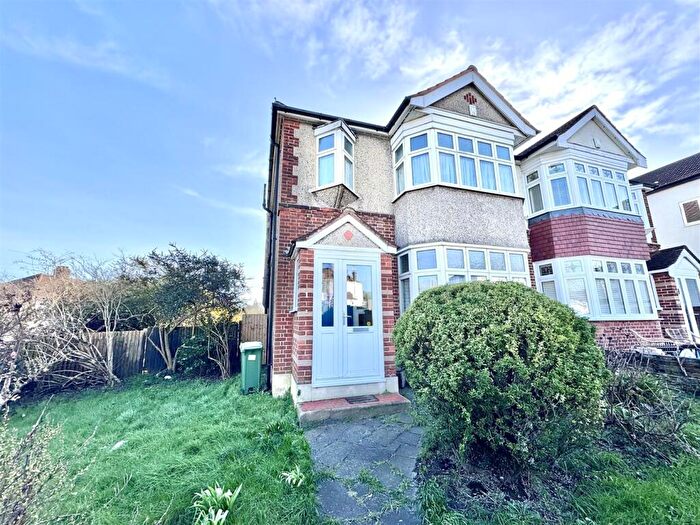
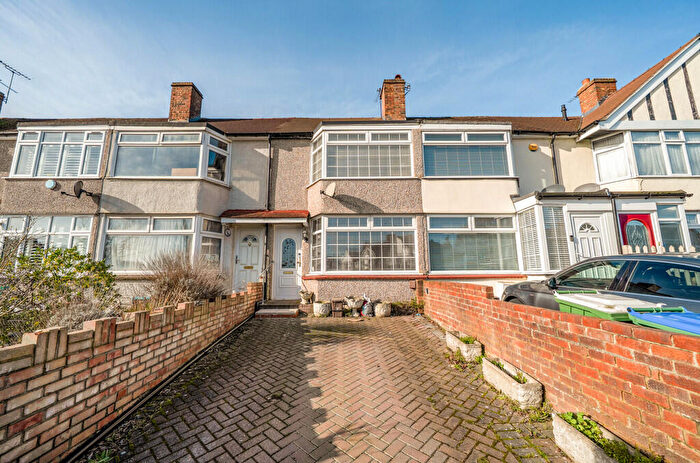
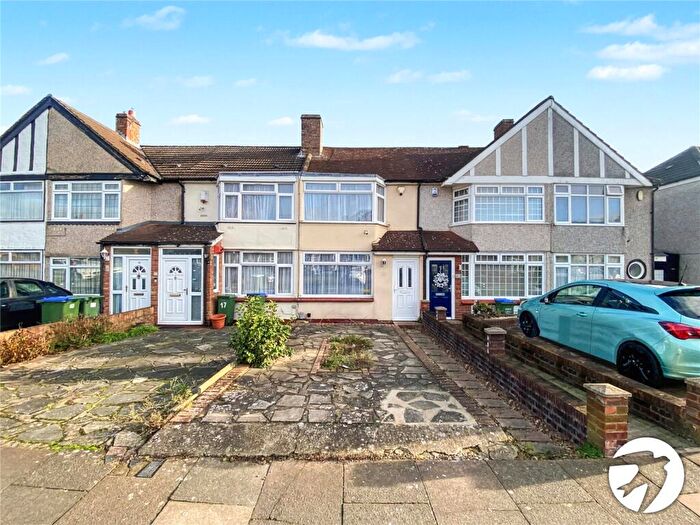
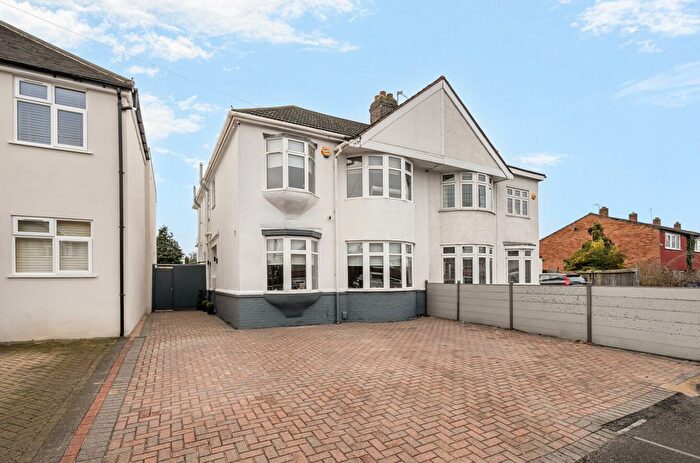
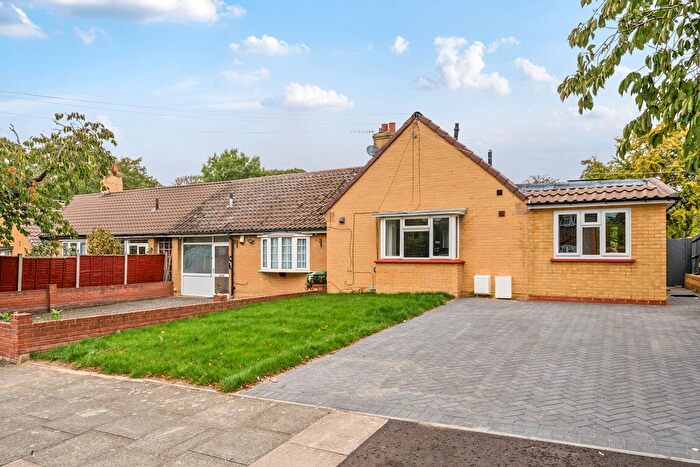
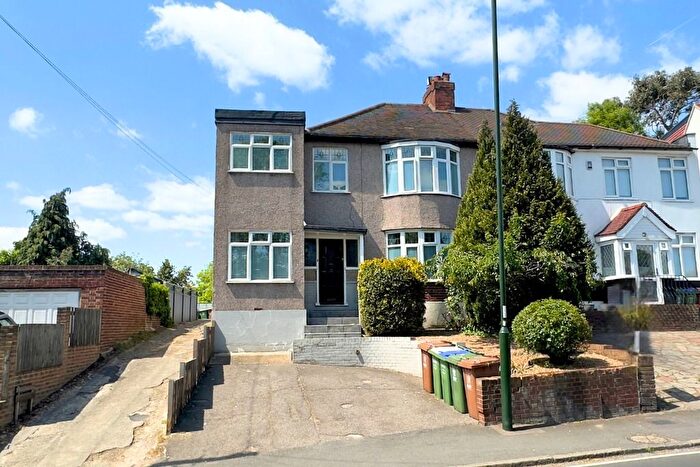
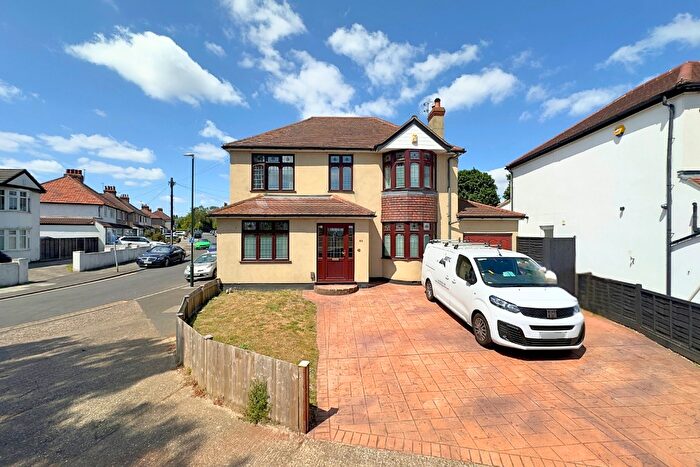
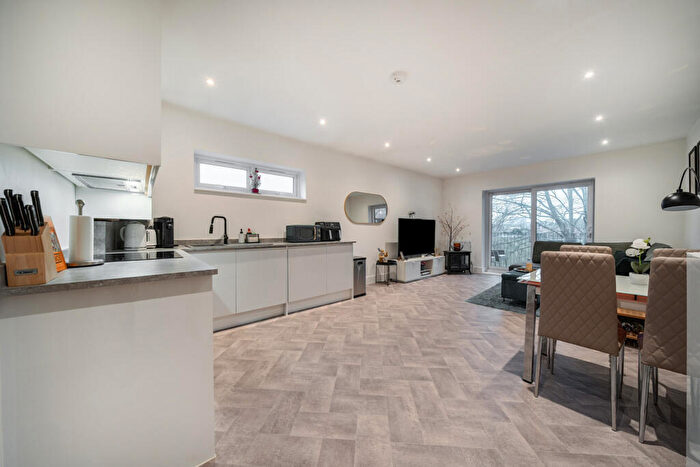
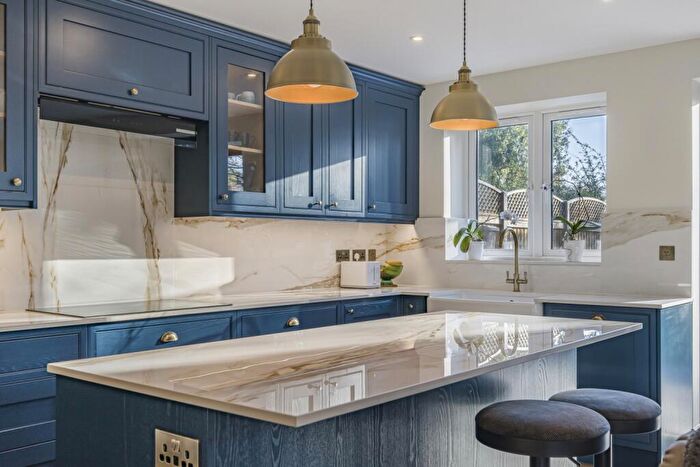
Properties for sale in Blendon And Penhill
Roads and Postcodes in Blendon And Penhill
Navigate through our locations to find the location of your next house in Blendon And Penhill, Bexley for sale or to rent.
| Streets | Postcodes |
|---|---|
| Albany Close | DA5 3ES |
| Albany Road | DA5 3ET |
| Arbuthnot Lane | DA5 1EH DA5 1EJ DA5 1EN DA5 1EQ |
| Arcadian Avenue | DA5 1JN DA5 1JW |
| Arcadian Close | DA5 1JJ |
| Arcadian Road | DA5 3QA |
| Banwell Road | DA5 1EX |
| Basing Drive | DA5 1EP DA5 1ER |
| Baynham Close | DA5 1RN |
| Beechway | DA5 3DG DA5 3DQ |
| Bladindon Drive | DA5 3BN DA5 3BP DA5 3BS DA5 3BT DA5 3BW |
| Blendon Drive | DA5 3AA DA5 3AB |
| Blendon Road | DA5 1BN DA5 1BP DA5 1BS DA5 1BT DA5 1BW DA5 1BX DA5 1BY |
| Bridgen Road | DA5 1JE DA5 1JF DA5 1JQ |
| Brookdale Road | DA5 1RB |
| Cedar Grove | DA5 3DB |
| Charter Drive | DA5 3PX |
| Elmwood Drive | DA5 3PS DA5 3PT |
| Gresham Close | DA5 1EW |
| Hartlands Close | DA5 1RL |
| Kemsing Close | DA5 1JH |
| Meadowview Road | DA5 1HP |
| Oakley Park | DA5 3EF DA5 3EG DA5 3EQ |
| Oakway Close | DA5 1EL |
| Penhill Road | DA5 3EH DA5 3EL DA5 3EN DA5 3EP DA5 3ER DA5 3EU |
| Riverdale Road | DA5 1QX DA5 1QZ DA5 1RD |
| Sherwood Close | DA5 3EB |
| Southview Close | DA5 1EG |
| The Avenue | DA5 3DJ |
| The Crescent | DA5 3DD |
| The Drive | DA5 3BU DA5 3BX DA5 3BY DA5 3BZ DA5 3DE DA5 3DF DA5 3DH |
| The Rise | DA5 3EJ |
| The Sanctuary | DA5 3DL |
| Torbrook Close | DA5 1ES |
| Upton Road South | DA5 1RG DA5 1RQ |
| Venture Close | DA5 3PU |
| Viewfield Road | DA5 3EE |
| Willow Close | DA5 1QY |
| Woodside Lane | DA5 1EY DA5 1JL |
Transport near Blendon And Penhill
-
Albany Park Station
-
Bexley Station
-
Bexleyheath Station
-
Sidcup Station
-
Welling Station
-
Barnehurst Station
-
Crayford Station
-
Falconwood Station
-
New Eltham Station
- FAQ
- Price Paid By Year
- Property Type Price
Frequently asked questions about Blendon And Penhill
What is the average price for a property for sale in Blendon And Penhill?
The average price for a property for sale in Blendon And Penhill is £550,216. This amount is 1% higher than the average price in Bexley. There are 2,111 property listings for sale in Blendon And Penhill.
What streets have the most expensive properties for sale in Blendon And Penhill?
The streets with the most expensive properties for sale in Blendon And Penhill are Blendon Drive at an average of £883,333, The Crescent at an average of £787,500 and Riverdale Road at an average of £691,250.
What streets have the most affordable properties for sale in Blendon And Penhill?
The streets with the most affordable properties for sale in Blendon And Penhill are Gresham Close at an average of £295,000, Woodside Lane at an average of £305,181 and Albany Close at an average of £405,000.
Which train stations are available in or near Blendon And Penhill?
Some of the train stations available in or near Blendon And Penhill are Albany Park, Bexley and Bexleyheath.
Property Price Paid in Blendon And Penhill by Year
The average sold property price by year was:
| Year | Average Sold Price | Price Change |
Sold Properties
|
|---|---|---|---|
| 2025 | £560,088 | 3% |
45 Properties |
| 2024 | £541,709 | -2% |
60 Properties |
| 2023 | £551,755 | -1% |
43 Properties |
| 2022 | £558,335 | 5% |
73 Properties |
| 2021 | £530,808 | -3% |
85 Properties |
| 2020 | £546,395 | 4% |
60 Properties |
| 2019 | £522,041 | 6% |
72 Properties |
| 2018 | £490,254 | 1% |
55 Properties |
| 2017 | £484,457 | 9% |
59 Properties |
| 2016 | £443,040 | 5% |
61 Properties |
| 2015 | £420,461 | 14% |
71 Properties |
| 2014 | £361,042 | 13% |
70 Properties |
| 2013 | £313,923 | 4% |
68 Properties |
| 2012 | £302,676 | 1% |
53 Properties |
| 2011 | £298,676 | -5% |
58 Properties |
| 2010 | £312,596 | 14% |
36 Properties |
| 2009 | £270,044 | -8% |
44 Properties |
| 2008 | £291,382 | 2% |
41 Properties |
| 2007 | £285,609 | 6% |
75 Properties |
| 2006 | £267,759 | - |
85 Properties |
| 2005 | £267,732 | 1% |
59 Properties |
| 2004 | £264,230 | 13% |
79 Properties |
| 2003 | £230,133 | 7% |
71 Properties |
| 2002 | £215,164 | 17% |
84 Properties |
| 2001 | £178,001 | 17% |
91 Properties |
| 2000 | £147,392 | 5% |
68 Properties |
| 1999 | £140,662 | 10% |
74 Properties |
| 1998 | £126,218 | 16% |
77 Properties |
| 1997 | £105,822 | 10% |
91 Properties |
| 1996 | £95,086 | 6% |
65 Properties |
| 1995 | £88,974 | - |
59 Properties |
Property Price per Property Type in Blendon And Penhill
Here you can find historic sold price data in order to help with your property search.
The average Property Paid Price for specific property types in the last three years are:
| Property Type | Average Sold Price | Sold Properties |
|---|---|---|
| Semi Detached House | £576,333.00 | 93 Semi Detached Houses |
| Detached House | £688,777.00 | 18 Detached Houses |
| Terraced House | £533,900.00 | 20 Terraced Houses |
| Flat | £279,823.00 | 17 Flats |

