
Houses for sale & to rent in Barnehurst, Dartford
House Prices in Barnehurst
Properties in this part of Barnehurst within Dartford have an average house price of £308k and had 11 Property Transactions within the last 3 years¹. This area has 146 households² , where the most expensive property was sold for £475k.
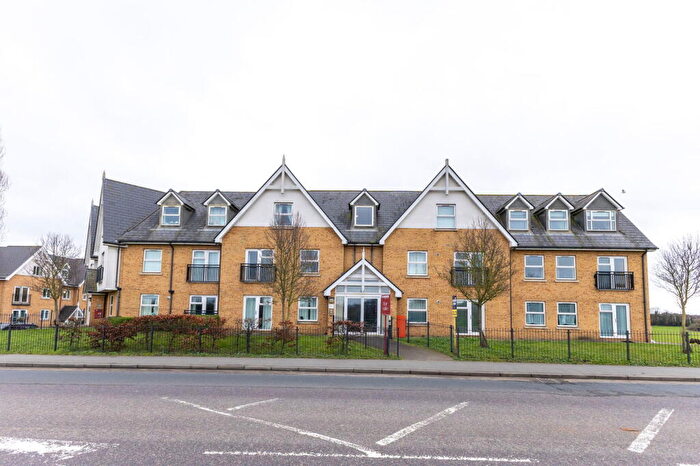
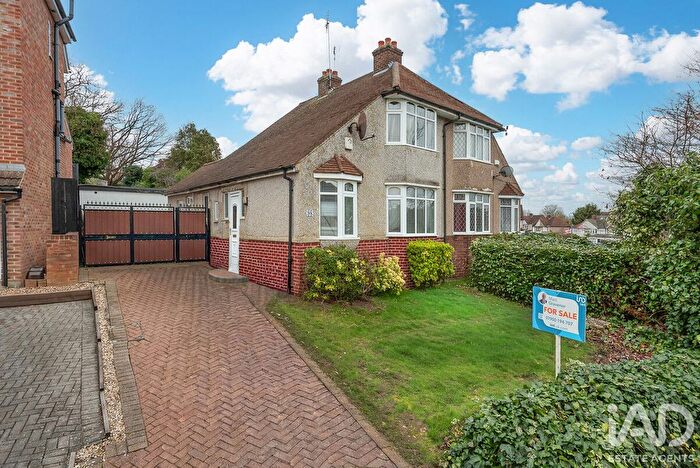
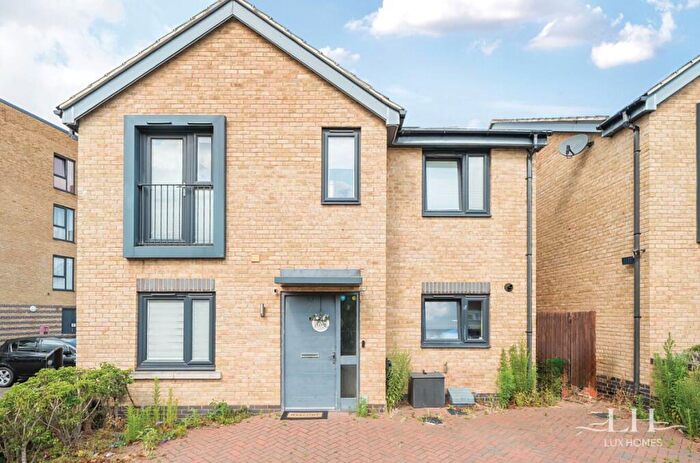
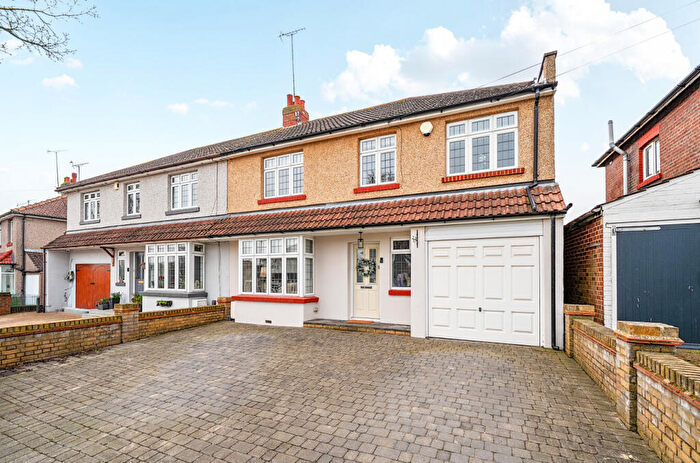
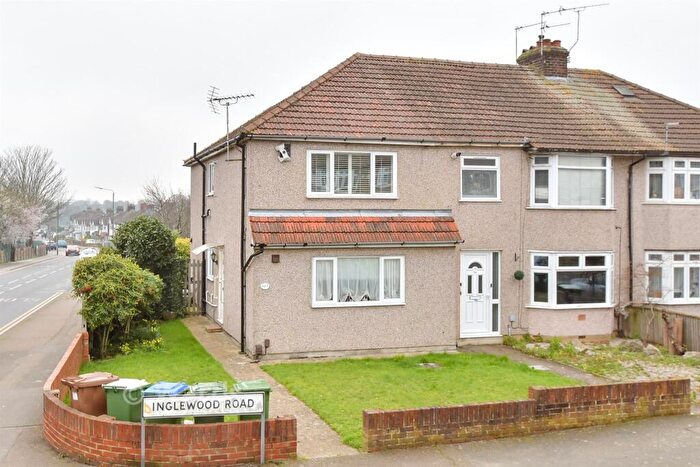
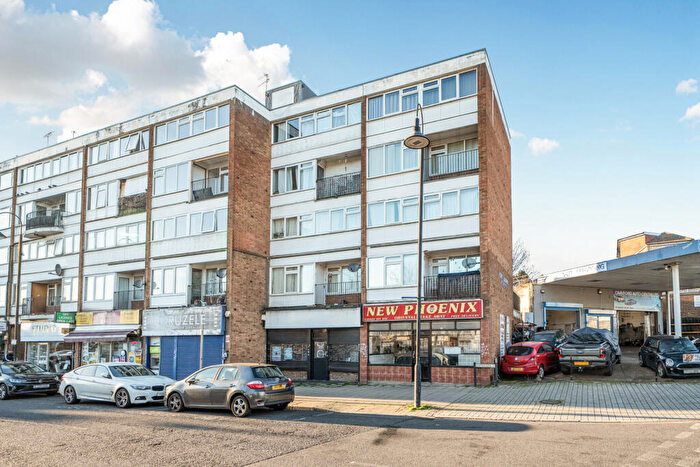
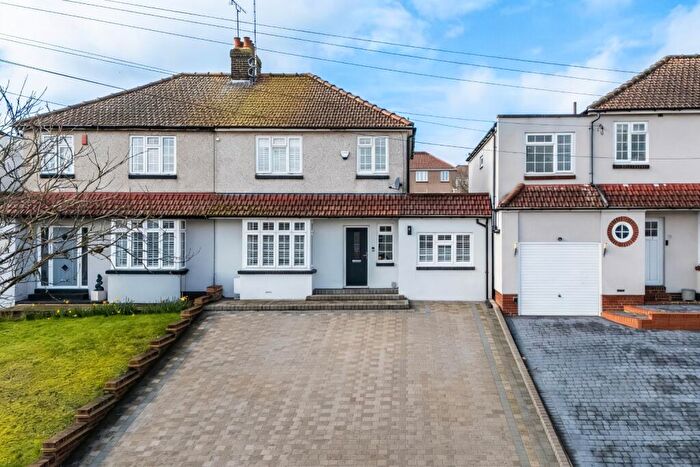
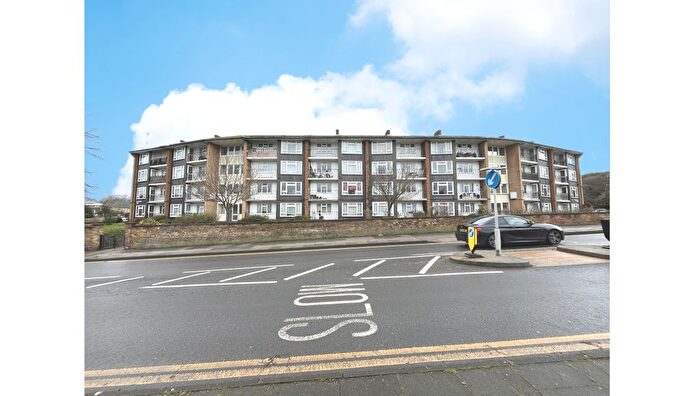
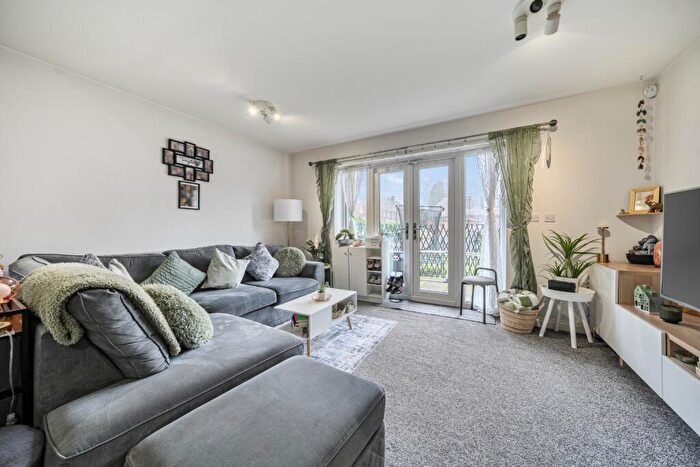
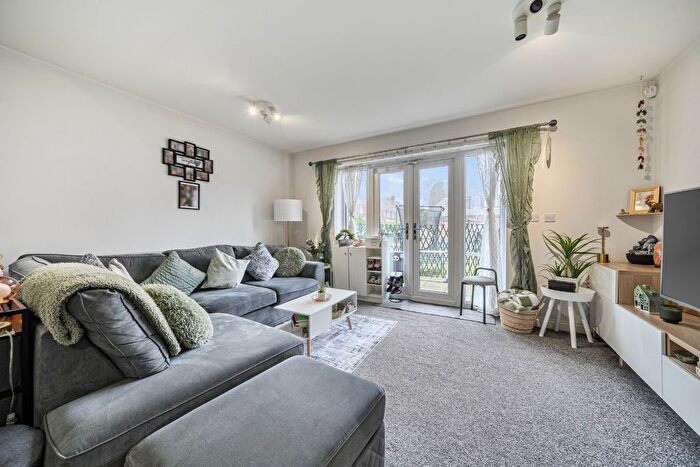
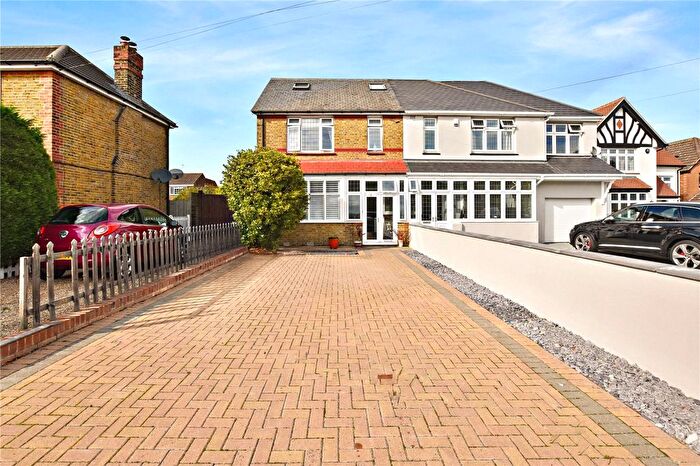
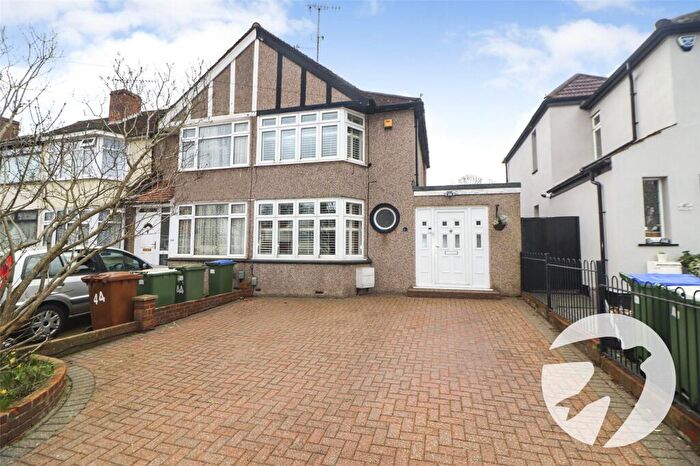
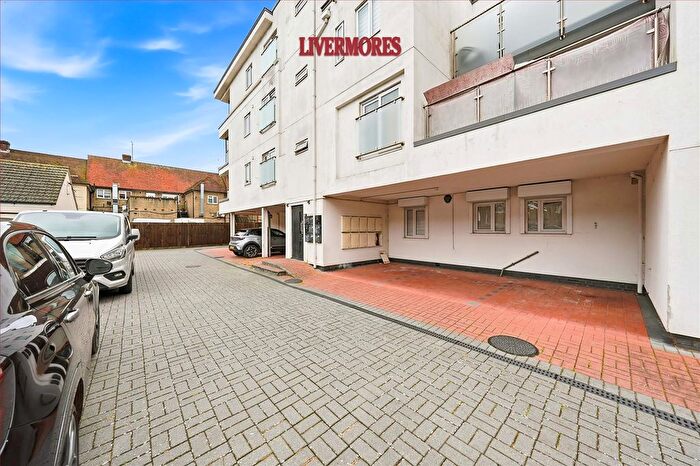
Properties for sale in Barnehurst
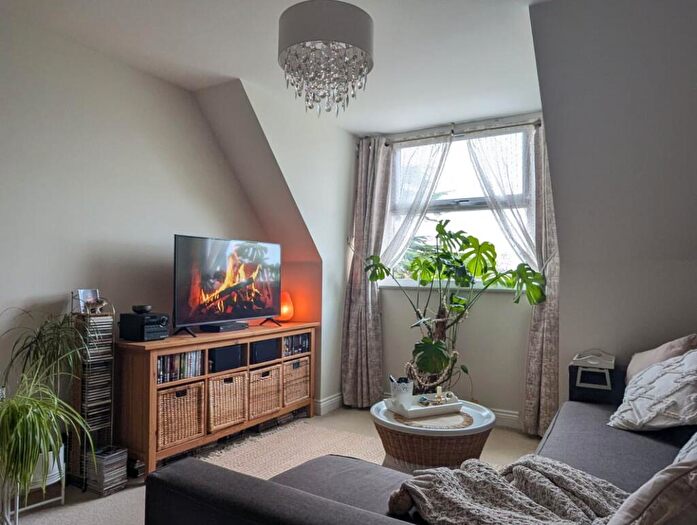
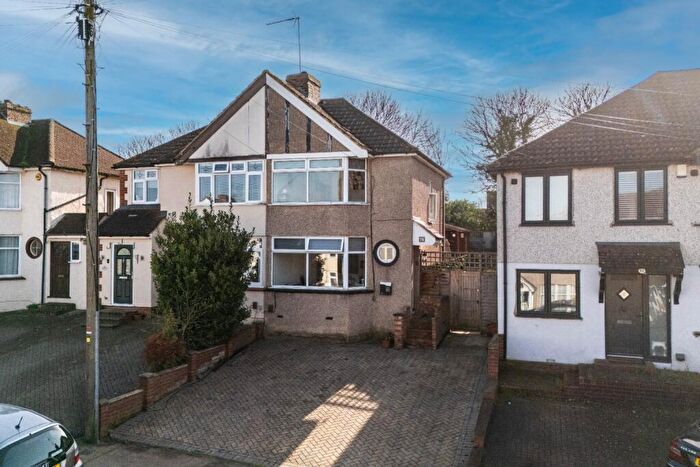
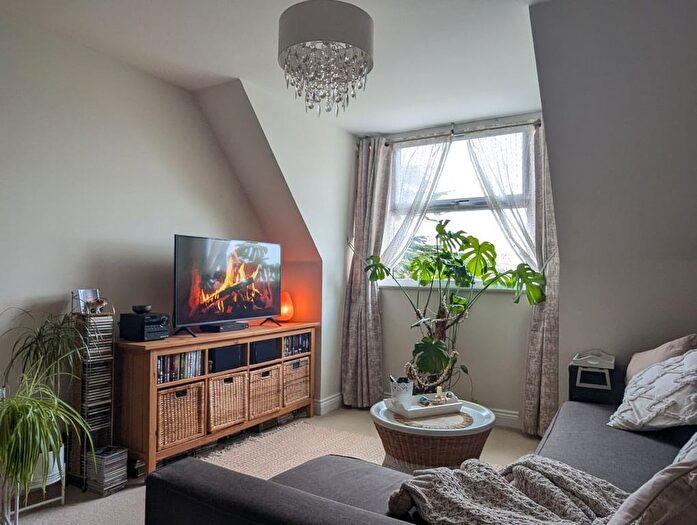
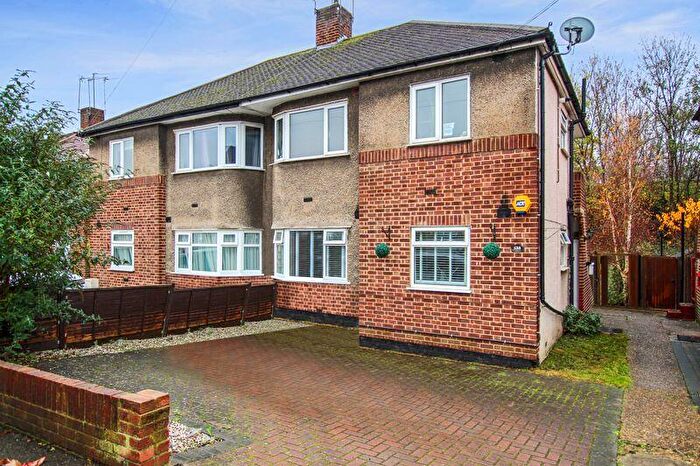
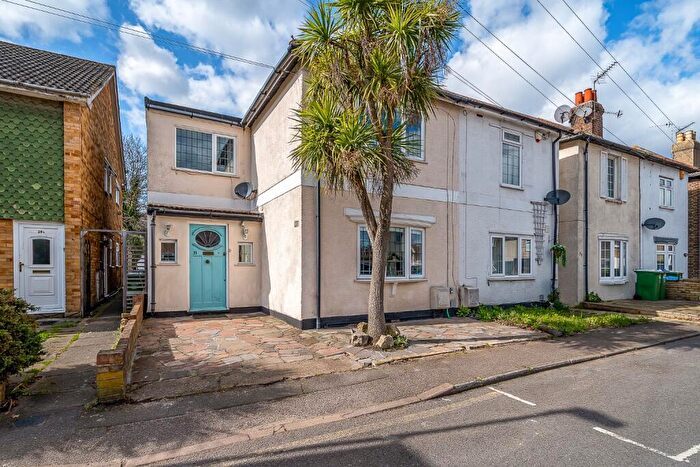
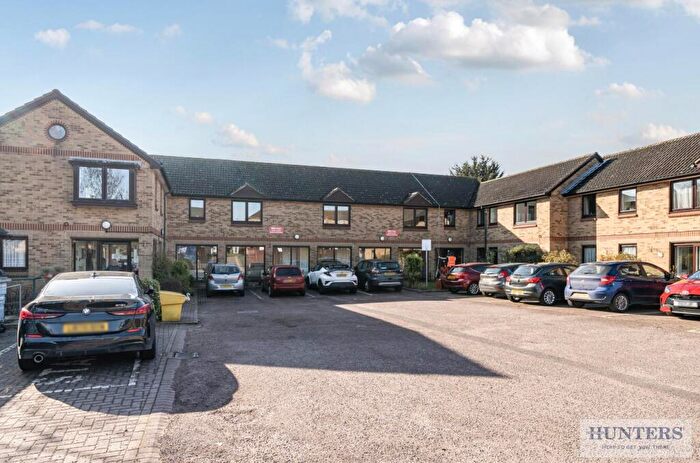
![]()
If you are looking to sell your house, let it out, or receive a property valuation, an expert can help you.
Click the button below to get started.


Roads and Postcodes in Barnehurst
Navigate through our locations to find the location of your next house in Barnehurst, Dartford for sale or to rent.
| Streets | Postcodes |
|---|---|
| Lea Vale | DA1 4DL |
| Old Road | DA1 4DN DA1 4DR DA1 4DW |
| Parkside Parade | DA1 4RA |
| The Marlowes | DA1 4DT |
Transport near Barnehurst
-
 Crayford Station
 -
Barnehurst Station
-
Slade Green Station
-
Bexley Station
-
Bexleyheath Station
-
Erith Station
-
Dartford Station
-
Albany Park Station
-
Belvedere Station
- FAQ
- Price Paid By Year
- Property Type Price
Frequently asked questions about Barnehurst
What is the average price for a property for sale in Barnehurst?
The average price for a property for sale in Barnehurst is £307,954. This amount is 11% lower than the average price in Dartford. There are 1,456 property listings for sale in Barnehurst.
What streets have the most expensive properties for sale in Barnehurst?
The street with the most expensive properties for sale in Barnehurst is Old Road at an average of £426,250.
What streets have the most affordable properties for sale in Barnehurst?
The street with the most affordable properties for sale in Barnehurst is Lea Vale at an average of £240,357.
Which train stations are available in or near Barnehurst?
Some of the train stations available in or near Barnehurst are Crayford, Barnehurst and Slade Green.
Property Price Paid in Barnehurst by Year
The average sold property price by year was:
| Year | Average Sold Price | Price Change |
Sold Properties
|
|---|---|---|---|
| 2025 | £455,000 | 38% |
1 Property |
| 2024 | £283,750 | -8% |
6 Properties |
| 2023 | £307,500 | -34% |
4 Properties |
| 2022 | £411,200 | 41% |
5 Properties |
| 2021 | £244,000 | 17% |
2 Properties |
| 2020 | £202,500 | -40% |
5 Properties |
| 2019 | £283,575 | 3% |
8 Properties |
| 2018 | £273,937 | -2% |
8 Properties |
| 2017 | £278,092 | -10% |
6 Properties |
| 2016 | £305,817 | 33% |
11 Properties |
| 2015 | £203,500 | -7% |
9 Properties |
| 2014 | £217,499 | 11% |
10 Properties |
| 2013 | £193,000 | 1% |
5 Properties |
| 2012 | £190,921 | 1% |
7 Properties |
| 2011 | £188,833 | 7% |
3 Properties |
| 2010 | £175,583 | -1% |
6 Properties |
| 2009 | £177,951 | -5% |
4 Properties |
| 2008 | £187,088 | -3% |
6 Properties |
| 2007 | £192,555 | -5% |
9 Properties |
| 2006 | £201,499 | 16% |
5 Properties |
| 2005 | £168,499 | 7% |
5 Properties |
| 2004 | £156,553 | -7% |
9 Properties |
| 2003 | £167,599 | 19% |
10 Properties |
| 2002 | £135,790 | 29% |
13 Properties |
| 2001 | £96,938 | 9% |
9 Properties |
| 2000 | £88,606 | 21% |
13 Properties |
| 1999 | £69,750 | 6% |
4 Properties |
| 1998 | £65,300 | -26% |
5 Properties |
| 1997 | £82,055 | 45% |
9 Properties |
| 1996 | £45,156 | -30% |
8 Properties |
| 1995 | £58,716 | - |
6 Properties |
Property Price per Property Type in Barnehurst
Here you can find historic sold price data in order to help with your property search.
The average Property Paid Price for specific property types in the last three years are:
| Property Type | Average Sold Price | Sold Properties |
|---|---|---|
| Semi Detached House | £362,500.00 | 3 Semi Detached Houses |
| Flat | £240,000.00 | 6 Flats |
| Detached House | £475,000.00 | 1 Detached House |
| Terraced House | £385,000.00 | 1 Terraced House |