
Houses for sale in Bolton, Bolton
House Prices in Bolton
Properties in Bolton have an average house price of £205k and had 10,671 Property Transactions within the last 3 years.¹
Bolton is an area in Bolton with 116,750 households², where the most expensive property was sold for £2.78M.
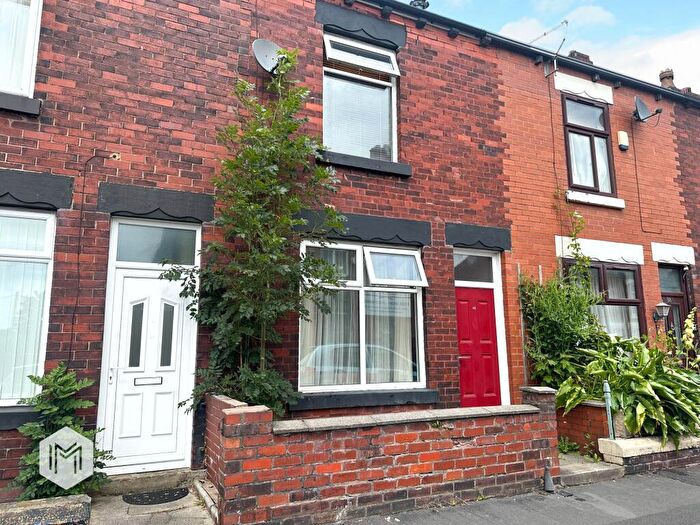
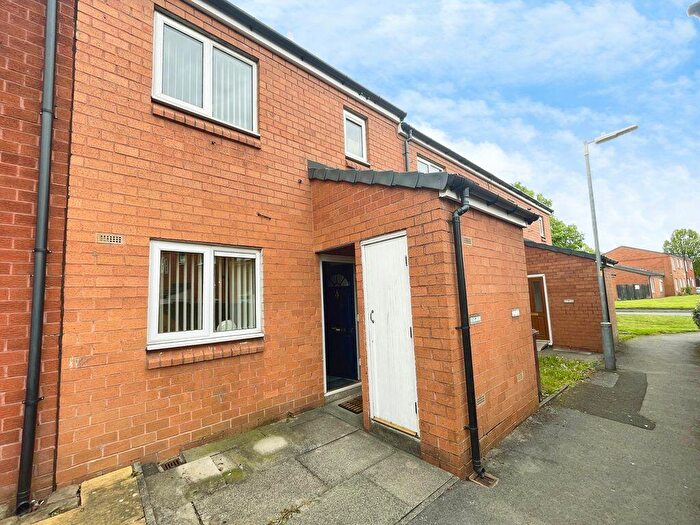
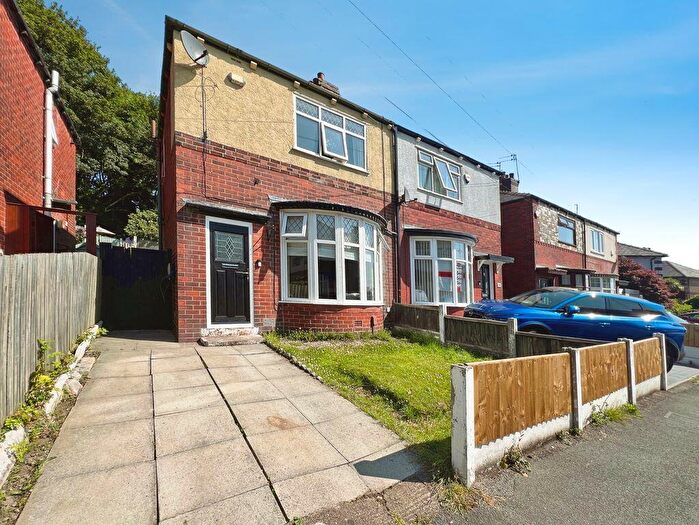
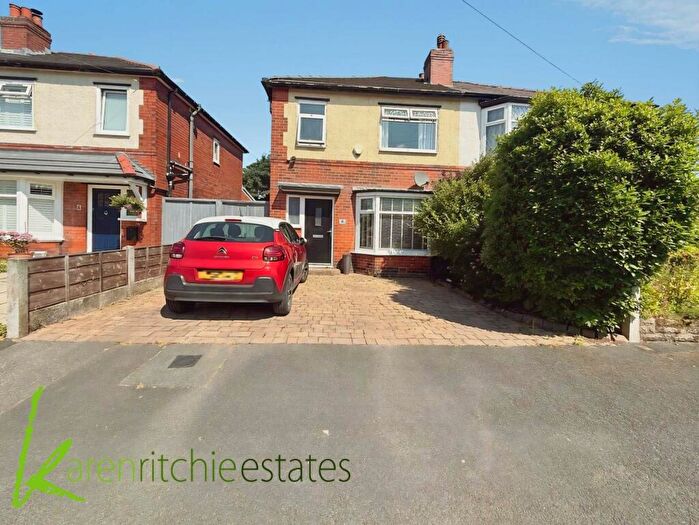
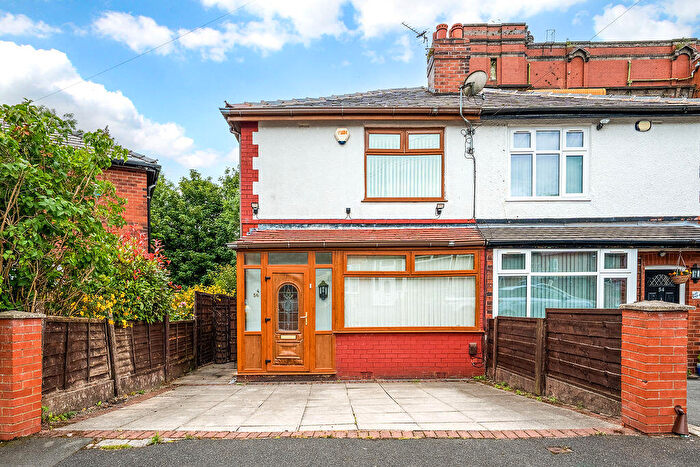
Properties for sale in Bolton
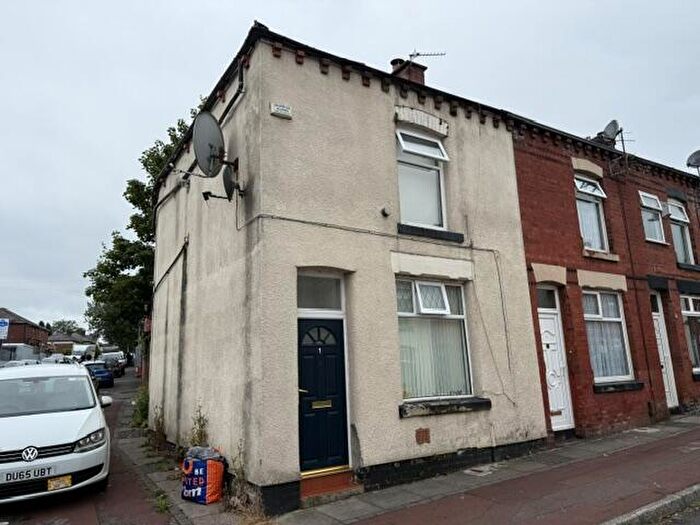
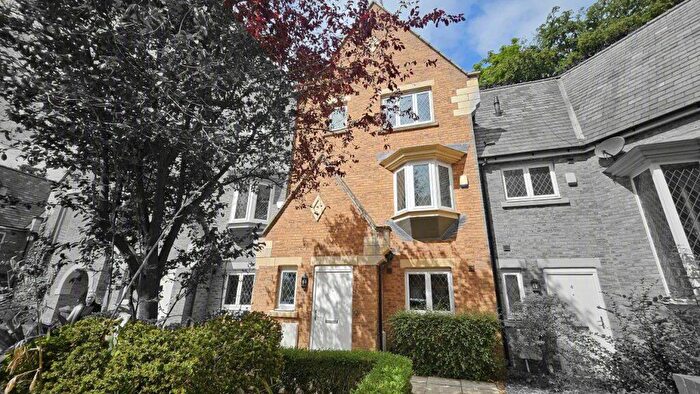
![]()
If you are looking to sell your house, let it out, or receive a property valuation, an expert can help you.
Click the button below to get started.

Neighbourhoods in Bolton
Navigate through our locations to find the location of your next house in Bolton, Bolton for sale or to rent.
- Astley Bridge
- Bradshaw
- Breightmet
- Bromley Cross
- Crompton
- Farnworth
- Great Lever
- Halliwell
- Harper Green
- Heaton And Lostock
- Horwich And Blackrod
- Horwich North East
- Hulton
- Kearsley
- Little Lever And Darcy Lever
- Rumworth
- Smithills
- Tonge With The Haulgh
- Westhoughton North And Chew Moor
- Westhoughton South
- Adlington & Anderton
- Queens Park & Central
- Little Lever & Darcy Lever
- Horwich South & Blackrod
- Farnworth North
- Farnworth South
- Westhoughton North & Hunger Hill
- Heaton, Lostock & Chew Moor
Property price trends in Bolton
According to the latest Land Registry data, the average home in Bolton sold for £218,266 in 2026. That figure comes from a substantial record of 130,719 sales logged over the past 31 years.
Prices have continued to climb over the last three years. Compared with 2023, when the typical sale came in around £191,997, that's a rise of roughly 13.7%.
Looking back five years, average prices are up about 15.8% since 2021, a gain of around £29,790 in cash terms.
Zoom out to the past decade for the fuller picture. Back in 2016, homes here averaged £142,723, so the typical sold price has climbed about 52.9% since then, roughly 4.3% a year. Stretch the view to fifteen years and that annual pace eases back to about 3.7%.
Frequently asked questions about Bolton
What is the average price for a property for sale in Bolton?
The average price for a property for sale in Bolton is £205,403. This amount is 0.51% lower than the average price in Bolton. There are more than 10,000 property listings for sale in Bolton.
What locations have the most expensive properties for sale in Bolton?
The locations with the most expensive properties for sale in Bolton are Heaton And Lostock at an average of £366,544, Bromley Cross at an average of £287,645 and Bradshaw at an average of £282,106.
What locations have the most affordable properties for sale in Bolton?
The locations with the most affordable properties for sale in Bolton are Halliwell at an average of £116,349, Rumworth at an average of £135,641 and Crompton at an average of £142,318.
Which train stations are available in or near Bolton?
Some of the train stations available in or near Bolton are Bolton, Lostock and Hall I' Th' Wood.
Property Price Paid in Bolton by Year
The average sold property price by year was:
| Year | Average Sold Price | Price Change |
Sold Properties
|
|---|---|---|---|
| 2026 | £218,266 | 1% |
219 Properties |
| 2025 | £216,114 | 4% |
3,411 Properties |
| 2024 | £207,213 | 7% |
3,617 Properties |
| 2023 | £191,997 | -2% |
3,424 Properties |
| 2022 | £195,000 | 3% |
4,332 Properties |
| 2021 | £188,476 | 10% |
4,945 Properties |
| 2020 | £168,904 | 7% |
3,878 Properties |
| 2019 | £157,193 | 1% |
4,192 Properties |
| 2018 | £155,005 | 5% |
4,207 Properties |
| 2017 | £147,177 | 3% |
4,384 Properties |
Property Price per Property Type in Bolton
Here you can find historic sold price data in order to help with your property search.
The average Property Paid Price for specific property types in the last three years are:
| Property Type | Average Sold Price | Sold Properties |
|---|---|---|
| Semi Detached House | £217,340.00 | 3,582 Semi Detached Houses |
| Terraced House | £145,546.00 | 4,560 Terraced Houses |
| Detached House | £387,651.00 | 1,663 Detached Houses |
| Flat | £121,231.00 | 866 Flats |
Transport in Bolton
Please see below transportation links in this area:
