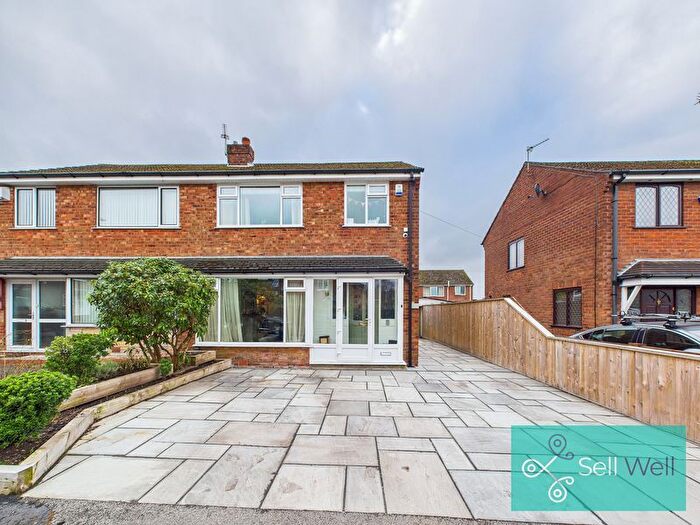
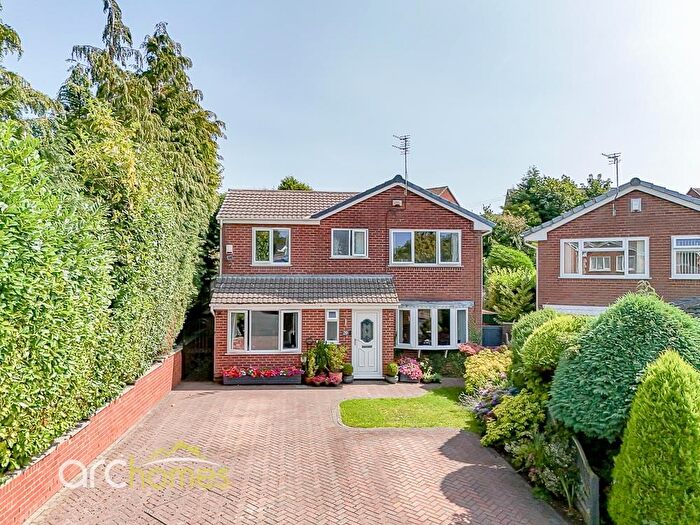
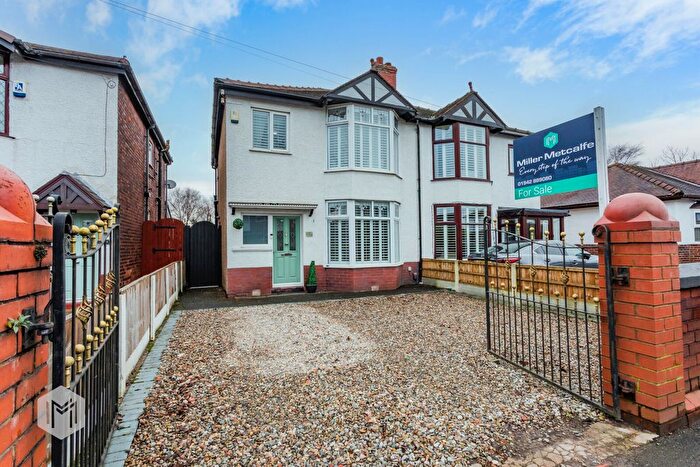
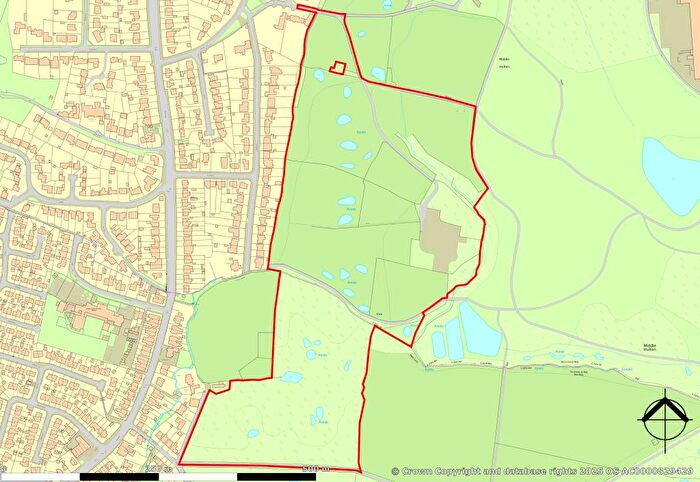
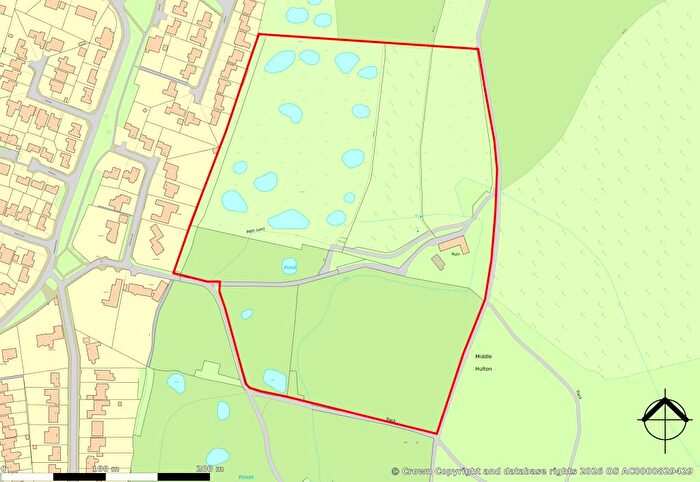
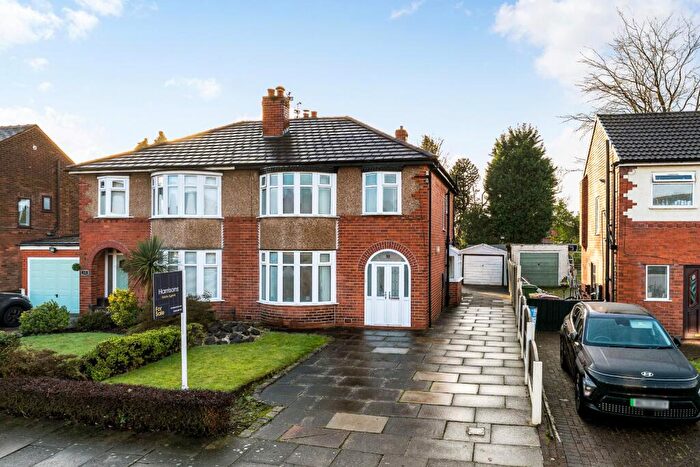
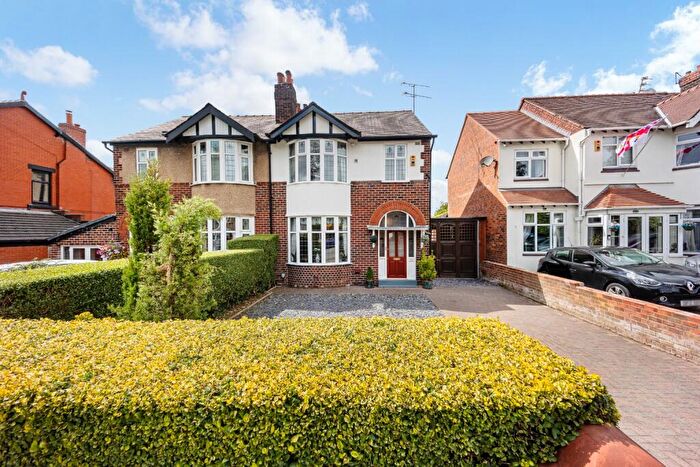
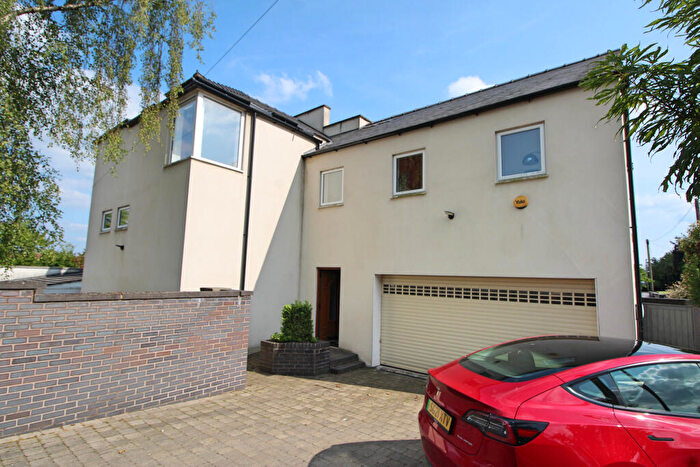
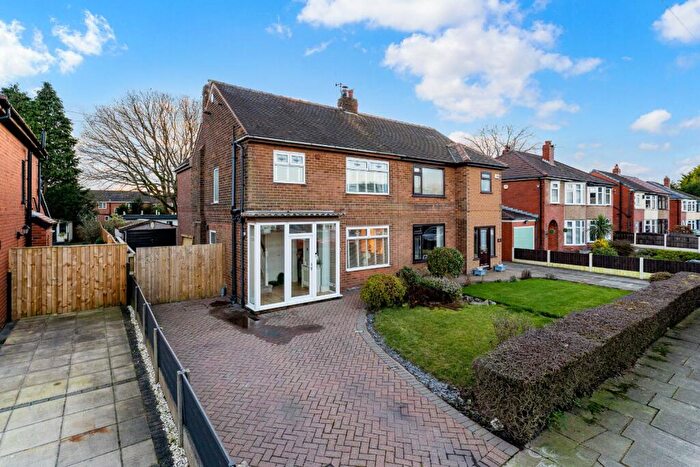
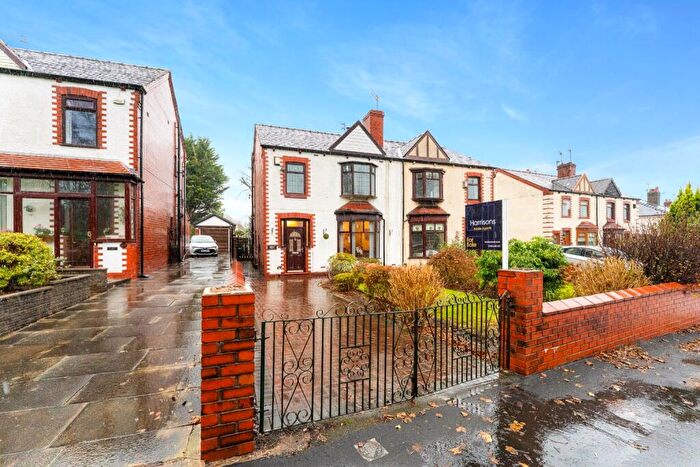
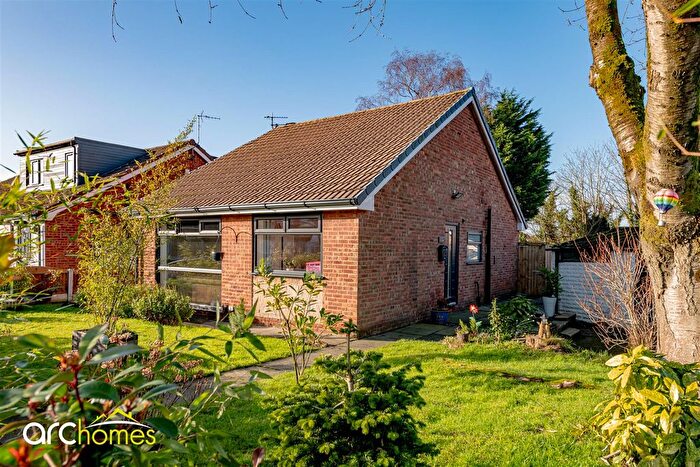
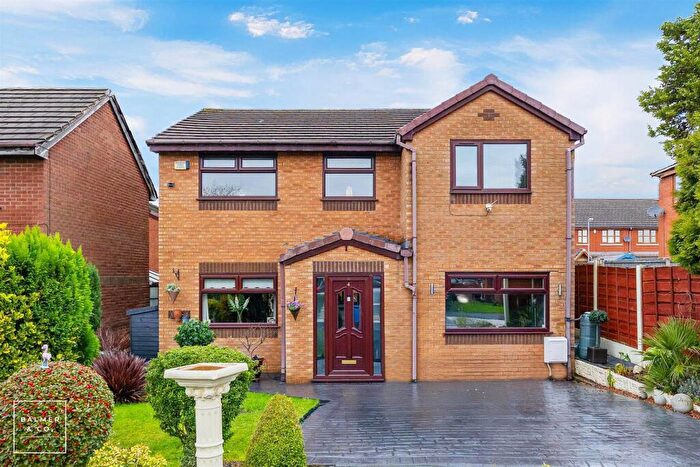
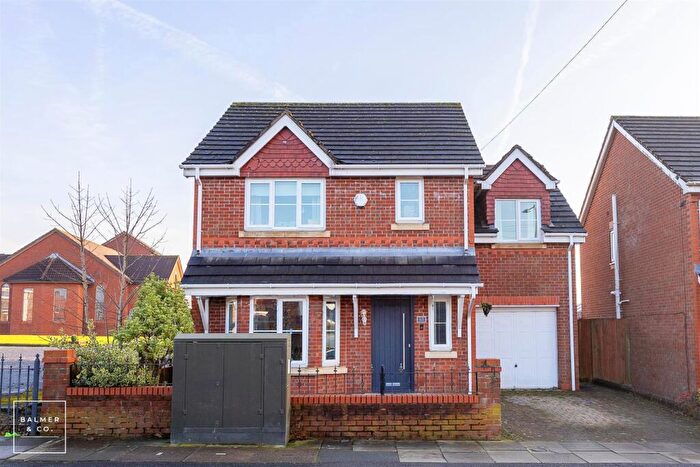
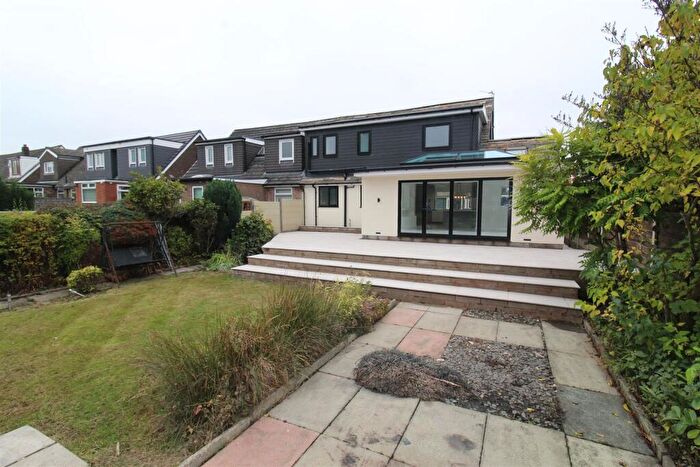
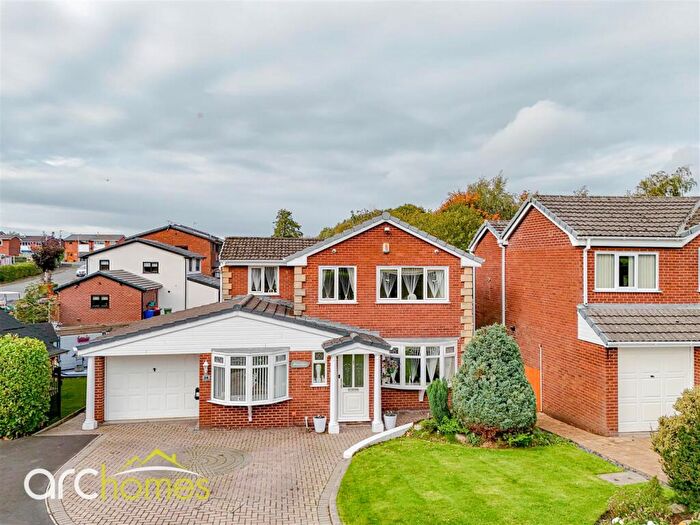
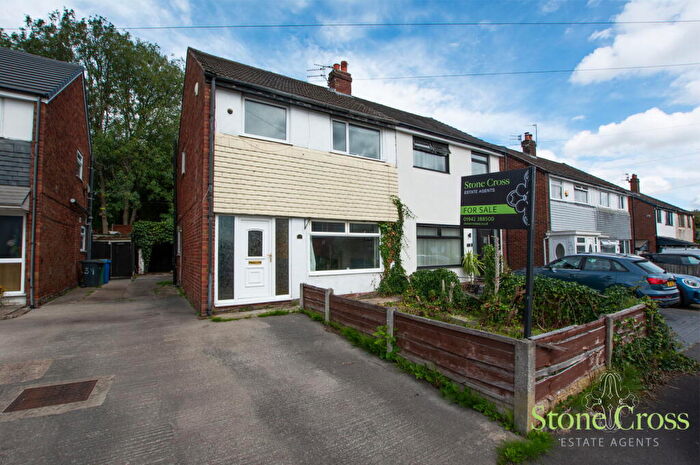
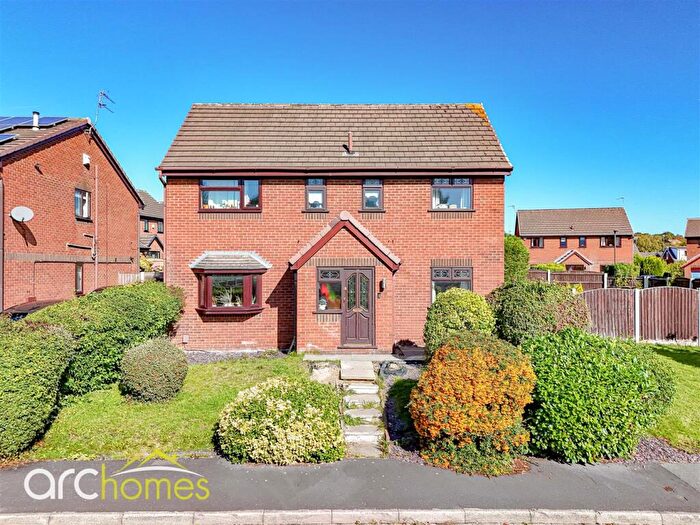
Houses for sale & to rent in Hulton, Manchester
House Prices in Hulton
Properties in Hulton have an average house price of £343,320.00 and had 38 Property Transactions within the last 3 years¹.
Hulton is an area in Manchester, Bolton with 363 households², where the most expensive property was sold for £700,000.00.
Properties for sale in Hulton
Roads and Postcodes in Hulton
Navigate through our locations to find the location of your next house in Hulton, Manchester for sale or to rent.
| Streets | Postcodes |
|---|---|
| Breeze Hill Road | M46 9HJ |
| Broadway | M46 9HW |
| Brookdale | M46 9QW |
| Garthmere Road | M46 9GT |
| High Bank | M46 9HZ |
| Hillcrest | M46 9GY |
| Hilltop | M46 9QN |
| Lansdowne Road | M46 9HL |
| Low Green | M46 9HS |
| Makants Close | M46 9QR |
| Mornington Road | M46 9GS |
| Newbrook Road | M46 9GZ M46 9HA M46 9HB M46 9HD M46 9HF M46 9HN M46 9QP |
| Park Bank | M46 9QQ |
| Rutland Avenue | M46 9JR |
| Shurdington Road | M46 9HY |
| The Close | M46 9GP |
| Wellington Road | M46 9HE |
| Woodlands Drive | M46 9HH |
Transport near Hulton
- FAQ
- Price Paid By Year
- Property Type Price
Frequently asked questions about Hulton
What is the average price for a property for sale in Hulton?
The average price for a property for sale in Hulton is £343,320. This amount is 60% higher than the average price in Manchester. There are 496 property listings for sale in Hulton.
What streets have the most expensive properties for sale in Hulton?
The streets with the most expensive properties for sale in Hulton are Breeze Hill Road at an average of £625,000, High Bank at an average of £507,500 and Rutland Avenue at an average of £435,000.
What streets have the most affordable properties for sale in Hulton?
The streets with the most affordable properties for sale in Hulton are Hillcrest at an average of £237,500, Park Bank at an average of £295,000 and Newbrook Road at an average of £306,214.
Which train stations are available in or near Hulton?
Some of the train stations available in or near Hulton are Atherton, Hag Fold and Daisy Hill.
Property Price Paid in Hulton by Year
The average sold property price by year was:
| Year | Average Sold Price | Price Change |
Sold Properties
|
|---|---|---|---|
| 2025 | £338,250 | -6% |
10 Properties |
| 2024 | £357,333 | 14% |
21 Properties |
| 2023 | £308,527 | -35% |
7 Properties |
| 2022 | £415,091 | 19% |
17 Properties |
| 2021 | £337,192 | 11% |
13 Properties |
| 2020 | £300,909 | 17% |
11 Properties |
| 2019 | £249,445 | -19% |
10 Properties |
| 2018 | £295,954 | 12% |
11 Properties |
| 2017 | £259,970 | -1% |
17 Properties |
| 2016 | £263,700 | 4% |
19 Properties |
| 2015 | £252,482 | 18% |
14 Properties |
| 2014 | £206,749 | -6% |
8 Properties |
| 2013 | £218,600 | -7% |
12 Properties |
| 2012 | £234,750 | 16% |
8 Properties |
| 2011 | £198,272 | 4% |
11 Properties |
| 2010 | £191,250 | -29% |
8 Properties |
| 2009 | £247,415 | -16% |
12 Properties |
| 2008 | £287,500 | 6% |
2 Properties |
| 2007 | £270,778 | 29% |
7 Properties |
| 2006 | £192,177 | -23% |
11 Properties |
| 2005 | £236,436 | 18% |
8 Properties |
| 2004 | £193,276 | 14% |
7 Properties |
| 2003 | £166,811 | 24% |
8 Properties |
| 2002 | £126,136 | 13% |
18 Properties |
| 2001 | £109,943 | 7% |
20 Properties |
| 2000 | £102,646 | -10% |
13 Properties |
| 1999 | £113,375 | 16% |
8 Properties |
| 1998 | £95,466 | 15% |
15 Properties |
| 1997 | £80,916 | -5% |
12 Properties |
| 1996 | £85,300 | -6% |
5 Properties |
| 1995 | £90,821 | - |
7 Properties |
Property Price per Property Type in Hulton
Here you can find historic sold price data in order to help with your property search.
The average Property Paid Price for specific property types in the last three years are:
| Property Type | Average Sold Price | Sold Properties |
|---|---|---|
| Semi Detached House | £304,642.00 | 14 Semi Detached Houses |
| Terraced House | £194,845.00 | 2 Terraced Houses |
| Detached House | £381,431.00 | 22 Detached Houses |

