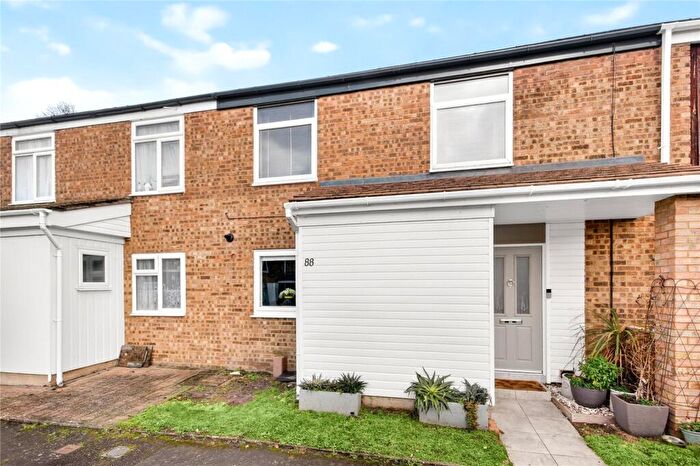
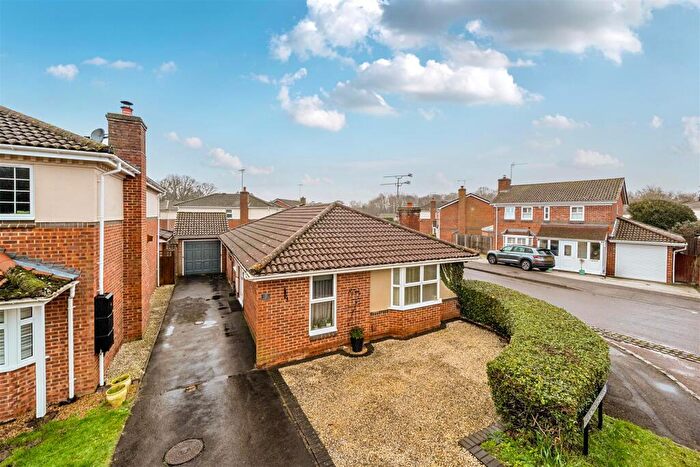
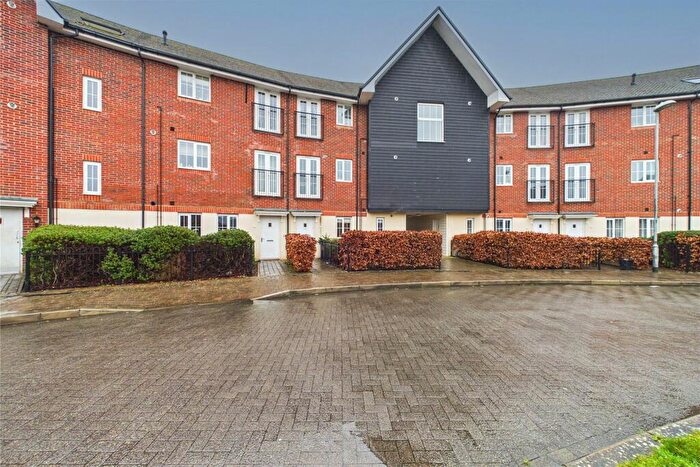
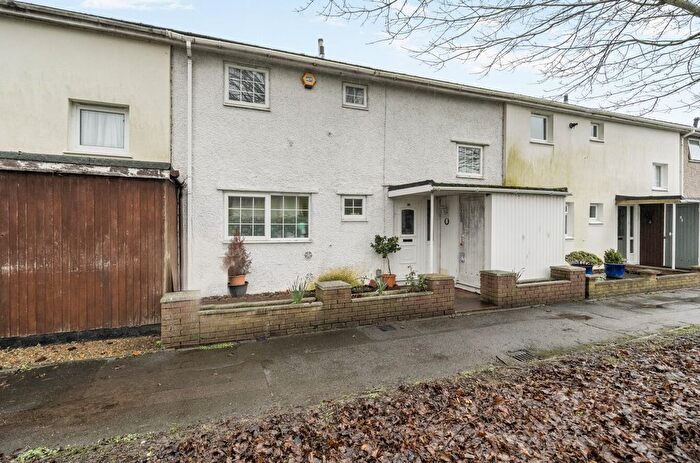
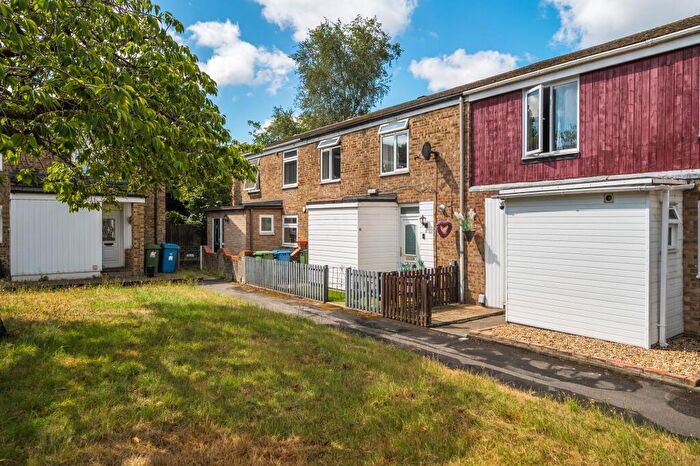
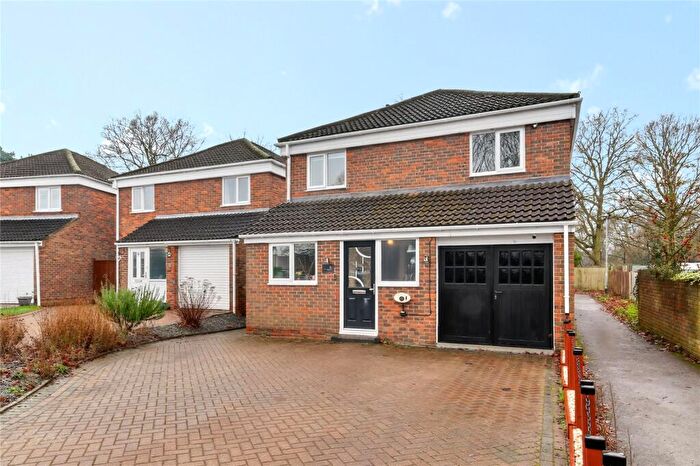
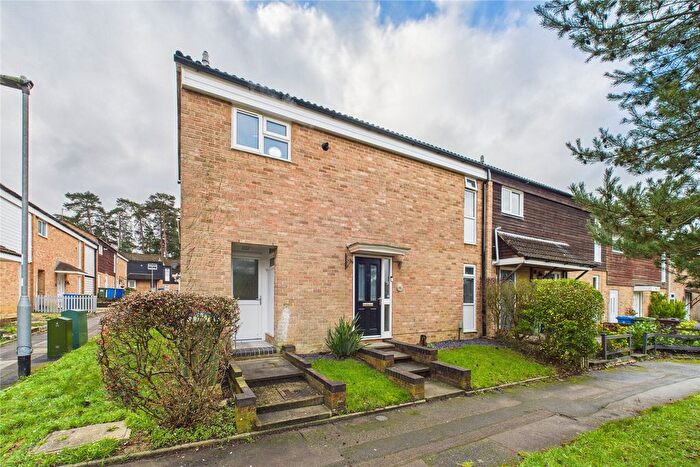
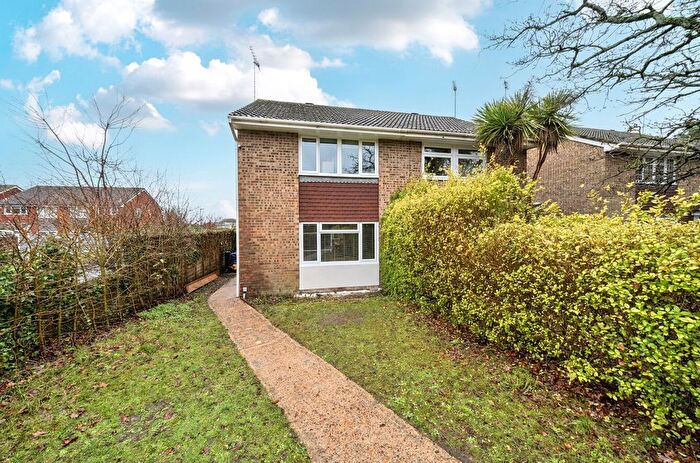
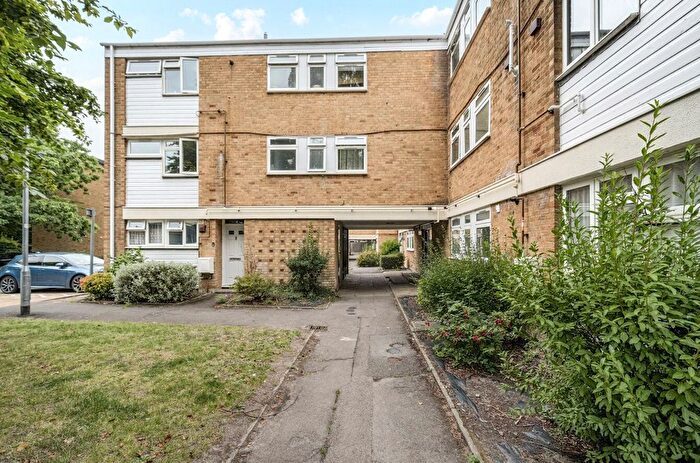
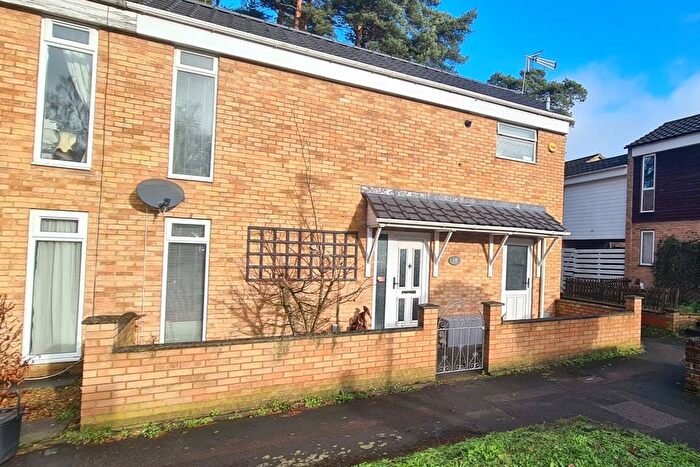
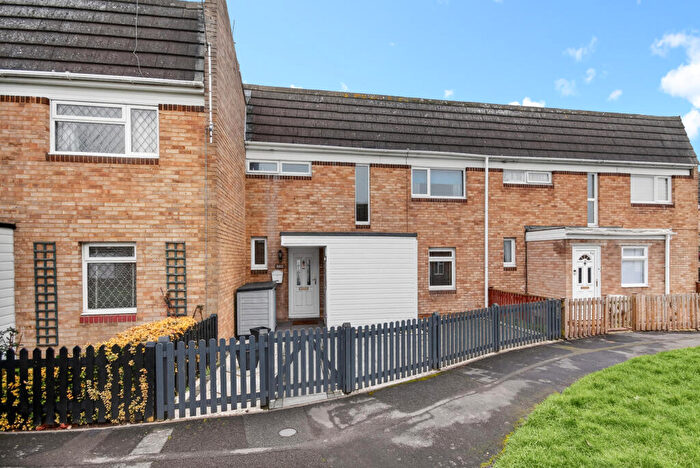
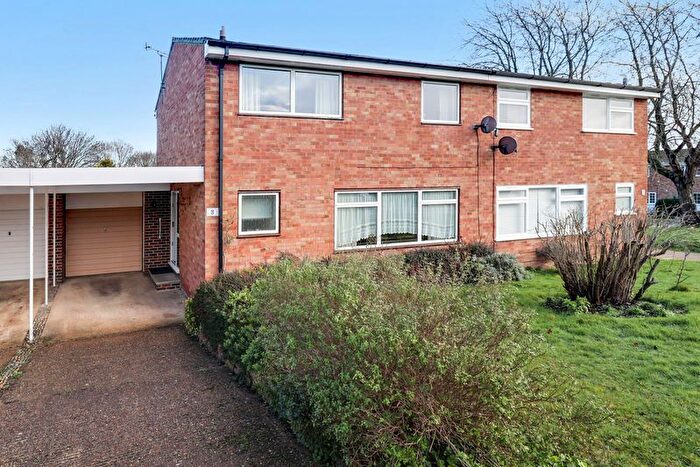
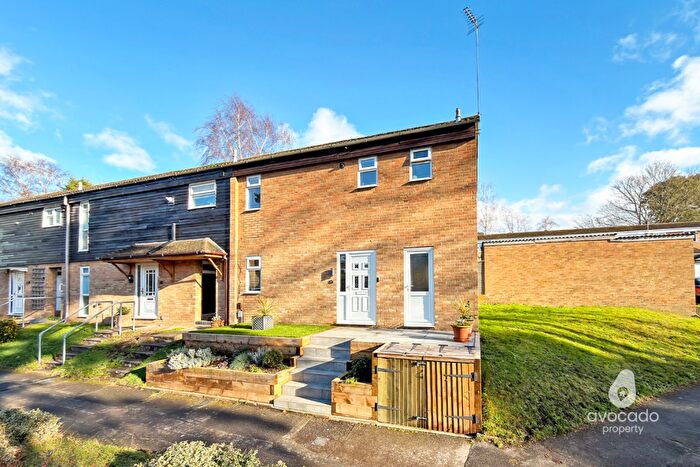
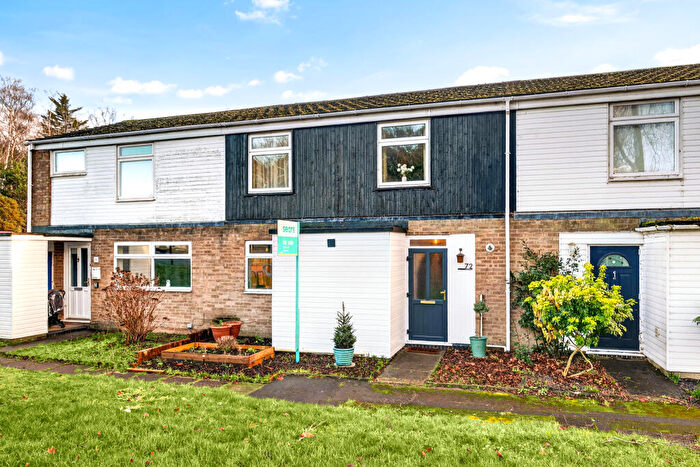
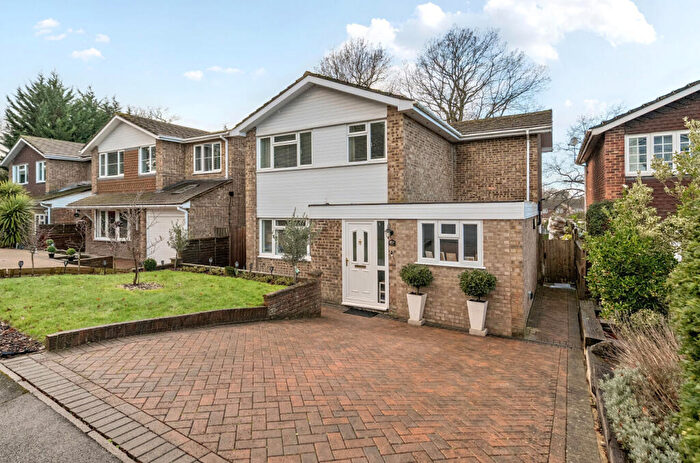
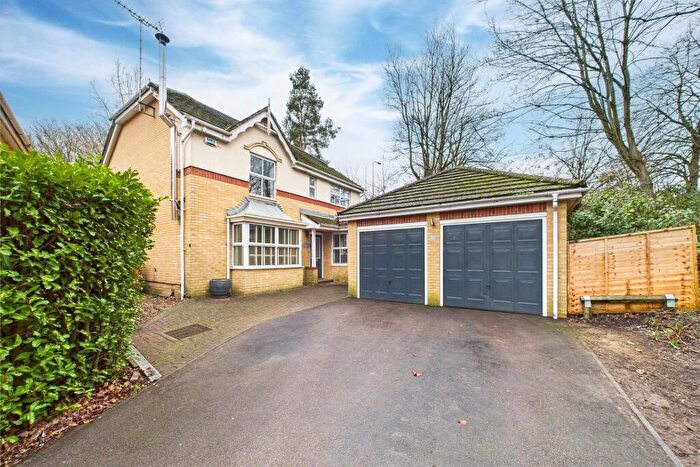
Houses for sale & to rent in Great Hollands South, Bracknell
House Prices in Great Hollands South
Properties in Great Hollands South have an average house price of £414,497.00 and had 155 Property Transactions within the last 3 years¹.
Great Hollands South is an area in Bracknell, Bracknell Forest with 1,861 households², where the most expensive property was sold for £700,000.00.
Properties for sale in Great Hollands South
Roads and Postcodes in Great Hollands South
Navigate through our locations to find the location of your next house in Great Hollands South, Bracknell for sale or to rent.
| Streets | Postcodes |
|---|---|
| Beedon Drive | RG12 8GJ |
| Birkdale | RG12 8ZP |
| Carnoustie | RG12 8ZW |
| Compton Close | RG12 8GH |
| Eddington Road | RG12 8GF |
| Flexford Green | RG12 8GQ |
| Halewood | RG12 8XB |
| Hatchgate Copse | RG12 8GG |
| Highfield | RG12 8XD |
| Holbeck | RG12 8XE RG12 8XF RG12 8XG |
| Holland Pines | RG12 8UY RG12 8UZ |
| Lytham | RG12 8ZN |
| Penwood Gardens | RG12 8GN |
| Ramsbury Close | RG12 8GE |
| Ringmead | RG12 8FS |
| Ringwood | RG12 8XU RG12 8YG RG12 8YQ |
| Sarum | RG12 8XZ |
| Silwood | RG12 8WU |
| Southwold | RG12 8XY |
| Spinis | RG12 8XA |
| St Andrews | RG12 8ZB RG12 8ZL RG12 8ZQ |
| Staplehurst | RG12 8DB RG12 8DD |
| Stratfield | RG12 8WT |
| Sylvanus | RG12 8XX |
| Tawfield | RG12 8YU |
| Trevelyan | RG12 8YD |
| Turnberry | RG12 8ZH RG12 8ZJ |
| Ullswater | RG12 8XH RG12 8XJ RG12 8XQ |
| Underwood | RG12 8XL RG12 8XN RG12 8XW |
| Waxwing Park | RG12 8GS |
| Wickham Vale | RG12 8GW |
Transport near Great Hollands South
- FAQ
- Price Paid By Year
- Property Type Price
Frequently asked questions about Great Hollands South
What is the average price for a property for sale in Great Hollands South?
The average price for a property for sale in Great Hollands South is £414,497. This amount is 0.72% higher than the average price in Bracknell. There are 1,200 property listings for sale in Great Hollands South.
What streets have the most expensive properties for sale in Great Hollands South?
The streets with the most expensive properties for sale in Great Hollands South are Silwood at an average of £593,333, Sylvanus at an average of £565,000 and Ramsbury Close at an average of £560,000.
What streets have the most affordable properties for sale in Great Hollands South?
The streets with the most affordable properties for sale in Great Hollands South are St Andrews at an average of £282,428, Underwood at an average of £300,055 and Holbeck at an average of £312,458.
Which train stations are available in or near Great Hollands South?
Some of the train stations available in or near Great Hollands South are Bracknell, Martins Heron and Crowthorne.
Property Price Paid in Great Hollands South by Year
The average sold property price by year was:
| Year | Average Sold Price | Price Change |
Sold Properties
|
|---|---|---|---|
| 2025 | £421,662 | 2% |
43 Properties |
| 2024 | £413,208 | 1% |
56 Properties |
| 2023 | £410,285 | 2% |
56 Properties |
| 2022 | £400,186 | 7% |
59 Properties |
| 2021 | £372,626 | 8% |
71 Properties |
| 2020 | £342,597 | 3% |
53 Properties |
| 2019 | £332,654 | -2% |
63 Properties |
| 2018 | £340,192 | -6% |
48 Properties |
| 2017 | £360,249 | 13% |
51 Properties |
| 2016 | £315,164 | 1% |
57 Properties |
| 2015 | £312,019 | 17% |
84 Properties |
| 2014 | £260,388 | 7% |
71 Properties |
| 2013 | £242,448 | 5% |
53 Properties |
| 2012 | £230,505 | 6% |
60 Properties |
| 2011 | £216,319 | 3% |
42 Properties |
| 2010 | £209,248 | 2% |
38 Properties |
| 2009 | £204,414 | 0,2% |
41 Properties |
| 2008 | £204,058 | -8% |
49 Properties |
| 2007 | £219,755 | 10% |
100 Properties |
| 2006 | £197,827 | 4% |
110 Properties |
| 2005 | £190,333 | 6% |
77 Properties |
| 2004 | £179,447 | 5% |
104 Properties |
| 2003 | £169,989 | 8% |
97 Properties |
| 2002 | £156,152 | 15% |
140 Properties |
| 2001 | £133,318 | 8% |
113 Properties |
| 2000 | £122,543 | 16% |
82 Properties |
| 1999 | £102,435 | 3% |
126 Properties |
| 1998 | £99,195 | 17% |
68 Properties |
| 1997 | £82,013 | 4% |
107 Properties |
| 1996 | £78,541 | 10% |
94 Properties |
| 1995 | £70,422 | - |
85 Properties |
Property Price per Property Type in Great Hollands South
Here you can find historic sold price data in order to help with your property search.
The average Property Paid Price for specific property types in the last three years are:
| Property Type | Average Sold Price | Sold Properties |
|---|---|---|
| Semi Detached House | £439,612.00 | 40 Semi Detached Houses |
| Detached House | £546,670.00 | 41 Detached Houses |
| Terraced House | £354,756.00 | 61 Terraced Houses |
| Flat | £200,692.00 | 13 Flats |

