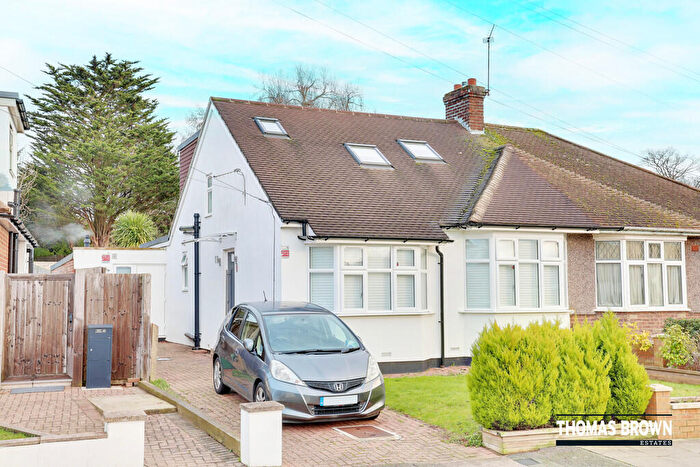
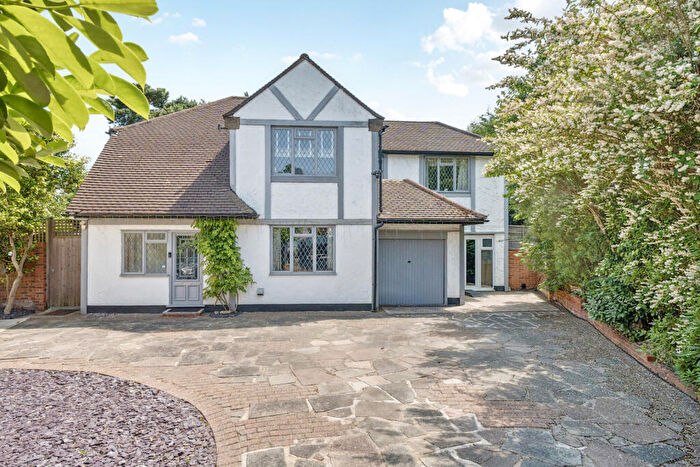
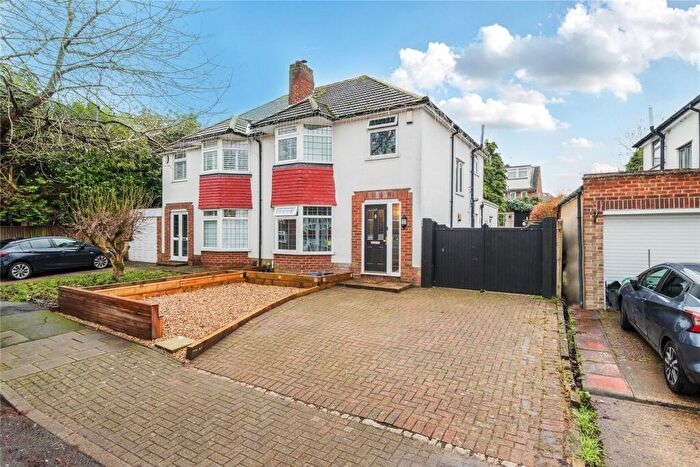
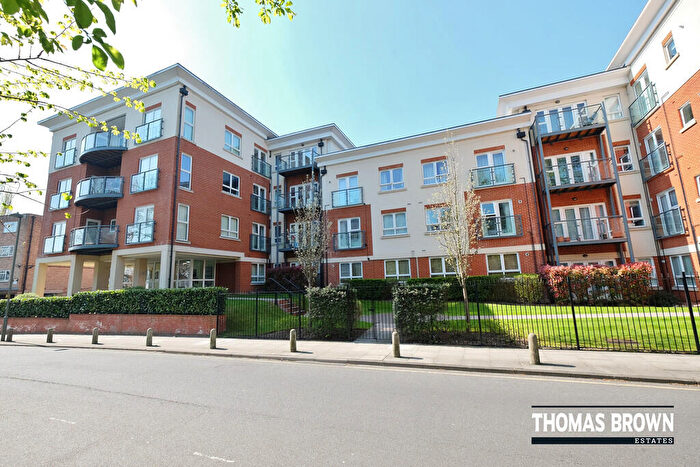
Houses for sale & to rent in Orpington, Orpington
House Prices in Orpington
Properties in this part of Orpington within Orpington have an average house price of £531,721.00 and had 536 Property Transactions within the last 3 years¹. This area has 6,326 households² , where the most expensive property was sold for £1,550,000.00.
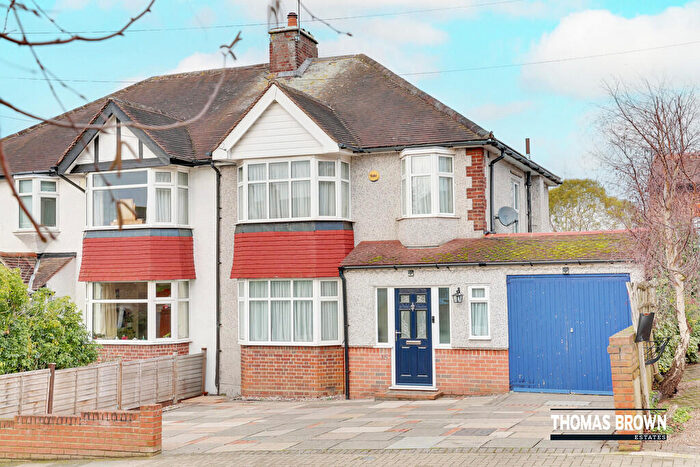
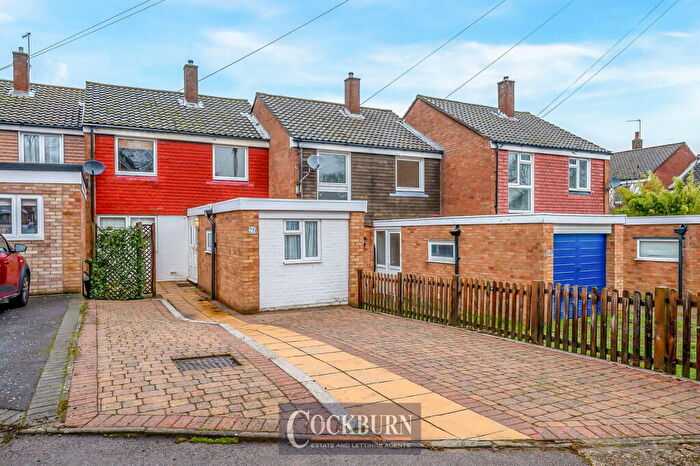
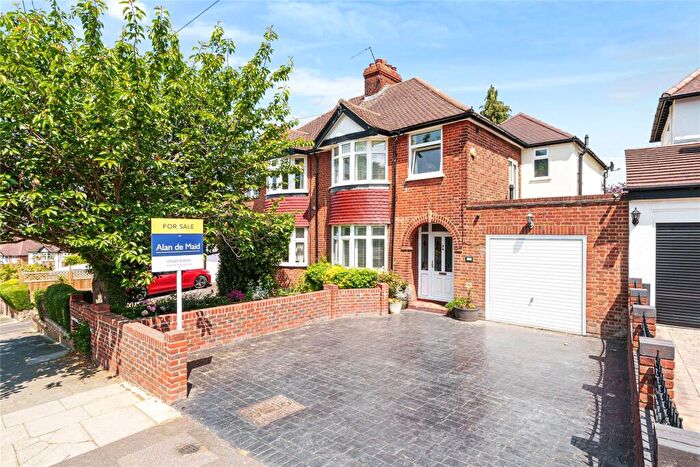
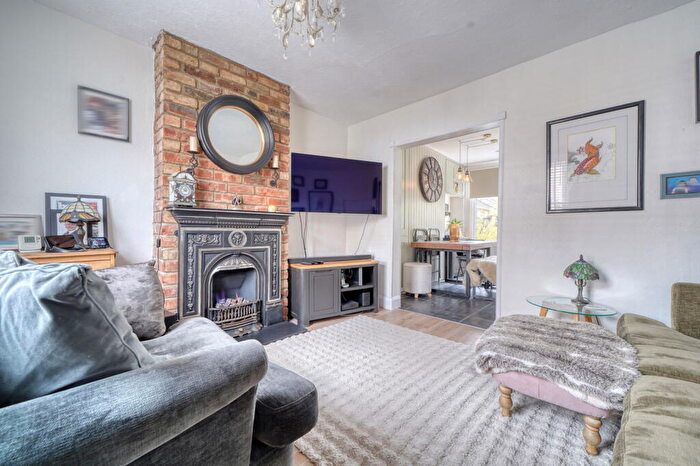
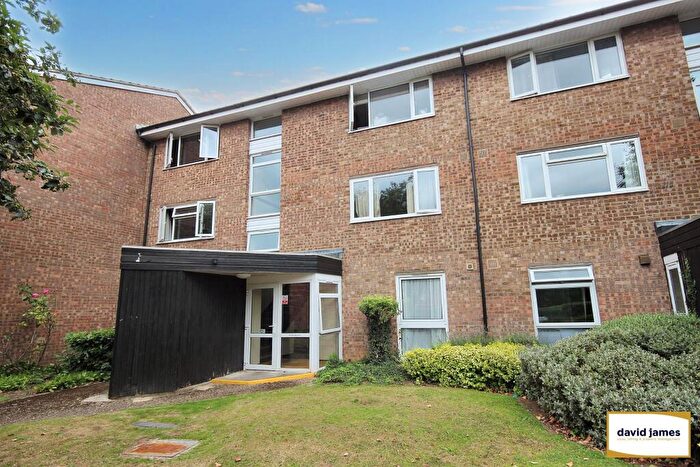
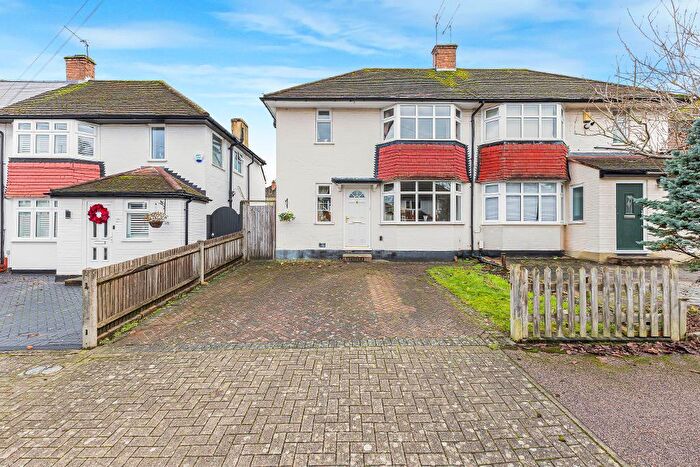
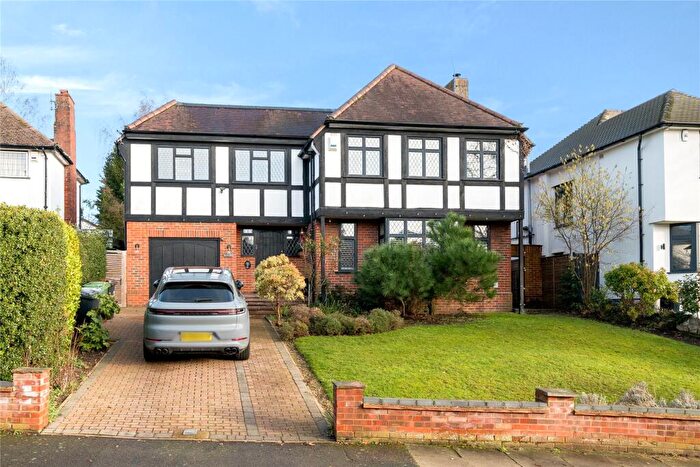
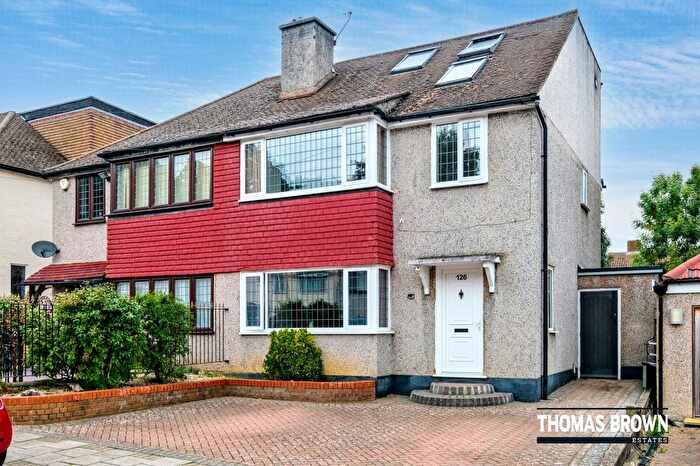
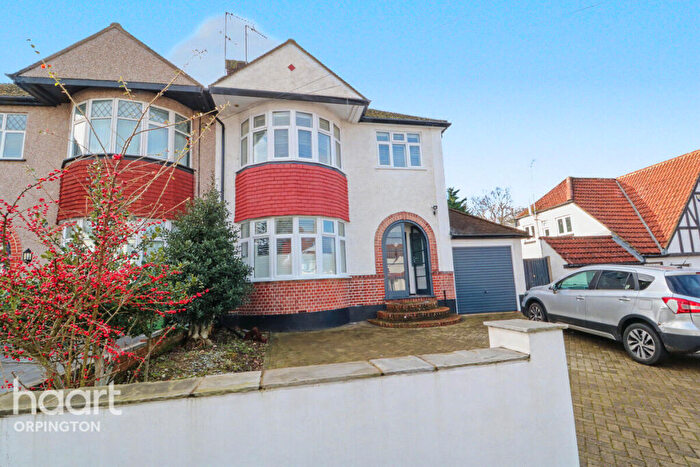
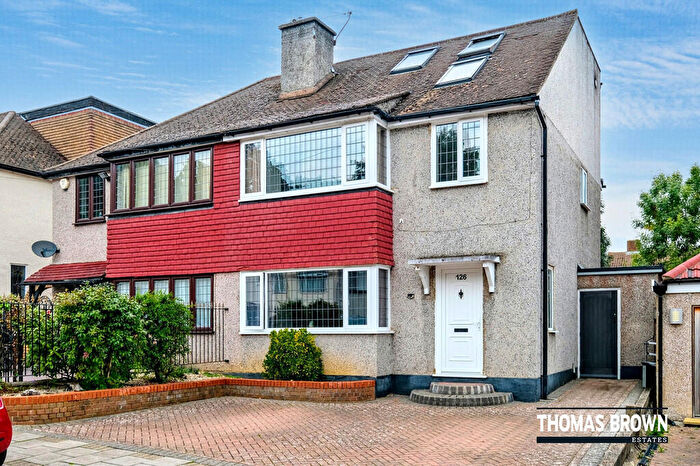
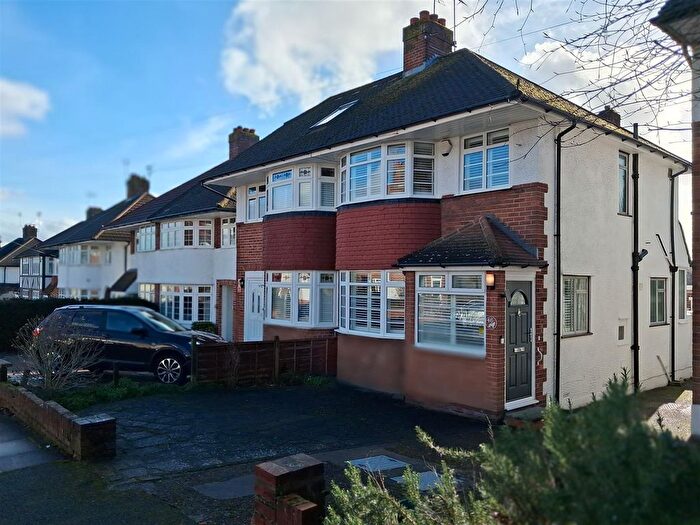
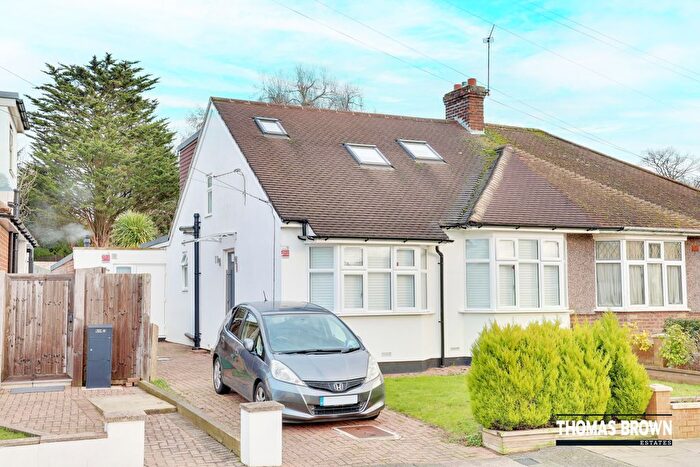
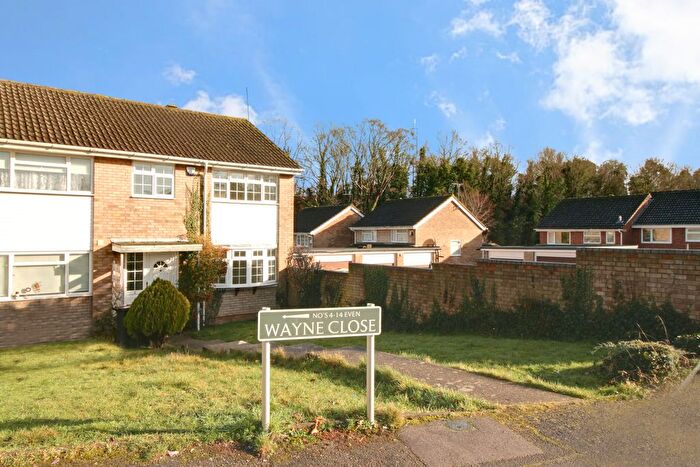
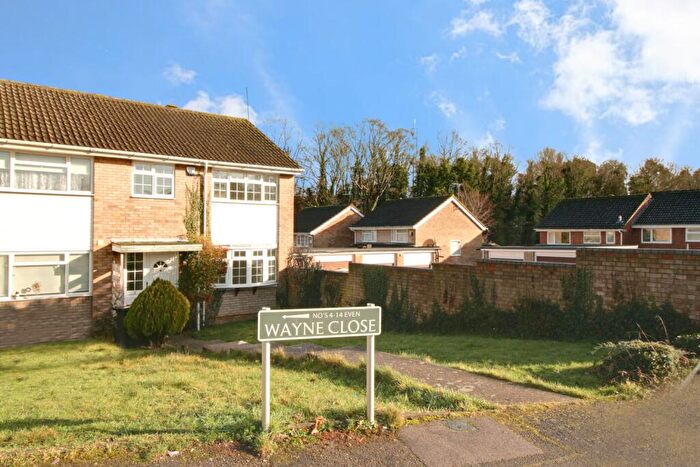
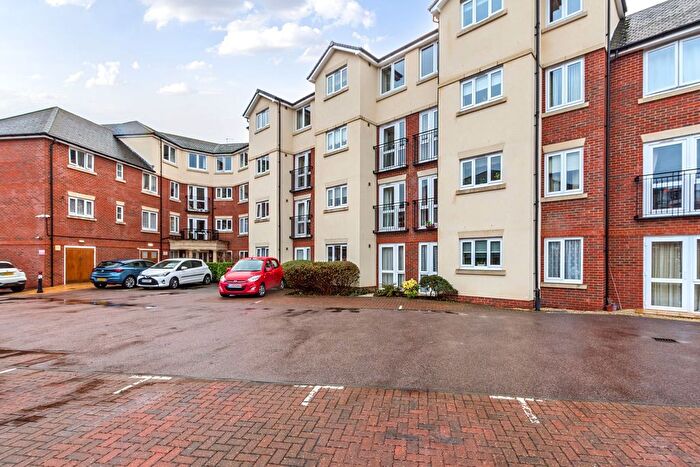
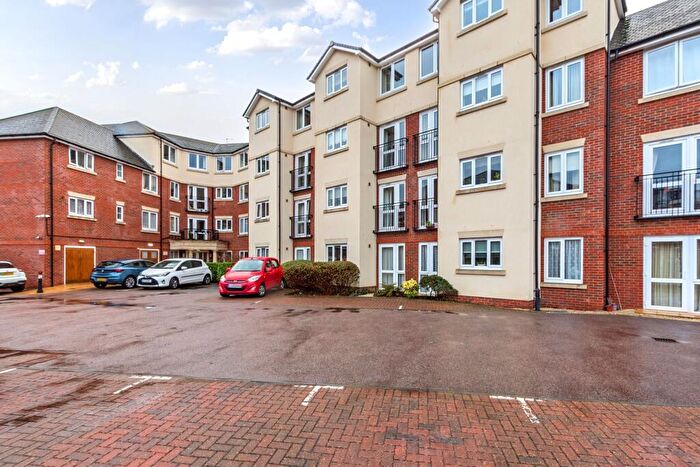
Properties for sale in Orpington
Roads and Postcodes in Orpington
Navigate through our locations to find the location of your next house in Orpington, Orpington for sale or to rent.
Transport near Orpington
-
Orpington Station
-
Chelsfield Station
-
St.Mary Cray Station
-
St Mary Cray Station
-
Petts Wood Station
-
Knockholt Station
- FAQ
- Price Paid By Year
- Property Type Price
Frequently asked questions about Orpington
What is the average price for a property for sale in Orpington?
The average price for a property for sale in Orpington is £531,721. This amount is 5% lower than the average price in Orpington. There are 6,498 property listings for sale in Orpington.
What streets have the most expensive properties for sale in Orpington?
The streets with the most expensive properties for sale in Orpington are Hill End at an average of £950,000, Abingdon Way at an average of £920,000 and Tower Road at an average of £846,833.
What streets have the most affordable properties for sale in Orpington?
The streets with the most affordable properties for sale in Orpington are Westwell Close at an average of £180,214, Waltham Close at an average of £235,666 and Badgers Copse at an average of £255,999.
Which train stations are available in or near Orpington?
Some of the train stations available in or near Orpington are Orpington, Chelsfield and St.Mary Cray.
Property Price Paid in Orpington by Year
The average sold property price by year was:
| Year | Average Sold Price | Price Change |
Sold Properties
|
|---|---|---|---|
| 2025 | £541,344 | 6% |
141 Properties |
| 2024 | £509,613 | -8% |
214 Properties |
| 2023 | £550,362 | 4% |
181 Properties |
| 2022 | £529,041 | 5% |
267 Properties |
| 2021 | £504,964 | 7% |
288 Properties |
| 2020 | £469,877 | 9% |
234 Properties |
| 2019 | £427,277 | -7% |
221 Properties |
| 2018 | £456,321 | 10% |
300 Properties |
| 2017 | £412,472 | 2% |
266 Properties |
| 2016 | £404,405 | 3% |
286 Properties |
| 2015 | £390,797 | 10% |
270 Properties |
| 2014 | £350,290 | 11% |
236 Properties |
| 2013 | £310,964 | 9% |
230 Properties |
| 2012 | £282,690 | 2% |
206 Properties |
| 2011 | £277,085 | -1% |
171 Properties |
| 2010 | £278,974 | 12% |
253 Properties |
| 2009 | £245,627 | -20% |
164 Properties |
| 2008 | £294,226 | 1% |
143 Properties |
| 2007 | £290,552 | 12% |
296 Properties |
| 2006 | £256,236 | -4% |
331 Properties |
| 2005 | £267,650 | 11% |
238 Properties |
| 2004 | £238,874 | 5% |
265 Properties |
| 2003 | £227,259 | 11% |
253 Properties |
| 2002 | £201,501 | 13% |
288 Properties |
| 2001 | £175,746 | 7% |
259 Properties |
| 2000 | £163,973 | 15% |
202 Properties |
| 1999 | £140,077 | 14% |
275 Properties |
| 1998 | £120,647 | 4% |
166 Properties |
| 1997 | £115,722 | 16% |
279 Properties |
| 1996 | £96,795 | 1% |
253 Properties |
| 1995 | £95,528 | - |
195 Properties |
Property Price per Property Type in Orpington
Here you can find historic sold price data in order to help with your property search.
The average Property Paid Price for specific property types in the last three years are:
| Property Type | Average Sold Price | Sold Properties |
|---|---|---|
| Semi Detached House | £576,904.00 | 251 Semi Detached Houses |
| Detached House | £723,805.00 | 106 Detached Houses |
| Terraced House | £471,053.00 | 70 Terraced Houses |
| Flat | £279,838.00 | 109 Flats |

