
Houses for sale & to rent in West Wickham, West Wickham
House Prices in West Wickham
Properties in this part of West Wickham within West Wickham have an average house price of £632k and had 468 Property Transactions within the last 3 years¹. This area has 5,545 households² , where the most expensive property was sold for £1.4M.
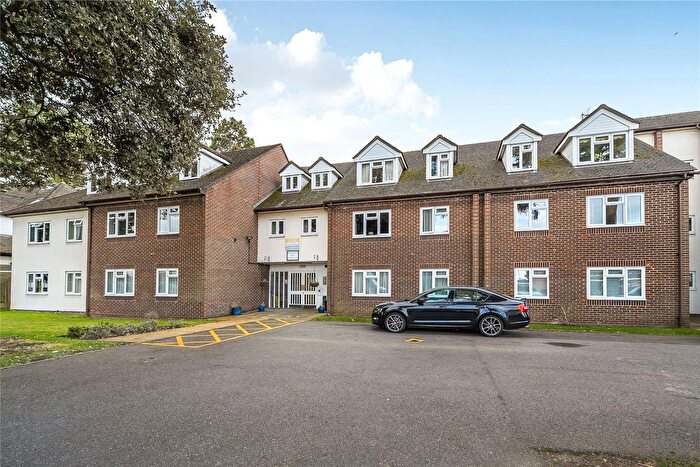
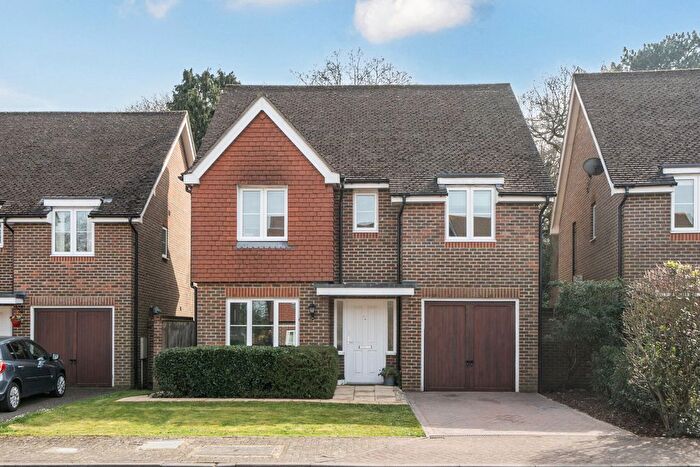
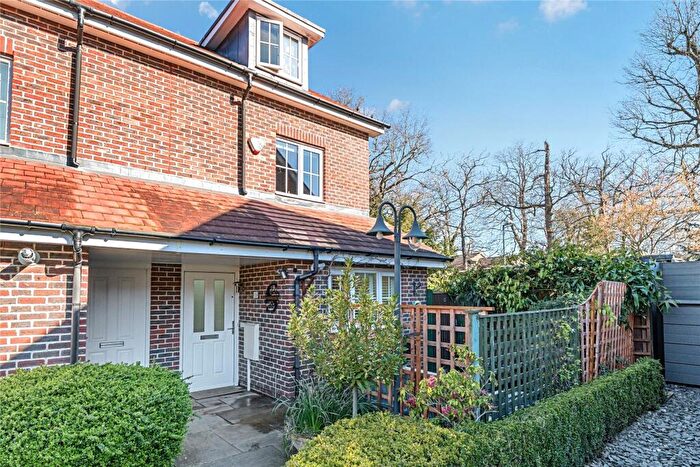
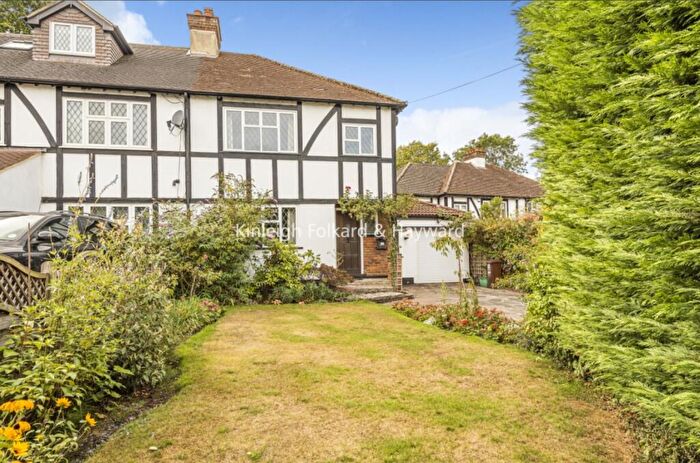
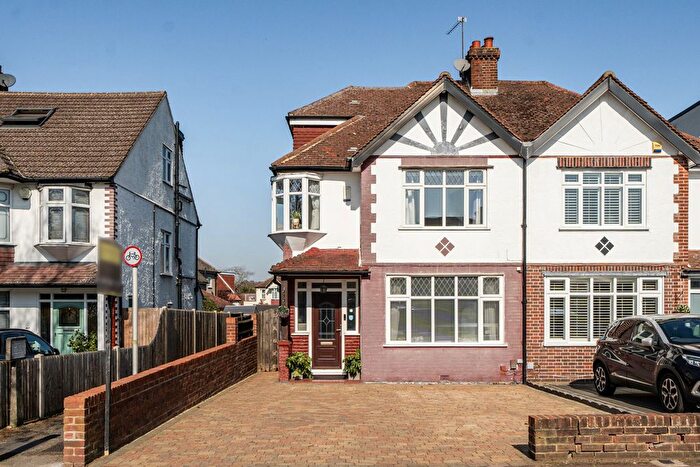
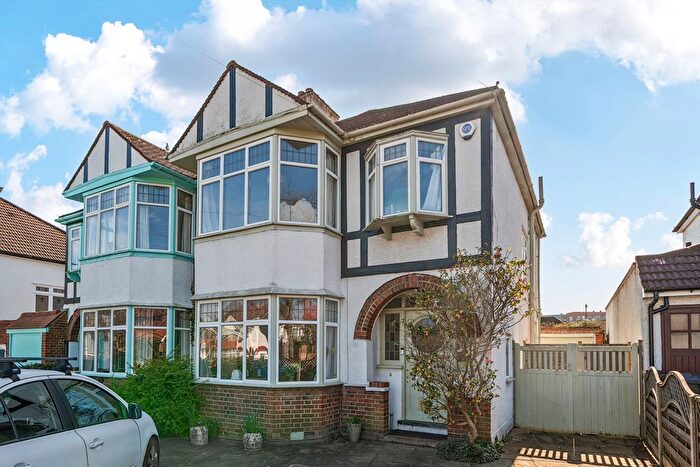
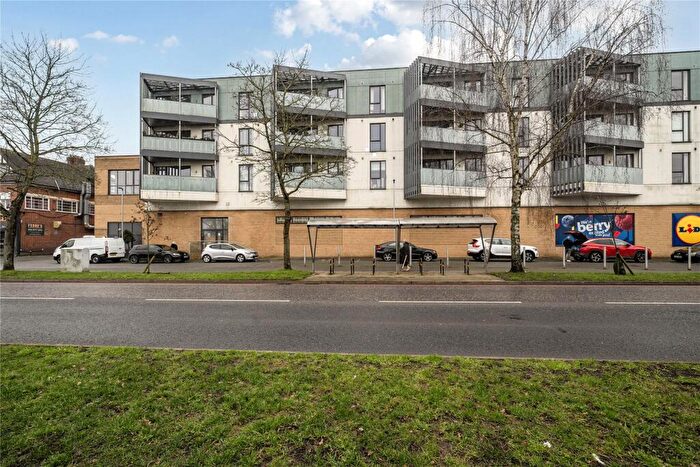
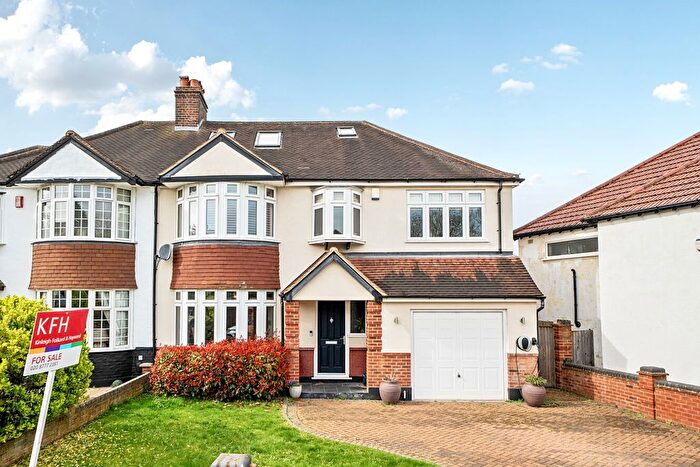
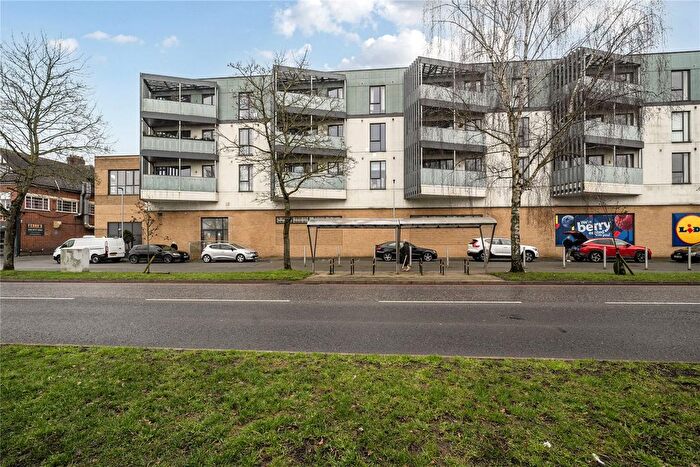
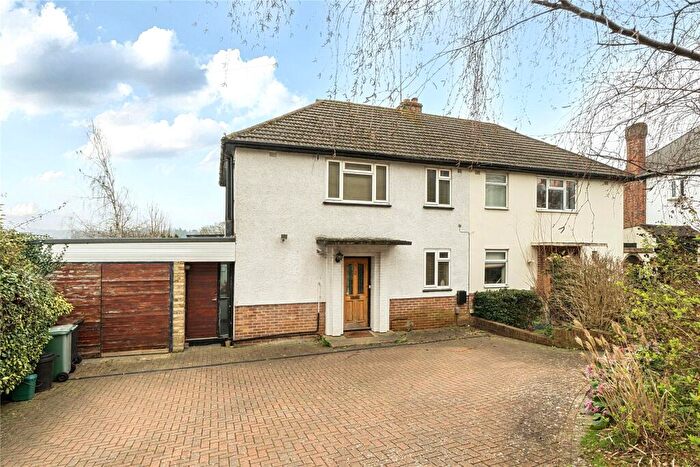
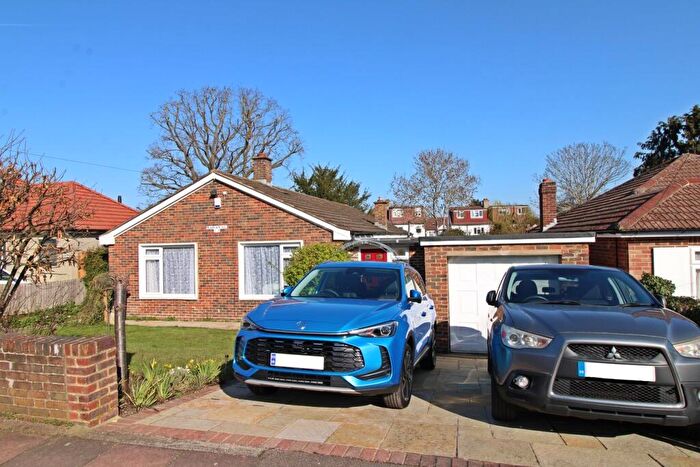
Properties for sale in West Wickham

![]()
If you are looking to sell your house, let it out, or receive a property valuation, an expert can help you.
Click the button below to get started.

Roads and Postcodes in West Wickham
Navigate through our locations to find the location of your next house in West Wickham, West Wickham for sale or to rent.
Transport near West Wickham
-
 West Wickham Station
 -
Hayes Station
-
Hayes (Kent) Station
-
Eden Park Station
-
 Addington Village Station
 -
Fieldway Station
-
Bromley South Station
-
Gravel Hill Station
-
Shortlands Station
-
Elmers End Station
- FAQ
- Price Paid By Year
- Property Type Price
Frequently asked questions about West Wickham
What is the average price for a property for sale in West Wickham?
The average price for a property for sale in West Wickham is £631,509. This amount is 0.22% higher than the average price in West Wickham. There are 851 property listings for sale in West Wickham.
What streets have the most expensive properties for sale in West Wickham?
The streets with the most expensive properties for sale in West Wickham are Inchwood at an average of £1,075,000, The Mead at an average of £1,055,833 and Hayes Chase at an average of £963,000.
What streets have the most affordable properties for sale in West Wickham?
The streets with the most affordable properties for sale in West Wickham are Red Lodge Road at an average of £92,000, Pond Cottage Lane at an average of £172,680 and Wickham Court Road at an average of £280,227.
Which train stations are available in or near West Wickham?
Some of the train stations available in or near West Wickham are West Wickham, Hayes and Hayes (Kent).
Property Price Paid in West Wickham by Year
The average sold property price by year was:
| Year | Average Sold Price | Price Change |
Sold Properties
|
|---|---|---|---|
| 2026 | £690,000 | 5% |
1 Property |
| 2025 | £655,277 | 6% |
138 Properties |
| 2024 | £618,745 | -1% |
192 Properties |
| 2023 | £625,028 | -6% |
137 Properties |
| 2022 | £662,886 | 8% |
180 Properties |
| 2021 | £607,411 | 4% |
227 Properties |
| 2020 | £583,644 | 3% |
169 Properties |
| 2019 | £565,215 | 3% |
188 Properties |
| 2018 | £546,065 | -3% |
177 Properties |
| 2017 | £560,403 | 8% |
186 Properties |
| 2016 | £515,672 | 7% |
226 Properties |
| 2015 | £479,903 | 4% |
223 Properties |
| 2014 | £462,005 | 15% |
193 Properties |
| 2013 | £390,610 | 1% |
199 Properties |
| 2012 | £387,173 | 7% |
183 Properties |
| 2011 | £360,817 | 3% |
192 Properties |
| 2010 | £350,701 | 9% |
211 Properties |
| 2009 | £320,188 | 4% |
185 Properties |
| 2008 | £307,929 | -18% |
180 Properties |
| 2007 | £363,309 | 8% |
268 Properties |
| 2006 | £335,463 | 11% |
300 Properties |
| 2005 | £299,860 | 1% |
201 Properties |
| 2004 | £296,676 | 12% |
275 Properties |
| 2003 | £261,362 | 7% |
234 Properties |
| 2002 | £244,300 | 14% |
296 Properties |
| 2001 | £210,609 | 10% |
268 Properties |
| 2000 | £188,531 | 14% |
187 Properties |
| 1999 | £162,114 | 14% |
255 Properties |
| 1998 | £139,353 | 11% |
234 Properties |
| 1997 | £123,734 | 15% |
245 Properties |
| 1996 | £105,687 | -2% |
215 Properties |
| 1995 | £108,186 | - |
163 Properties |
Property Price per Property Type in West Wickham
Here you can find historic sold price data in order to help with your property search.
The average Property Paid Price for specific property types in the last three years are:
| Property Type | Average Sold Price | Sold Properties |
|---|---|---|
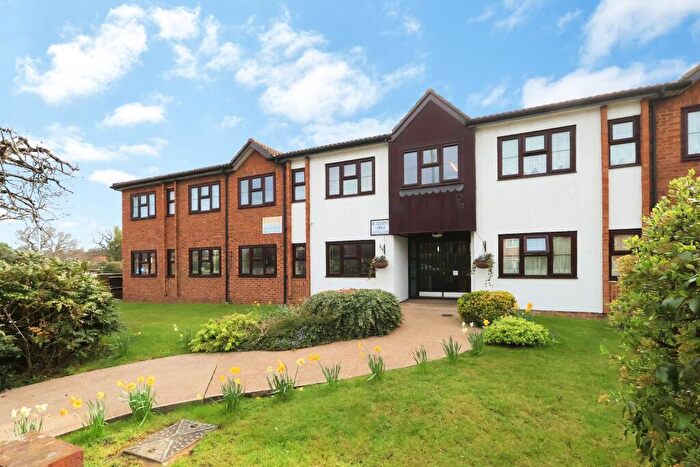
| Flat | £279,694.00 | 84 Flats |
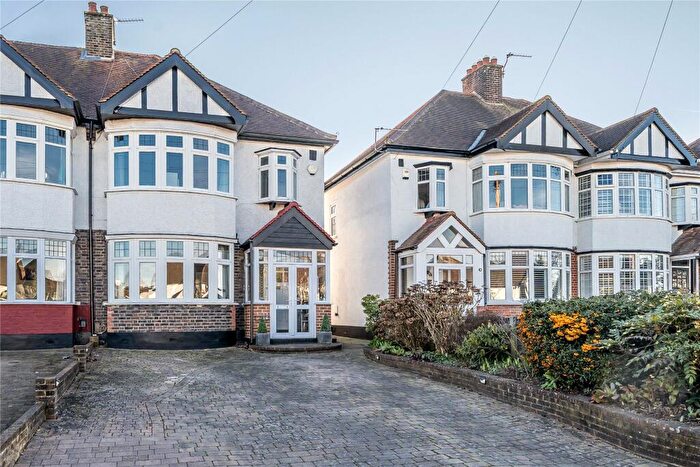
| Semi Detached House | £700,447.00 | 219 Semi Detached Houses |
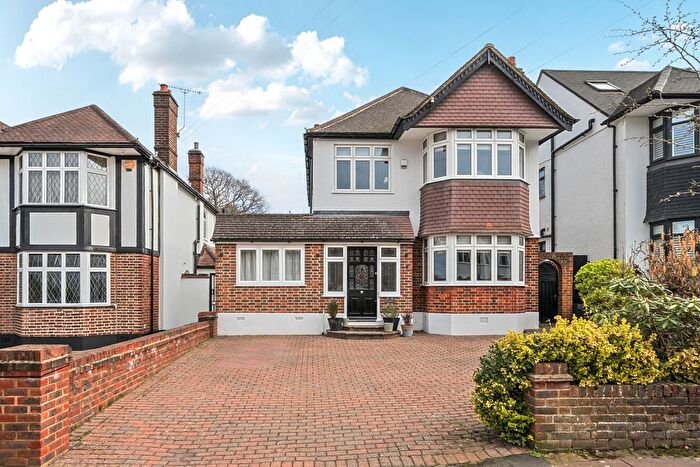
| Detached House | £883,527.00 | 72 Detached Houses |
| Terraced House | £591,827.00 | 93 Terraced Houses |