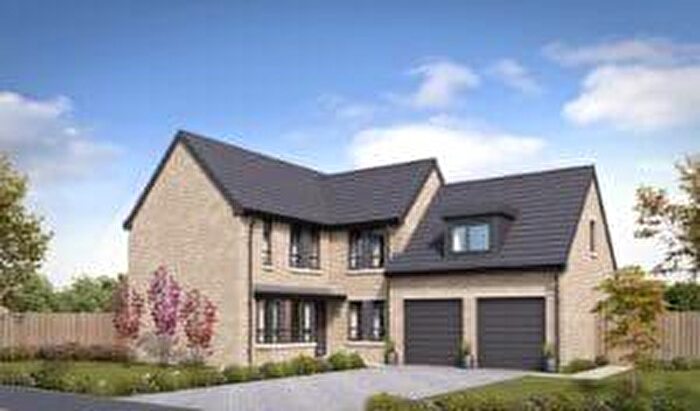
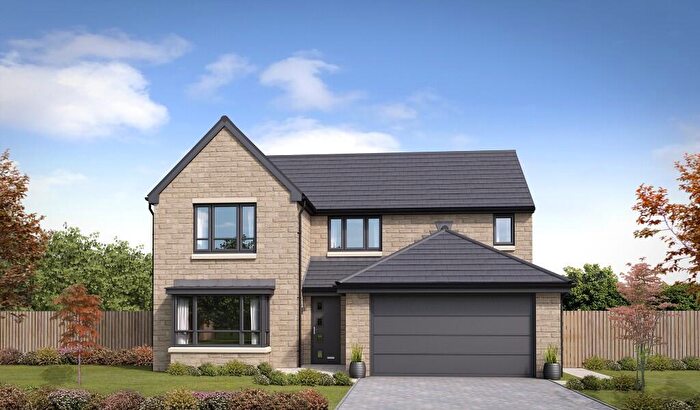
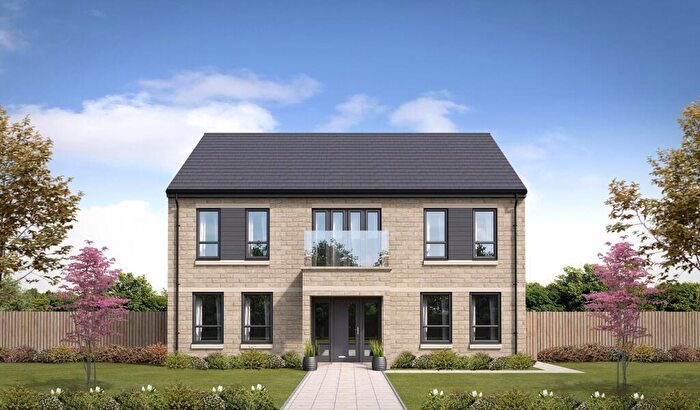
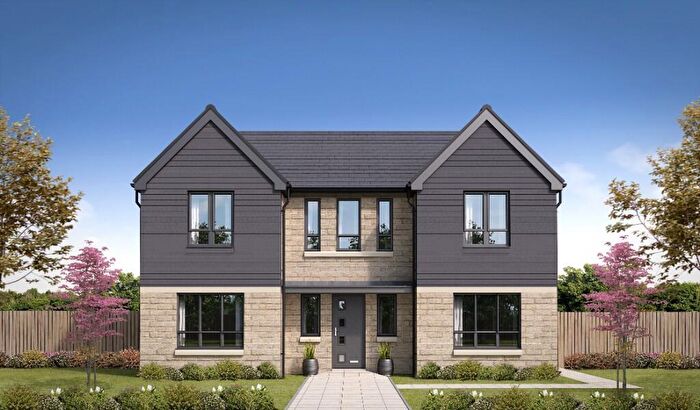
Houses for sale & to rent in Elland, Brighouse
House Prices in Elland
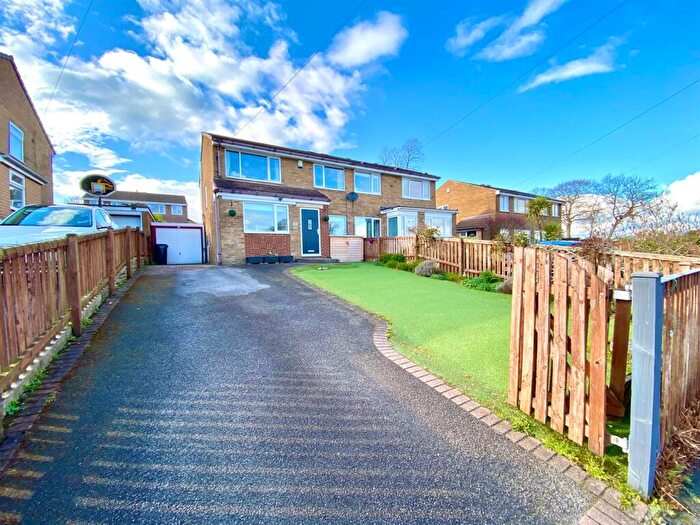
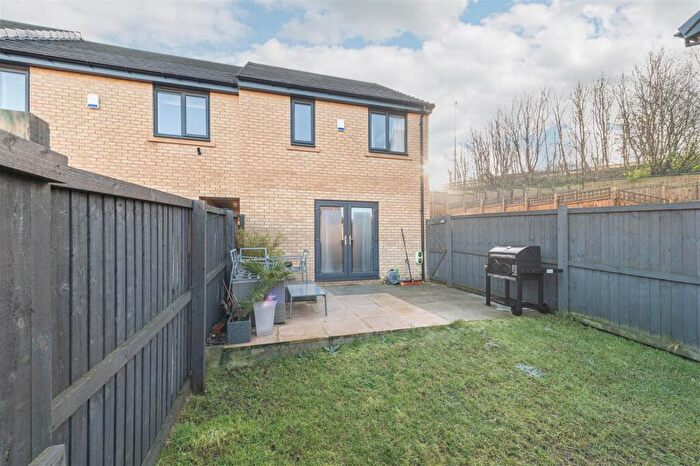
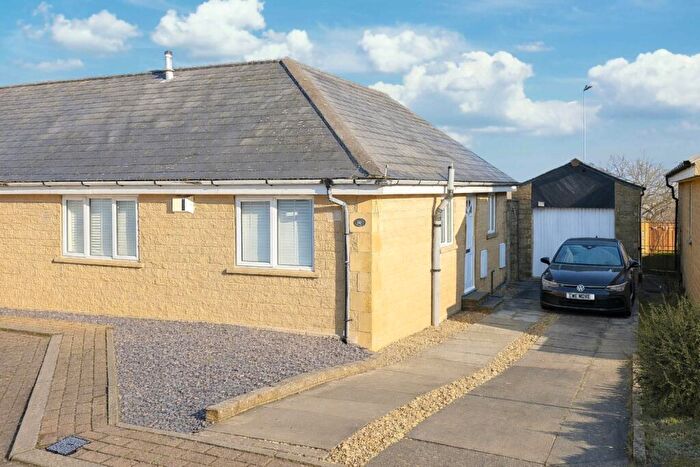
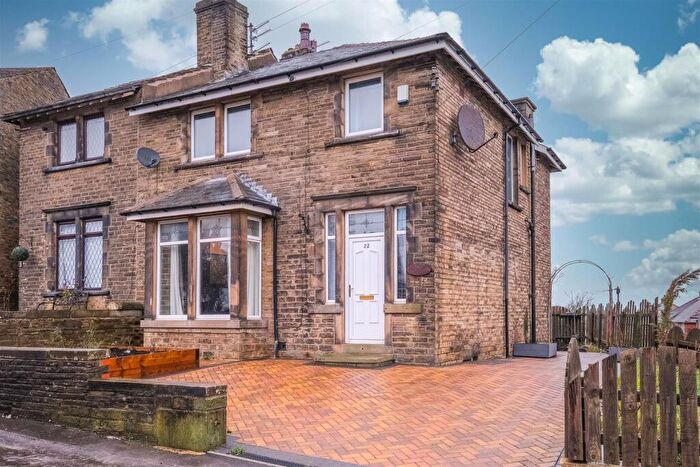
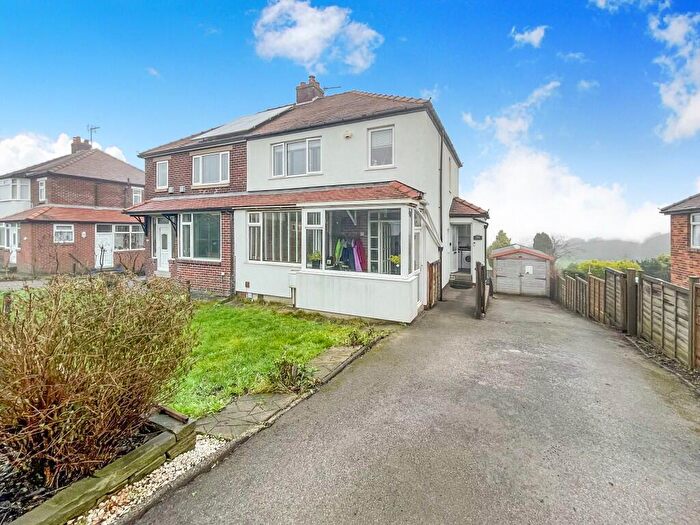
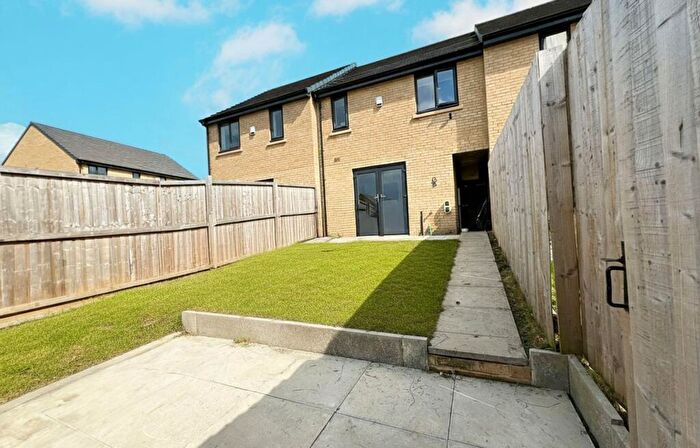
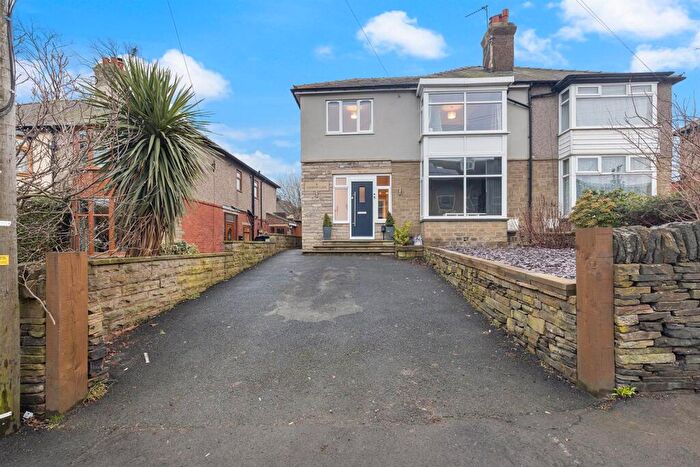
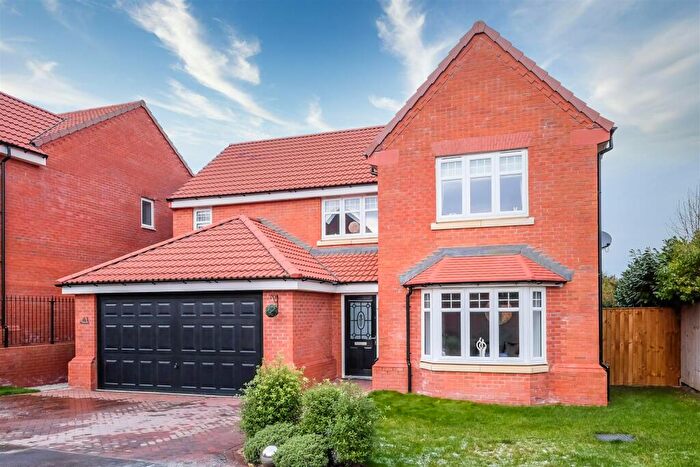
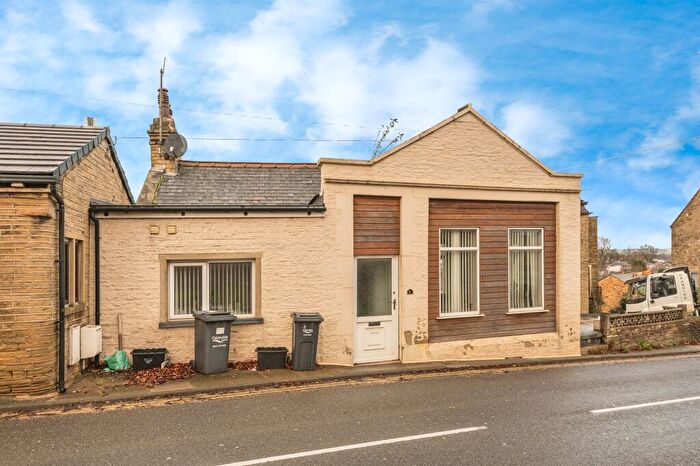
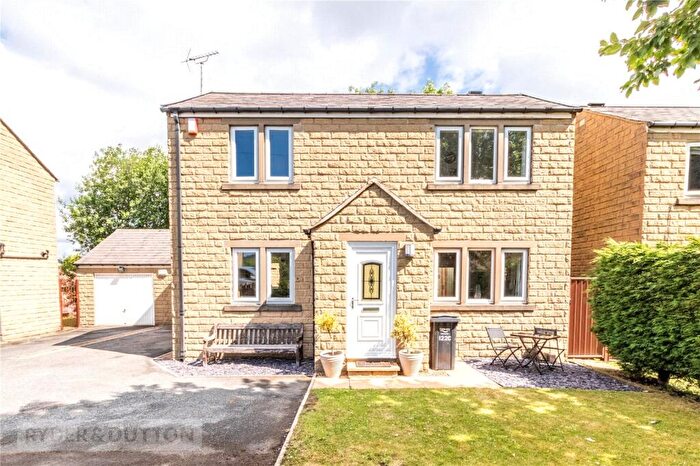
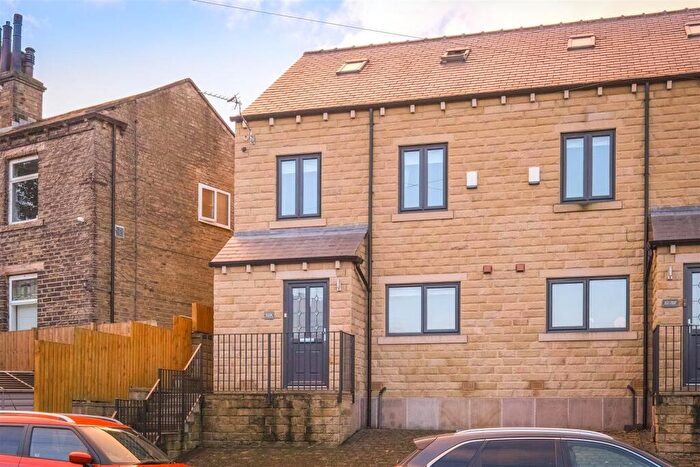
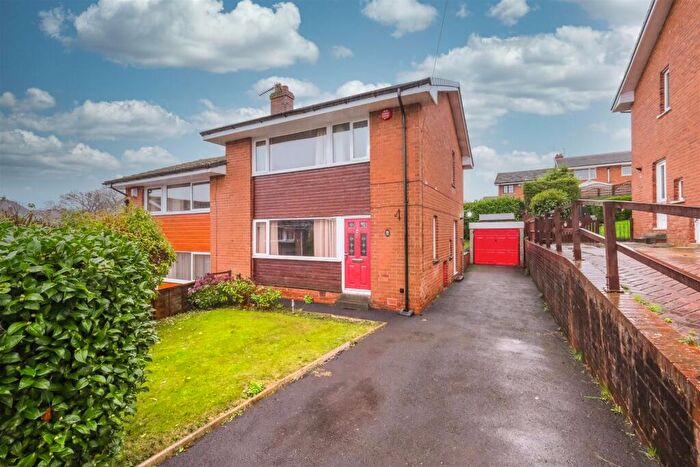
Properties in Elland have an average house price of £173,902.00 and had 61 Property Transactions within the last 3 years¹.
Elland is an area in Brighouse, Calderdale with 530 households², where the most expensive property was sold for £500,000.00.
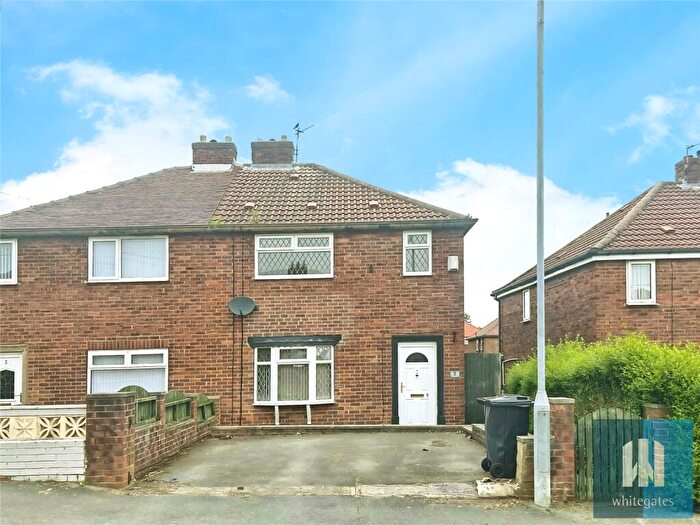
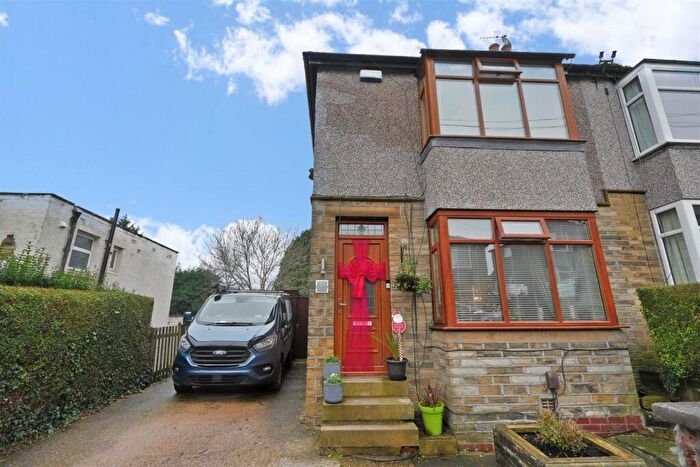
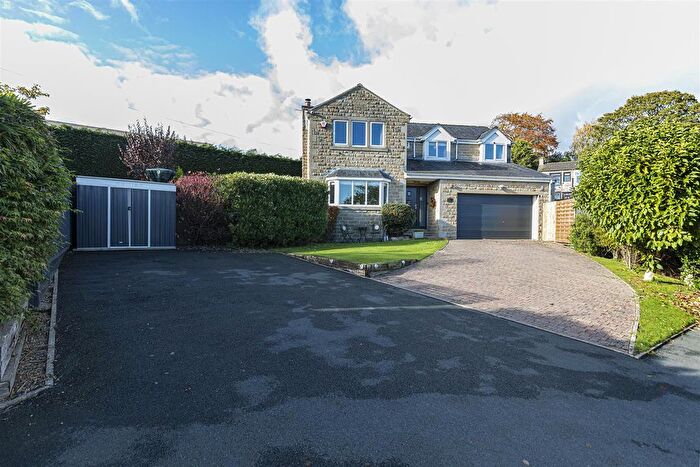
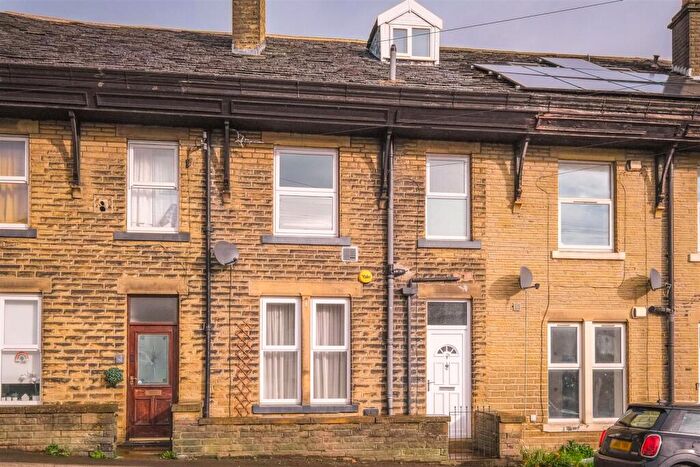
Properties for sale in Elland
Roads and Postcodes in Elland
Navigate through our locations to find the location of your next house in Elland, Brighouse for sale or to rent.
| Streets | Postcodes |
|---|---|
| Acre Lane | HD6 3FD |
| Autumn Close | HD6 3FG |
| Badger Hill | HD6 3QX |
| Clough Lane | HD6 3QH HD6 3QQ |
| Cromwell Close | HD6 3BN |
| Delf Hill | HD6 3NL |
| Delf Place | HD6 3NJ |
| Dewsbury Road | HD6 3QB HD6 3QD HD6 3QE |
| Fixby View Yard | HD6 3QS |
| Fletcher Crescent | HD6 3PR |
| Garlick Street | HD6 3PW |
| Greenhead Lane | HD6 3PS |
| Mount Lane | HD6 3QZ HD6 3AB HD6 3PU |
| Mount Pleasant | HD6 3PX |
| New Hey Road | HD6 3LP HD6 3PY HD6 3PZ HD6 3QG |
| New Road Square | HD6 3QA |
| Pasture Close | HD6 3FE |
| Quarry Court | HD6 3NN |
| Regents Close | HD6 3QT |
| Sage Grove | HD6 3QF |
| Shears Drive | HD6 3FF |
| Slade Lane | HD6 3PL HD6 3PP |
| Spout Hill | HD6 3PJ HD6 3QY |
Transport near Elland
- FAQ
- Price Paid By Year
- Property Type Price
Frequently asked questions about Elland
What is the average price for a property for sale in Elland?
The average price for a property for sale in Elland is £173,902. This amount is 15% lower than the average price in Brighouse. There are 666 property listings for sale in Elland.
What streets have the most expensive properties for sale in Elland?
The streets with the most expensive properties for sale in Elland are Dewsbury Road at an average of £308,512, Badger Hill at an average of £260,000 and Sage Grove at an average of £228,600.
What streets have the most affordable properties for sale in Elland?
The streets with the most affordable properties for sale in Elland are Fixby View Yard at an average of £67,500, Regents Close at an average of £71,000 and Mount Lane at an average of £75,357.
Which train stations are available in or near Elland?
Some of the train stations available in or near Elland are Brighouse, Deighton and Huddersfield.
Property Price Paid in Elland by Year
The average sold property price by year was:
| Year | Average Sold Price | Price Change |
Sold Properties
|
|---|---|---|---|
| 2025 | £154,342 | -38% |
25 Properties |
| 2024 | £212,805 | 24% |
18 Properties |
| 2023 | £162,166 | 8% |
18 Properties |
| 2022 | £148,414 | -26% |
26 Properties |
| 2021 | £187,210 | 26% |
29 Properties |
| 2020 | £139,256 | -19% |
33 Properties |
| 2019 | £166,021 | -3% |
26 Properties |
| 2018 | £170,658 | 8% |
25 Properties |
| 2017 | £156,171 | 26% |
26 Properties |
| 2016 | £116,219 | -23% |
26 Properties |
| 2015 | £143,200 | 3% |
30 Properties |
| 2014 | £139,304 | 10% |
21 Properties |
| 2013 | £125,823 | -3% |
17 Properties |
| 2012 | £129,073 | 2% |
13 Properties |
| 2011 | £126,429 | 1% |
18 Properties |
| 2010 | £125,152 | -1% |
18 Properties |
| 2009 | £126,023 | 0,2% |
21 Properties |
| 2008 | £125,812 | -10% |
16 Properties |
| 2007 | £138,839 | -15% |
67 Properties |
| 2006 | £159,663 | 10% |
52 Properties |
| 2005 | £143,193 | 21% |
23 Properties |
| 2004 | £113,316 | 15% |
30 Properties |
| 2003 | £95,815 | 36% |
30 Properties |
| 2002 | £61,337 | 9% |
20 Properties |
| 2001 | £55,600 | 11% |
22 Properties |
| 2000 | £49,693 | 5% |
23 Properties |
| 1999 | £47,421 | 13% |
21 Properties |
| 1998 | £41,193 | -9% |
16 Properties |
| 1997 | £44,750 | -17% |
15 Properties |
| 1996 | £52,481 | 15% |
16 Properties |
| 1995 | £44,672 | - |
21 Properties |
Property Price per Property Type in Elland
Here you can find historic sold price data in order to help with your property search.
The average Property Paid Price for specific property types in the last three years are:
| Property Type | Average Sold Price | Sold Properties |
|---|---|---|
| Semi Detached House | £206,526.00 | 19 Semi Detached Houses |
| Terraced House | £148,729.00 | 24 Terraced Houses |
| Flat | £88,416.00 | 12 Flats |
| Detached House | £342,260.00 | 6 Detached Houses |

