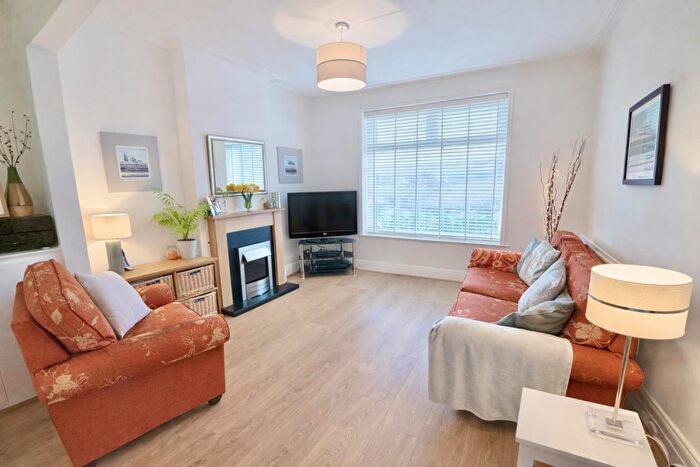
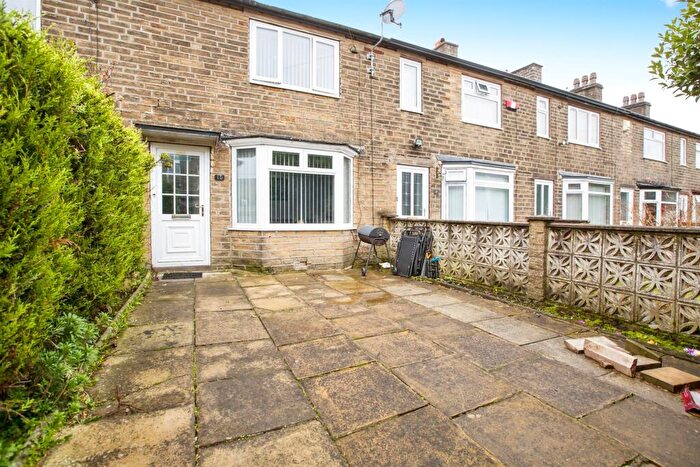
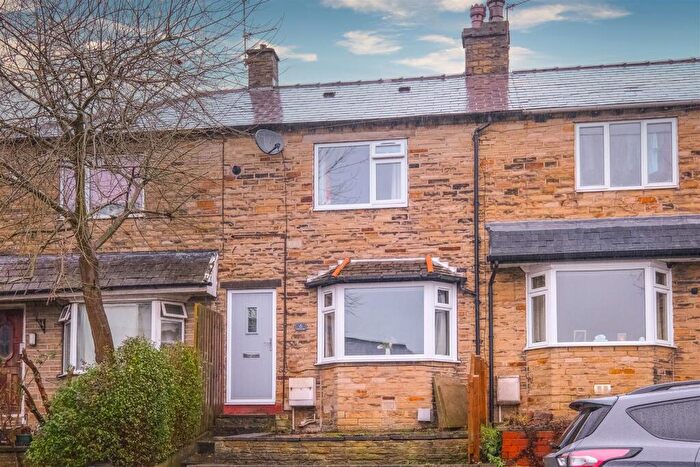
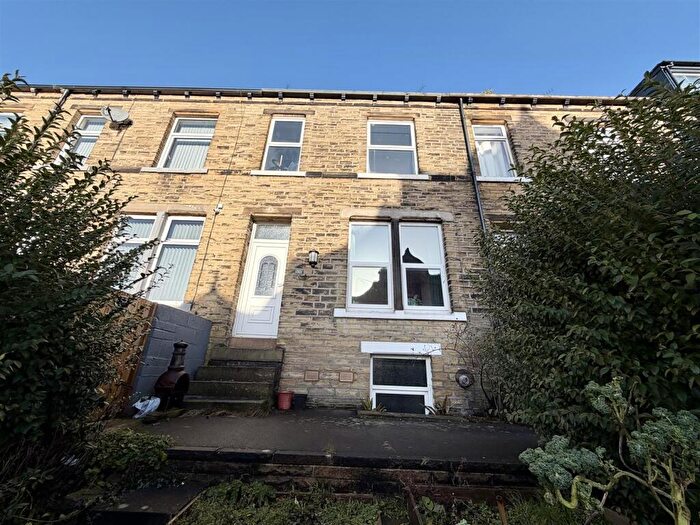
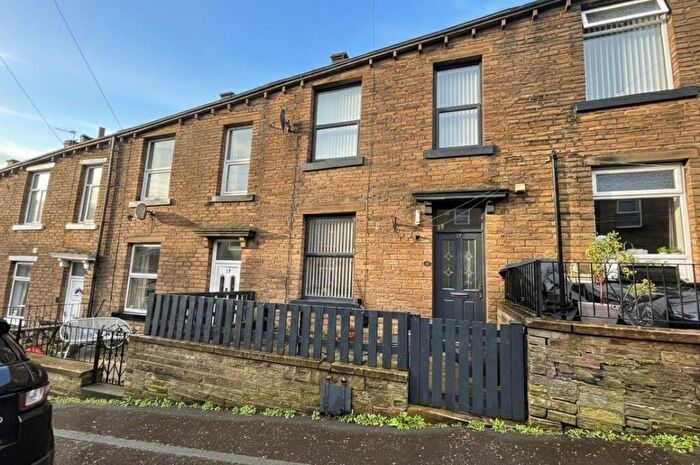
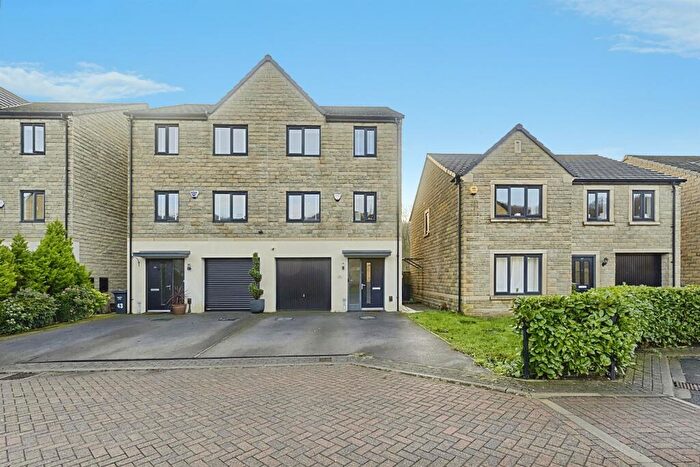
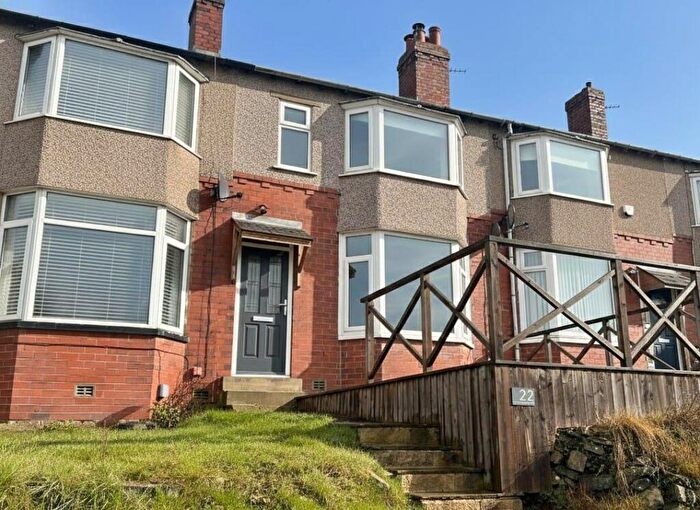
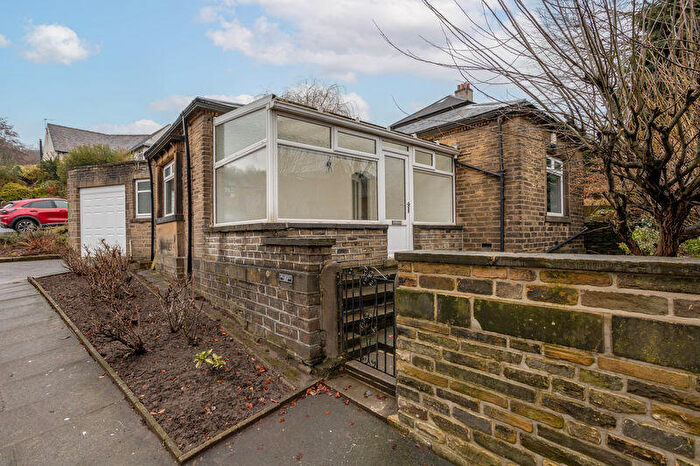
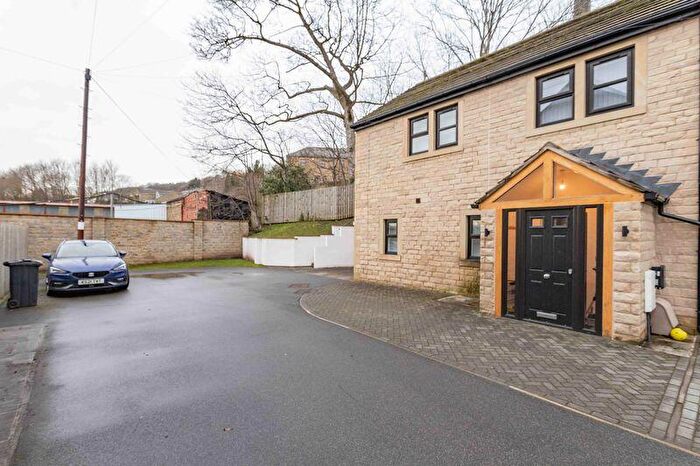
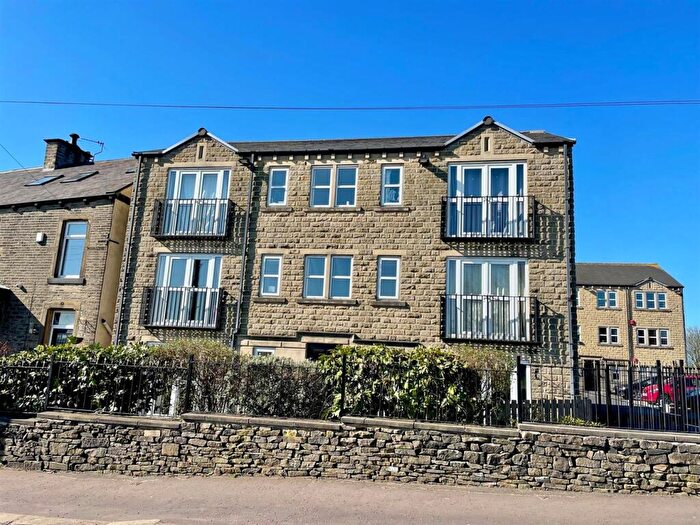
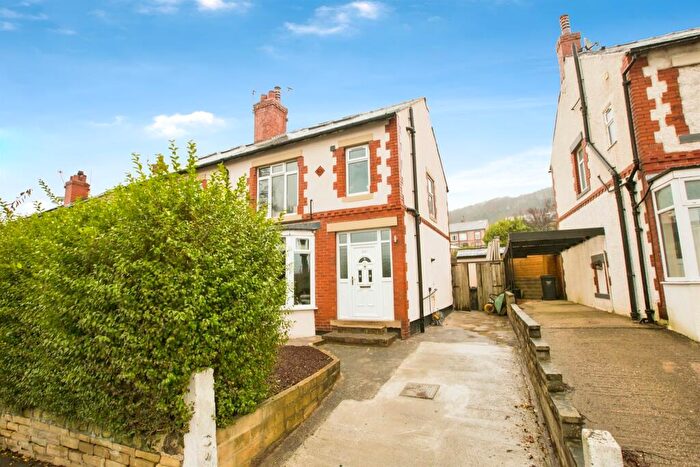
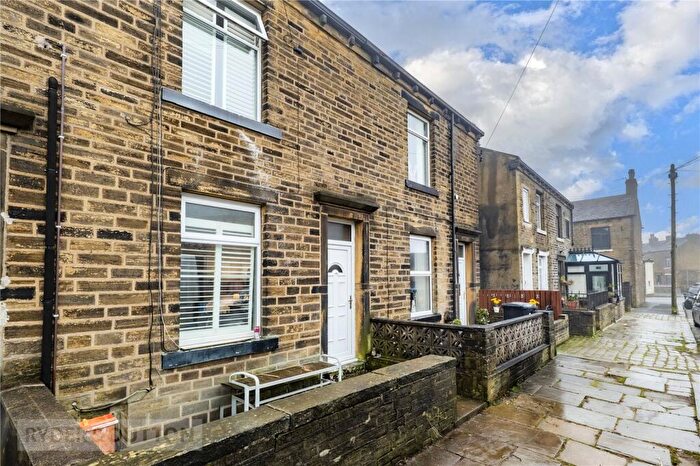
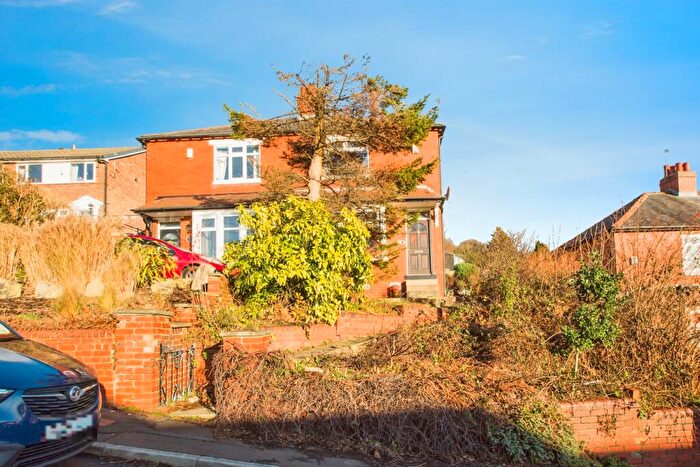
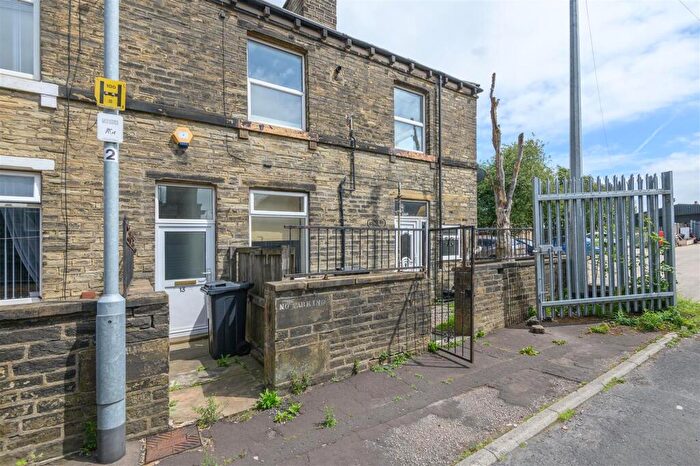
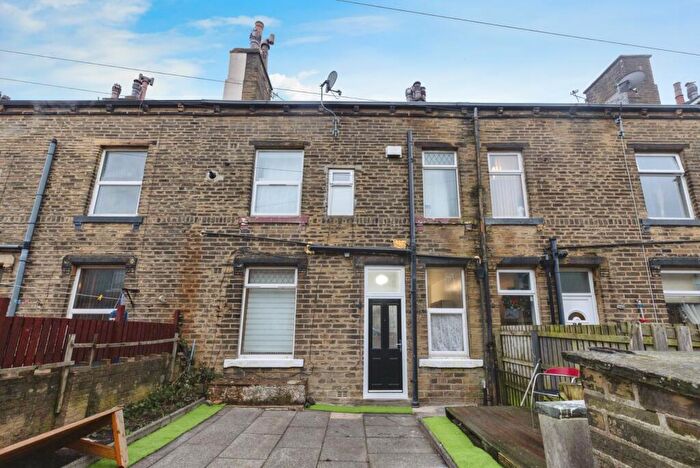
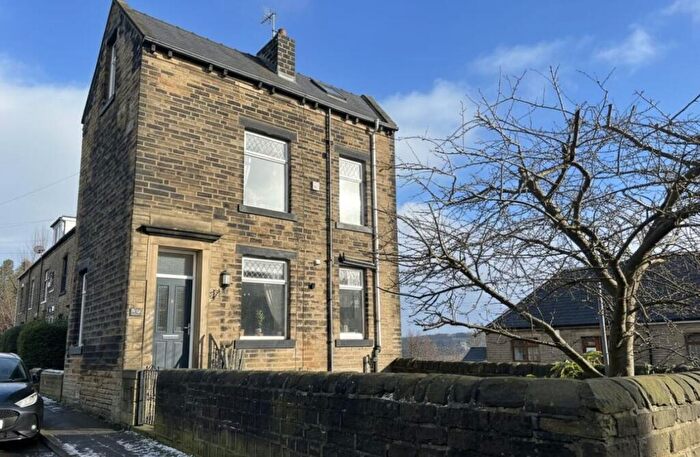
Houses for sale & to rent in Sowerby Bridge, Halifax
House Prices in Sowerby Bridge
Properties in Sowerby Bridge have an average house price of £219,711.00 and had 179 Property Transactions within the last 3 years¹.
Sowerby Bridge is an area in Halifax, Calderdale with 1,806 households², where the most expensive property was sold for £800,000.00.
Properties for sale in Sowerby Bridge
Roads and Postcodes in Sowerby Bridge
Navigate through our locations to find the location of your next house in Sowerby Bridge, Halifax for sale or to rent.
| Streets | Postcodes |
|---|---|
| Akroyd Terrace | HX2 7DS |
| Arlington Crescent | HX2 7HU |
| Ashdown Close | HX2 7LD |
| Atalanta Terrace | HX2 7HL |
| Bairstow Lane | HX2 7ND |
| Beech Gardens | HX2 7AD |
| Burnley Road | HX2 7JD HX2 7JG |
| Calder Avenue | HX2 7DL |
| Cliff Crescent | HX2 7DF |
| Cliff Gardens | HX2 7DE |
| College Terrace | HX1 3BX |
| Copley Avenue | HX2 7DJ |
| Crestfield Drive | HX2 7HG |
| Crow Wood Park | HX2 7JZ HX2 7NR |
| Darcey Hey Lane | HX2 7AE HX2 7DD |
| Darnes Avenue | HX2 7DQ |
| Delph Hill | HX2 7EB |
| Delph Hill Castle | HX2 7EH |
| Delph Hill Road | HX2 7EE HX2 7EL |
| Delph Hill Terrace | HX2 7EJ |
| Diamond Terrace | HX2 7DT |
| Dorchester Drive | HX2 7HQ |
| Edwards Road | HX2 7DG |
| Fixby Avenue | HX2 7DH |
| Folly Close | HX2 7AF |
| Gainest | HX2 7DA |
| Green Lane | HX2 7JJ |
| Lime Tree Court | HX6 2PY |
| Marchcroft | HX2 7NX |
| Master Lane | HX2 7EW HX2 7AB |
| Meadow View | HX2 7AJ |
| Norland View | HX2 7EA |
| Octagon Terrace | HX2 7HN |
| Park Drive | HX2 7LA HX2 7NP |
| Park Gardens | HX2 7NW |
| Prospect Avenue | HX2 7HP HX2 7HW |
| Prospect Close | HX2 7HR |
| Pye Nest Avenue | HX2 7HT |
| Pye Nest Drive | HX2 7HH |
| Pye Nest Gardens | HX2 7JU HX2 7JX |
| Pye Nest Grove | HX2 7JY |
| Pye Nest Rise | HX2 7HJ |
| Pye Nest Road | HX2 7HF HX2 7HS HX2 7HE |
| Rochdale Road | HX2 7HA HX2 7HB HX2 7JB HX2 7JT HX2 7NL HX2 7HD |
| Rocks View | HX2 7EF |
| Rose Mount | HX2 7EQ |
| Rose Terrace | HX2 7EG |
| Ryburn View | HX2 7JF |
| Scarr Bottom Road | HX2 7DU HX2 7DZ |
| Skircoat Moor Close | HX3 0JR |
| Skircoat Moor Road | HX3 0GZ HX3 0HA HX1 3JF |
| Spring Edge | HX1 3BB HX1 3BD |
| Stonecliffe | HX3 0HE |
| The Wells | HX2 7JH |
| Throstle Bank | HX2 7DB |
| Tower Gardens | HX2 7EN |
| Upper Washer Lane | HX2 7DR |
| Victoria Terrace | HX2 7ED |
| Wakefield Gate | HX3 0HB HX3 0NQ |
| Washer Lane | HX2 7DN HX2 7DW HX2 7DX HX2 7AH |
| Willow Close | HX2 7NQ |
| Willow Dene Avenue | HX2 7NN |
| Willow Drive | HX2 7NG |
| Willowfield Avenue | HX2 7JS HX2 7NJ |
| Willowfield Close | HX2 7LP |
| Willowfield Crescent | HX2 7JP HX2 7JW |
| Willowfield Drive | HX2 7NH |
| Willowfield Road | HX2 7JN HX2 7NF |
| Willowfield Terrace | HX2 7JL |
| Wood View | HX3 0HH |
| Woodcroft Grange | HX2 7LQ |
| Woodlands Drive | HX2 7JR |
| HX2 7LB HX2 7LN HX3 0HQ HX3 0TD |
Transport near Sowerby Bridge
- FAQ
- Price Paid By Year
- Property Type Price
Frequently asked questions about Sowerby Bridge
What is the average price for a property for sale in Sowerby Bridge?
The average price for a property for sale in Sowerby Bridge is £219,711. This amount is 14% higher than the average price in Halifax. There are 656 property listings for sale in Sowerby Bridge.
What streets have the most expensive properties for sale in Sowerby Bridge?
The streets with the most expensive properties for sale in Sowerby Bridge are Marchcroft at an average of £595,000, Wakefield Gate at an average of £378,666 and Green Lane at an average of £344,100.
What streets have the most affordable properties for sale in Sowerby Bridge?
The streets with the most affordable properties for sale in Sowerby Bridge are Willowfield Crescent at an average of £114,998, Diamond Terrace at an average of £115,000 and Skircoat Moor Road at an average of £127,166.
Which train stations are available in or near Sowerby Bridge?
Some of the train stations available in or near Sowerby Bridge are Sowerby Bridge, Halifax and Mytholmroyd.
Property Price Paid in Sowerby Bridge by Year
The average sold property price by year was:
| Year | Average Sold Price | Price Change |
Sold Properties
|
|---|---|---|---|
| 2025 | £251,300 | 16% |
50 Properties |
| 2024 | £210,956 | 3% |
65 Properties |
| 2023 | £203,925 | -2% |
64 Properties |
| 2022 | £207,436 | 3% |
78 Properties |
| 2021 | £200,597 | 19% |
90 Properties |
| 2020 | £162,449 | -9% |
65 Properties |
| 2019 | £177,101 | -2% |
61 Properties |
| 2018 | £181,084 | 21% |
76 Properties |
| 2017 | £143,681 | -15% |
69 Properties |
| 2016 | £164,685 | 3% |
92 Properties |
| 2015 | £159,605 | 3% |
70 Properties |
| 2014 | £154,603 | -5% |
68 Properties |
| 2013 | £162,557 | 4% |
63 Properties |
| 2012 | £155,442 | 12% |
56 Properties |
| 2011 | £136,681 | -1% |
51 Properties |
| 2010 | £137,842 | 4% |
47 Properties |
| 2009 | £132,683 | -18% |
57 Properties |
| 2008 | £156,174 | -1% |
49 Properties |
| 2007 | £157,731 | 16% |
86 Properties |
| 2006 | £132,424 | -2% |
88 Properties |
| 2005 | £134,717 | 20% |
84 Properties |
| 2004 | £108,385 | 9% |
75 Properties |
| 2003 | £98,850 | 28% |
62 Properties |
| 2002 | £71,274 | 22% |
98 Properties |
| 2001 | £55,381 | 3% |
75 Properties |
| 2000 | £53,814 | -1% |
88 Properties |
| 1999 | £54,345 | 1% |
64 Properties |
| 1998 | £53,657 | 6% |
64 Properties |
| 1997 | £50,508 | 2% |
72 Properties |
| 1996 | £49,267 | 3% |
56 Properties |
| 1995 | £47,712 | - |
65 Properties |
Property Price per Property Type in Sowerby Bridge
Here you can find historic sold price data in order to help with your property search.
The average Property Paid Price for specific property types in the last three years are:
| Property Type | Average Sold Price | Sold Properties |
|---|---|---|
| Semi Detached House | £215,175.00 | 79 Semi Detached Houses |
| Detached House | £478,805.00 | 18 Detached Houses |
| Terraced House | £165,547.00 | 64 Terraced Houses |
| Flat | £173,110.00 | 18 Flats |

