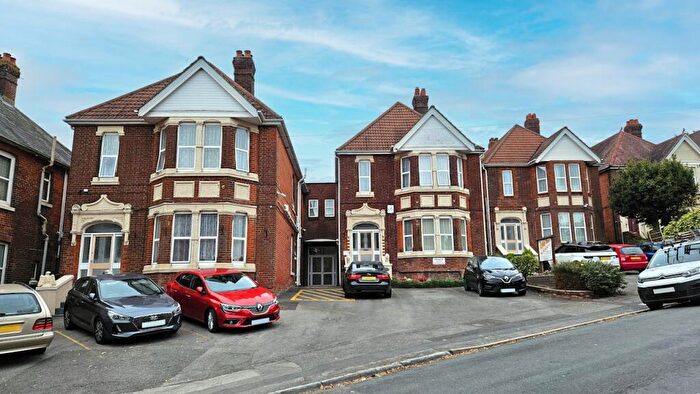
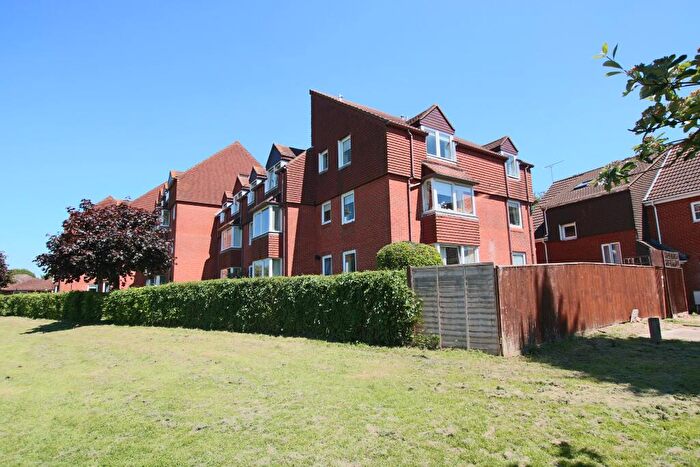
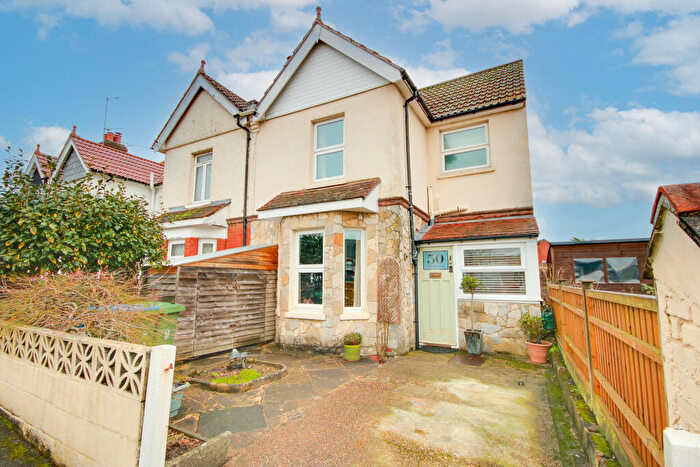
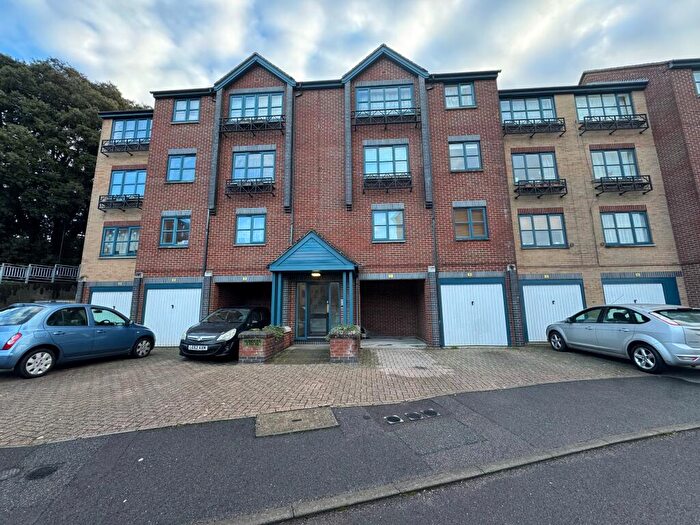
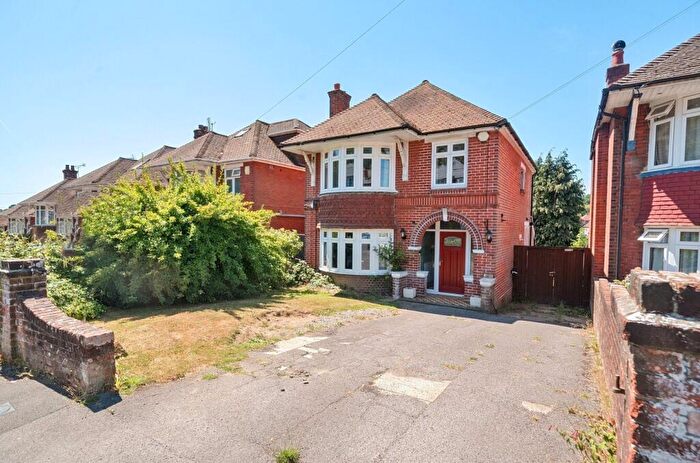
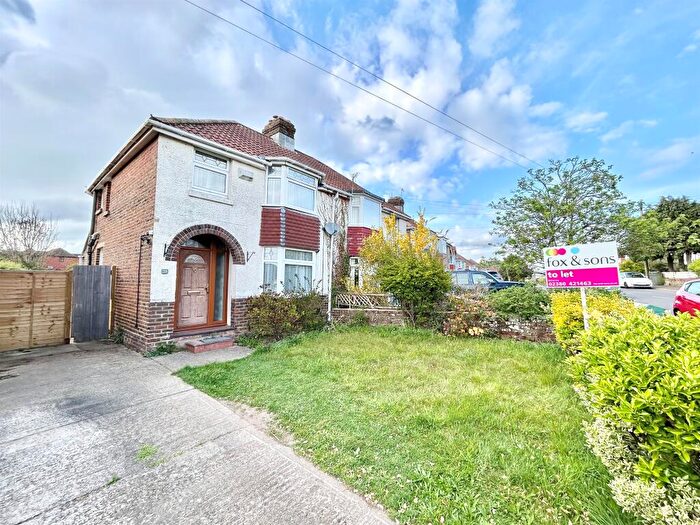
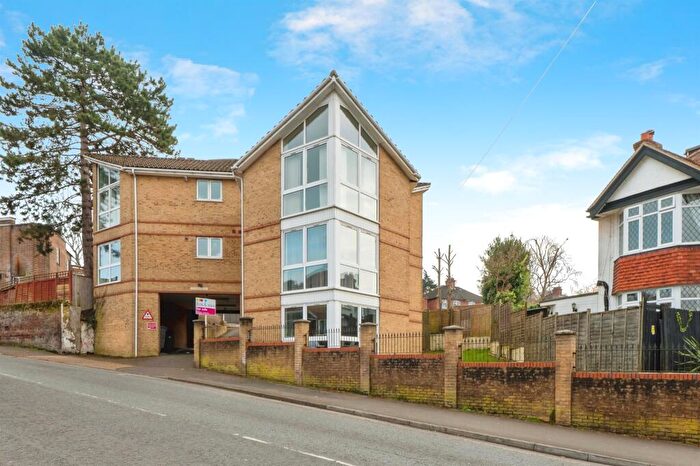
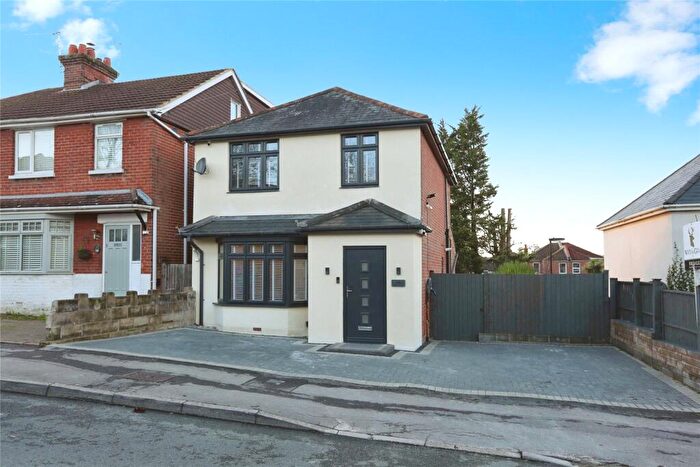
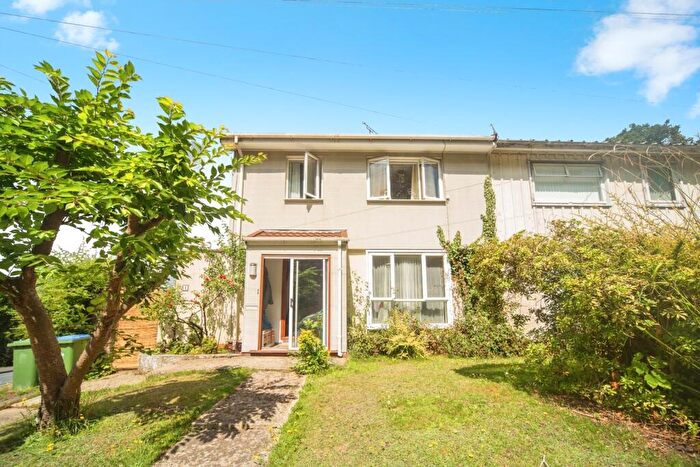
Houses for sale & to rent in Bitterne Park, Southampton
House Prices in Bitterne Park
Properties in Bitterne Park have an average house price of £268,153.00 and had 829 Property Transactions within the last 3 years¹.
Bitterne Park is an area in Southampton, City of Southampton with 6,106 households², where the most expensive property was sold for £930,000.00.
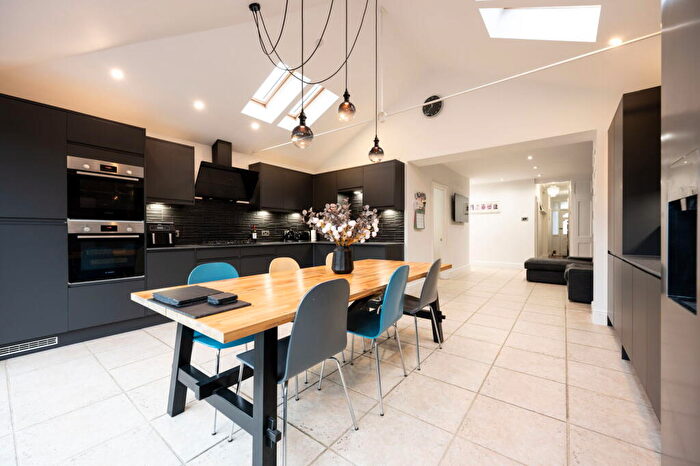
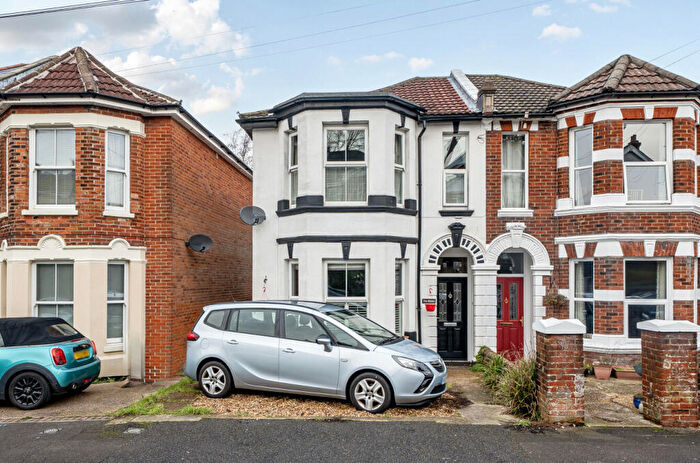
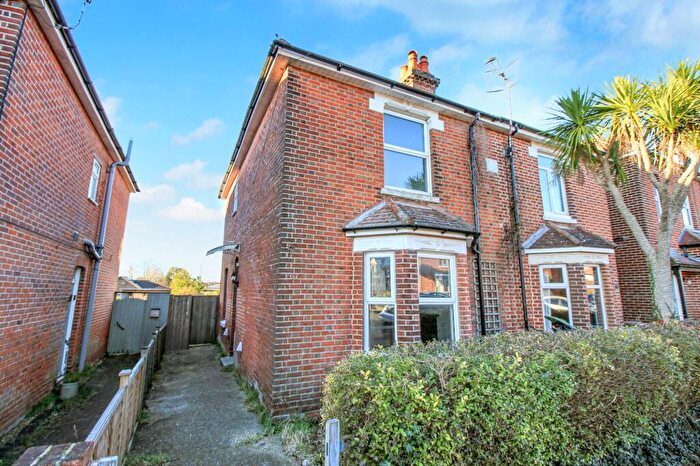
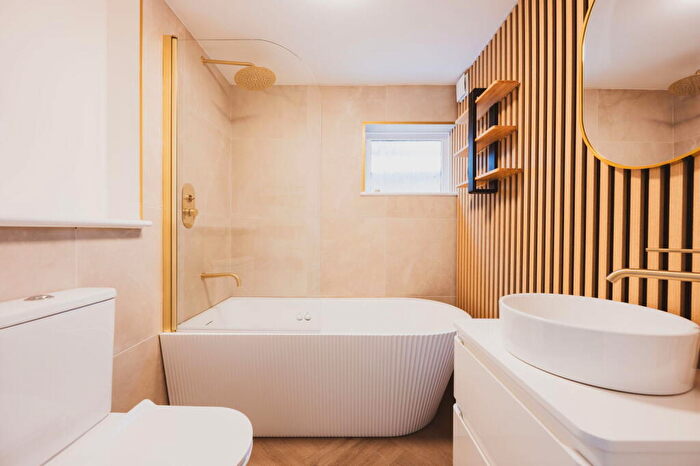
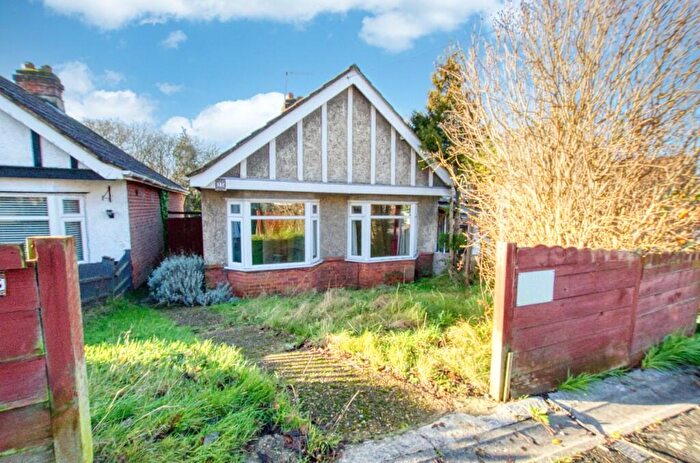
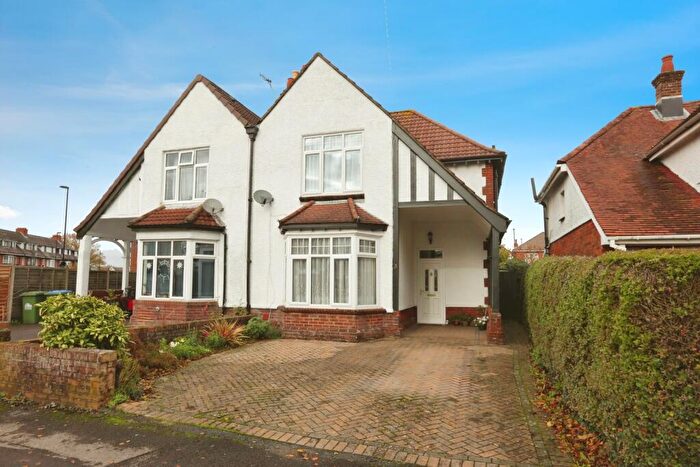
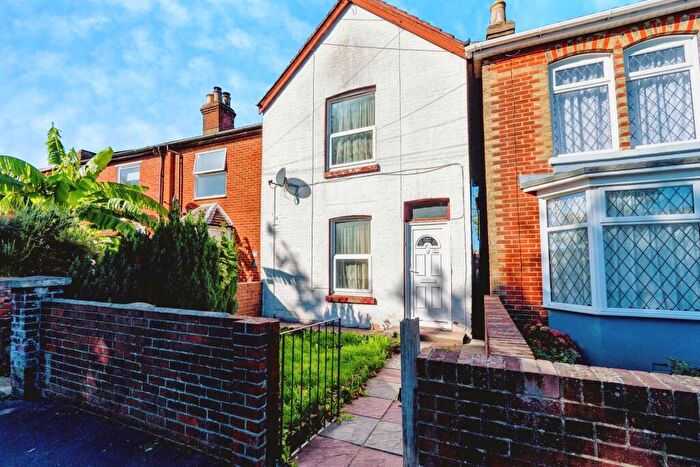
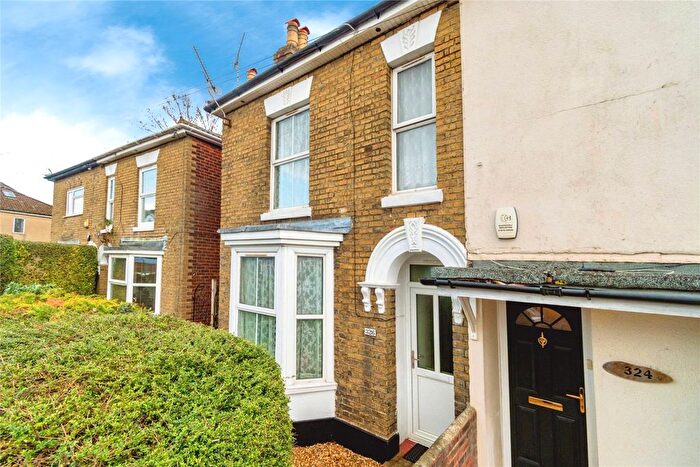
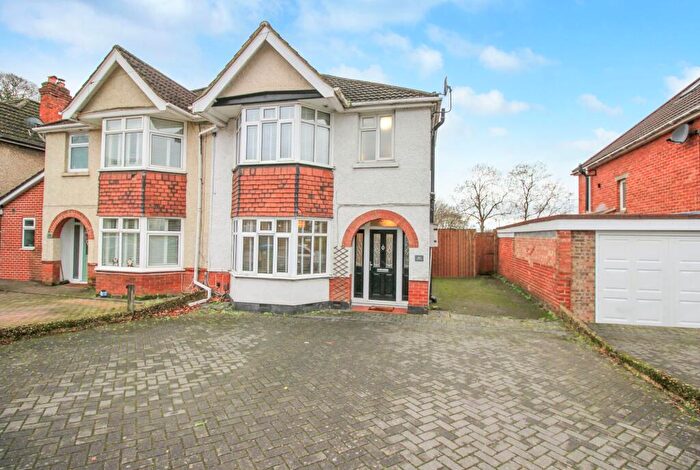
Properties for sale in Bitterne Park
Roads and Postcodes in Bitterne Park
Navigate through our locations to find the location of your next house in Bitterne Park, Southampton for sale or to rent.
Transport near Bitterne Park
-
Bitterne Station
-
St.Denys Station
-
Swaythling Station
-
Woolston Station
-
Southampton Airport (Parkway) Station
-
Sholing Station
-
Southampton Central Station
-
Millbrook (Hampshire) Station
- FAQ
- Price Paid By Year
- Property Type Price
Frequently asked questions about Bitterne Park
What is the average price for a property for sale in Bitterne Park?
The average price for a property for sale in Bitterne Park is £268,153. This amount is 4% higher than the average price in Southampton. There are 2,119 property listings for sale in Bitterne Park.
What streets have the most expensive properties for sale in Bitterne Park?
The streets with the most expensive properties for sale in Bitterne Park are Hill Cottage Gardens at an average of £509,000, River Walk at an average of £505,000 and Parklands at an average of £438,000.
What streets have the most affordable properties for sale in Bitterne Park?
The streets with the most affordable properties for sale in Bitterne Park are Beech Avenue at an average of £84,666, Midanbury Broadway at an average of £112,500 and Neva Road at an average of £145,750.
Which train stations are available in or near Bitterne Park?
Some of the train stations available in or near Bitterne Park are Bitterne, St.Denys and Swaythling.
Property Price Paid in Bitterne Park by Year
The average sold property price by year was:
| Year | Average Sold Price | Price Change |
Sold Properties
|
|---|---|---|---|
| 2025 | £274,381 | 6% |
119 Properties |
| 2024 | £258,320 | -2% |
237 Properties |
| 2023 | £262,463 | -6% |
212 Properties |
| 2022 | £278,864 | 7% |
261 Properties |
| 2021 | £259,047 | 7% |
263 Properties |
| 2020 | £240,482 | -21% |
202 Properties |
| 2019 | £290,591 | 22% |
327 Properties |
| 2018 | £227,958 | 2% |
243 Properties |
| 2017 | £223,991 | 4% |
256 Properties |
| 2016 | £215,396 | 7% |
261 Properties |
| 2015 | £200,812 | 8% |
270 Properties |
| 2014 | £183,994 | -4% |
280 Properties |
| 2013 | £191,726 | 10% |
225 Properties |
| 2012 | £173,010 | -9% |
170 Properties |
| 2011 | £189,103 | 6% |
161 Properties |
| 2010 | £178,581 | 13% |
149 Properties |
| 2009 | £154,522 | -12% |
219 Properties |
| 2008 | £173,093 | -3% |
192 Properties |
| 2007 | £179,019 | 9% |
322 Properties |
| 2006 | £163,645 | 5% |
361 Properties |
| 2005 | £155,890 | -2% |
278 Properties |
| 2004 | £159,624 | 9% |
398 Properties |
| 2003 | £144,555 | 15% |
334 Properties |
| 2002 | £122,752 | 16% |
440 Properties |
| 2001 | £102,561 | 16% |
378 Properties |
| 2000 | £85,799 | 23% |
330 Properties |
| 1999 | £65,932 | 3% |
402 Properties |
| 1998 | £64,258 | 9% |
342 Properties |
| 1997 | £58,621 | 13% |
383 Properties |
| 1996 | £51,226 | -3% |
281 Properties |
| 1995 | £52,837 | - |
253 Properties |
Property Price per Property Type in Bitterne Park
Here you can find historic sold price data in order to help with your property search.
The average Property Paid Price for specific property types in the last three years are:
| Property Type | Average Sold Price | Sold Properties |
|---|---|---|
| Flat | £161,077.00 | 326 Flats |
| Semi Detached House | £318,707.00 | 238 Semi Detached Houses |
| Detached House | £371,264.00 | 207 Detached Houses |
| Terraced House | £294,547.00 | 58 Terraced Houses |

