
Houses for sale & to rent in Freemantle, Southampton
House Prices in Freemantle
Properties in Freemantle have an average house price of £241,707.00 and had 915 Property Transactions within the last 3 years¹.
Freemantle is an area in Southampton, City of Southampton with 7,343 households², where the most expensive property was sold for £2,450,000.00.
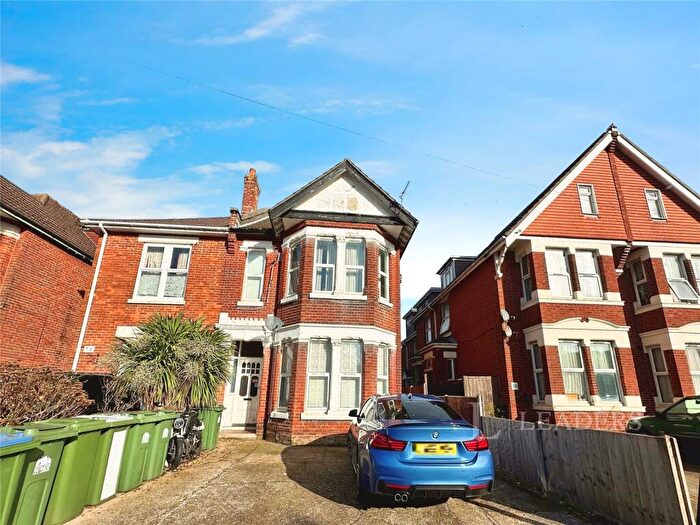
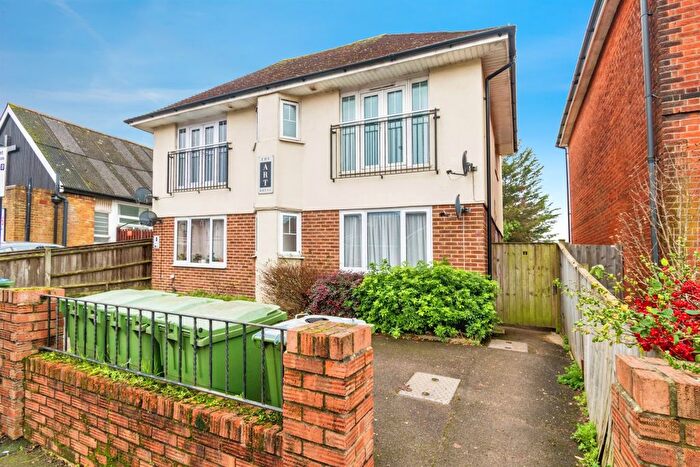
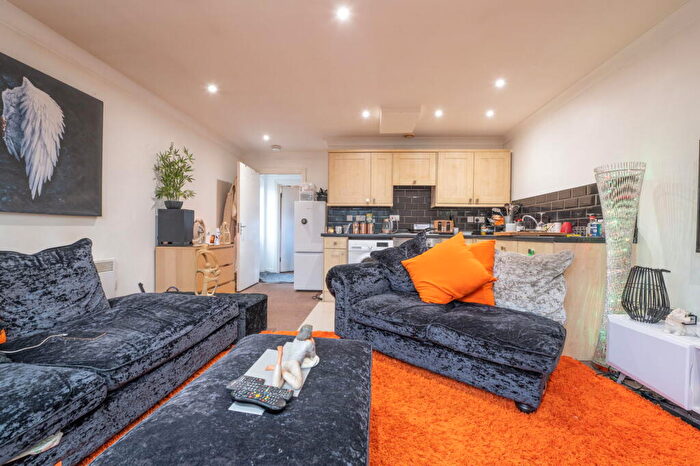
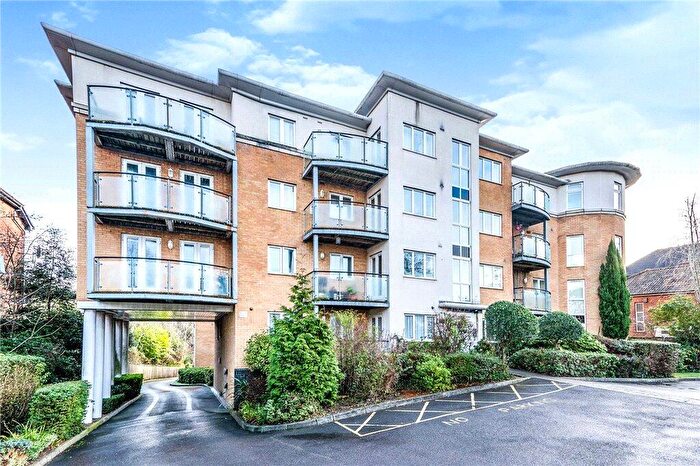
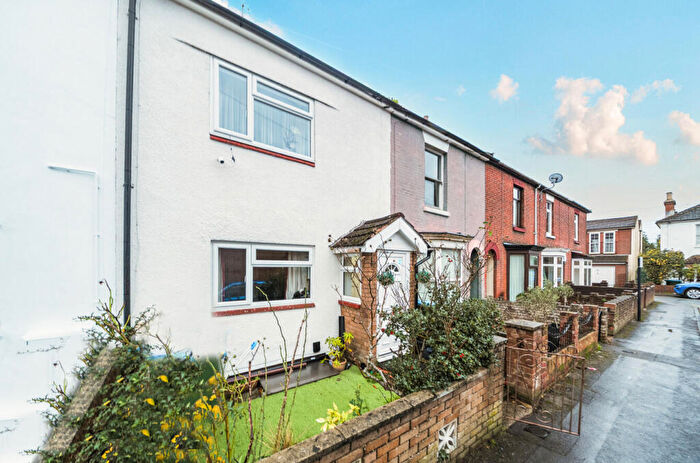
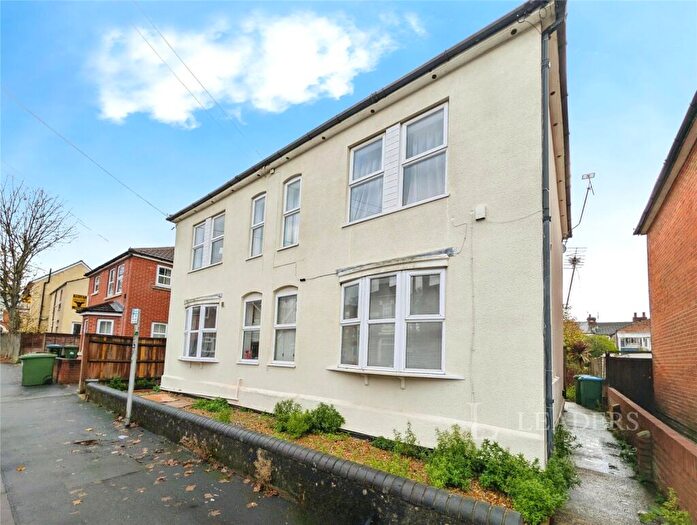
Properties for sale in Freemantle

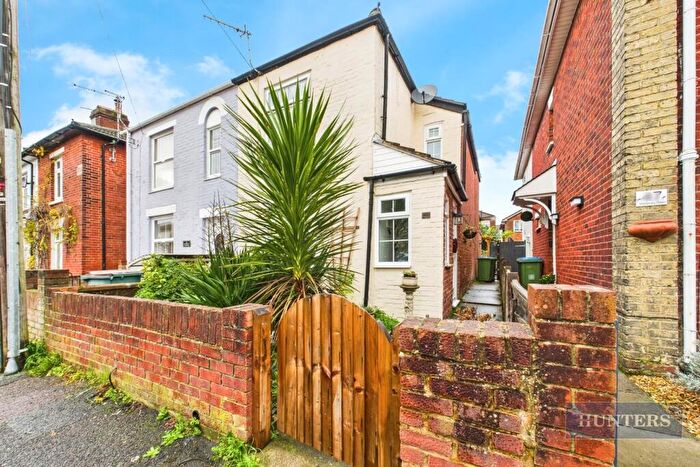
![]()
If you are looking to sell your house, let it out, or receive a property valuation, an expert can help you.
Click the button below to get started.


Roads and Postcodes in Freemantle
Navigate through our locations to find the location of your next house in Freemantle, Southampton for sale or to rent.
Transport near Freemantle
-
 Southampton Central Station
 -
Millbrook (Hampshire) Station
-
St.Denys Station
-
Bitterne Station
-
Woolston Station
-
Redbridge Station
-
Swaythling Station
-
Totton Station
-
Sholing Station
- FAQ
- Price Paid By Year
- Property Type Price
Frequently asked questions about Freemantle
What is the average price for a property for sale in Freemantle?
The average price for a property for sale in Freemantle is £241,707. This amount is 7% lower than the average price in Southampton. There are 2,506 property listings for sale in Freemantle.
What streets have the most expensive properties for sale in Freemantle?
The streets with the most expensive properties for sale in Freemantle are Court Royal Mews at an average of £521,686, Hill Farm Road at an average of £520,000 and Greville Road at an average of £485,000.
What streets have the most affordable properties for sale in Freemantle?
The streets with the most affordable properties for sale in Freemantle are Cawte Road at an average of £141,250, Lindoe Close at an average of £148,181 and Almond Road at an average of £150,416.
Which train stations are available in or near Freemantle?
Some of the train stations available in or near Freemantle are Southampton Central, Millbrook (Hampshire) and St.Denys.
Property Price Paid in Freemantle by Year
The average sold property price by year was:
| Year | Average Sold Price | Price Change |
Sold Properties
|
|---|---|---|---|
| 2025 | £248,148 | 3% |
145 Properties |
| 2024 | £239,598 | 6% |
220 Properties |
| 2023 | £224,300 | -14% |
258 Properties |
| 2022 | £255,479 | 14% |
292 Properties |
| 2021 | £220,868 | 3% |
329 Properties |
| 2020 | £214,452 | -19% |
211 Properties |
| 2019 | £255,556 | 14% |
236 Properties |
| 2018 | £219,621 | 4% |
258 Properties |
| 2017 | £210,410 | 11% |
360 Properties |
| 2016 | £186,439 | -4% |
460 Properties |
| 2015 | £193,570 | 12% |
405 Properties |
| 2014 | £170,856 | 8% |
374 Properties |
| 2013 | £157,778 | -9% |
257 Properties |
| 2012 | £172,666 | -4% |
226 Properties |
| 2011 | £178,878 | 1% |
189 Properties |
| 2010 | £177,154 | 7% |
230 Properties |
| 2009 | £164,560 | -3% |
245 Properties |
| 2008 | £169,768 | -3% |
314 Properties |
| 2007 | £174,683 | 4% |
509 Properties |
| 2006 | £167,071 | 4% |
578 Properties |
| 2005 | £160,890 | 1% |
470 Properties |
| 2004 | £159,995 | 3% |
478 Properties |
| 2003 | £154,592 | 13% |
543 Properties |
| 2002 | £134,177 | 28% |
640 Properties |
| 2001 | £96,814 | 12% |
508 Properties |
| 2000 | £85,089 | 13% |
531 Properties |
| 1999 | £74,312 | 14% |
580 Properties |
| 1998 | £63,601 | 15% |
484 Properties |
| 1997 | £54,216 | 3% |
517 Properties |
| 1996 | £52,623 | 2% |
376 Properties |
| 1995 | £51,546 | - |
352 Properties |
Property Price per Property Type in Freemantle
Here you can find historic sold price data in order to help with your property search.
The average Property Paid Price for specific property types in the last three years are:
| Property Type | Average Sold Price | Sold Properties |
|---|---|---|
| Semi Detached House | £326,833.00 | 190 Semi Detached Houses |
| Detached House | £468,451.00 | 44 Detached Houses |
| Terraced House | £293,502.00 | 204 Terraced Houses |
| Flat | £164,733.00 | 477 Flats |