
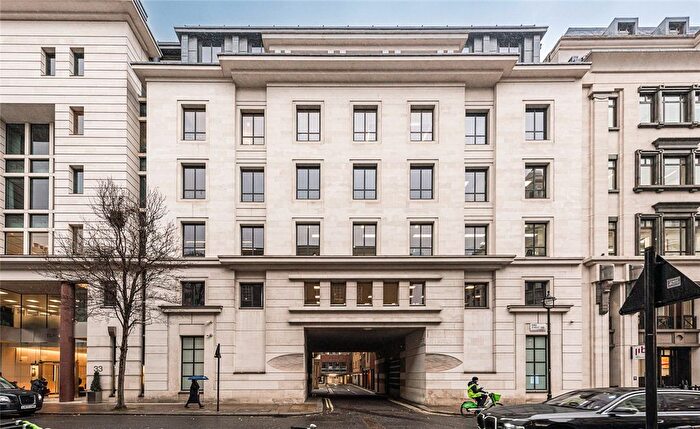
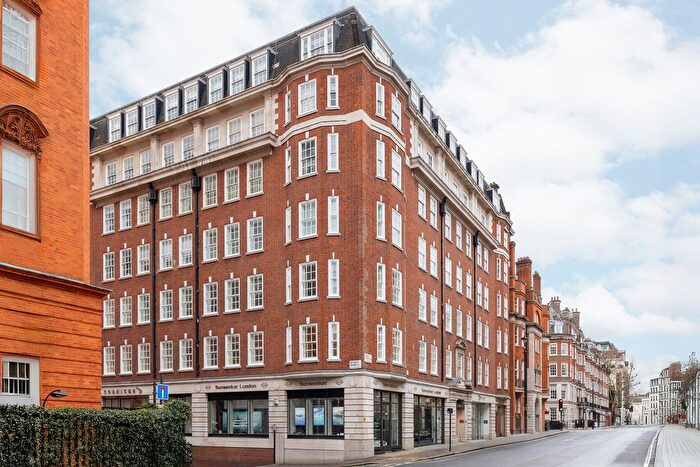
Houses for sale & to rent in West End, London
House Prices in West End
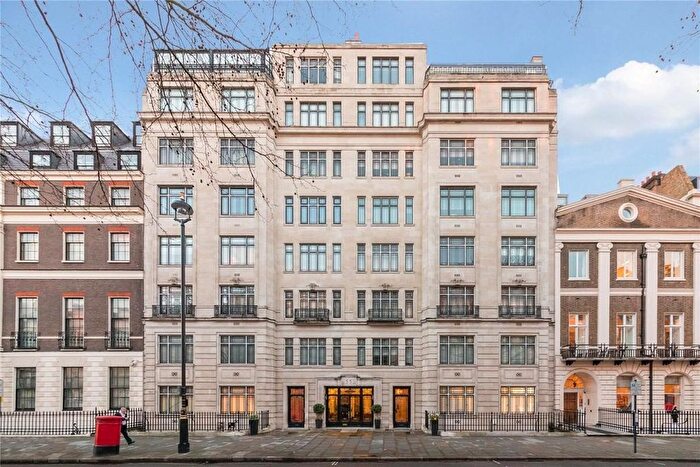
Properties in this part of West End within London have an average house price of £4,140,211.00 and had 713 Property Transactions within the last 3 years¹. This area has 5,827 households² , where the most expensive property was sold for £82,000,000.00.
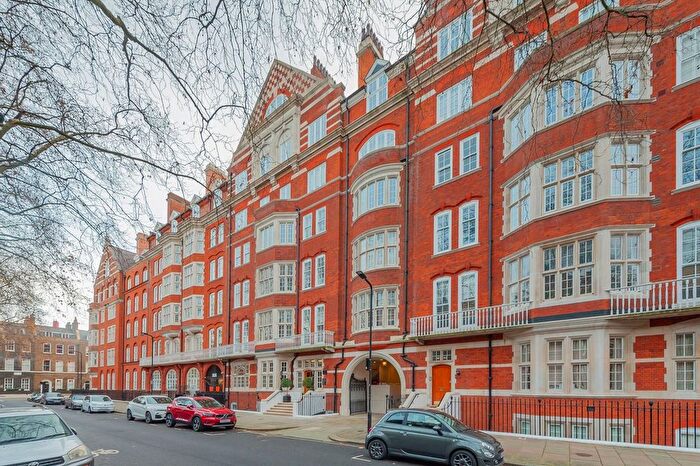
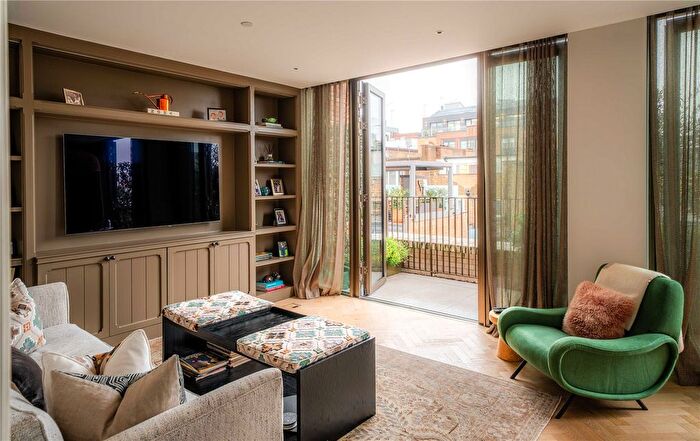
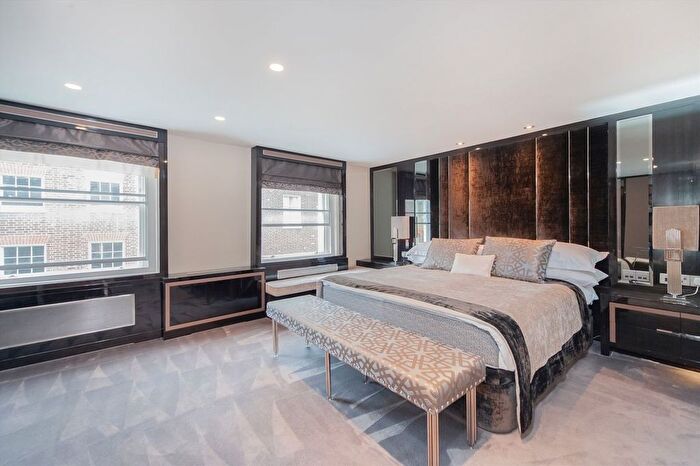
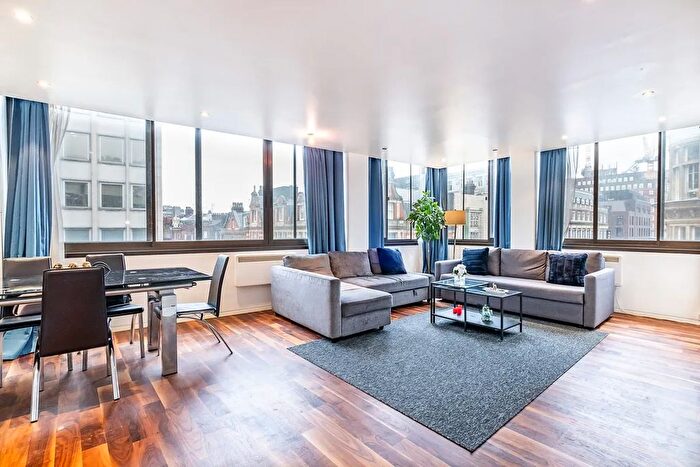
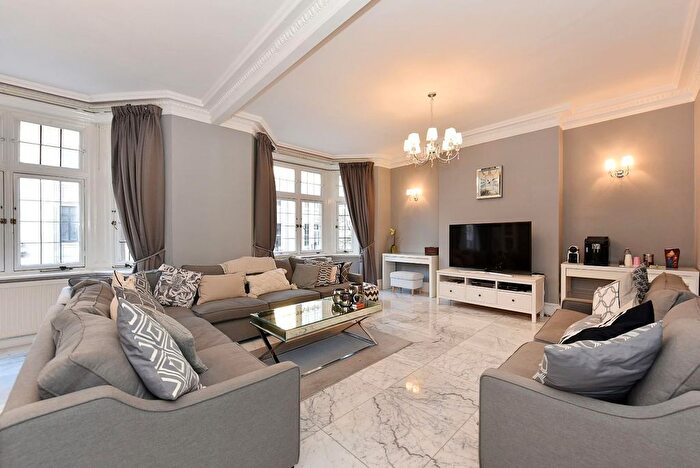
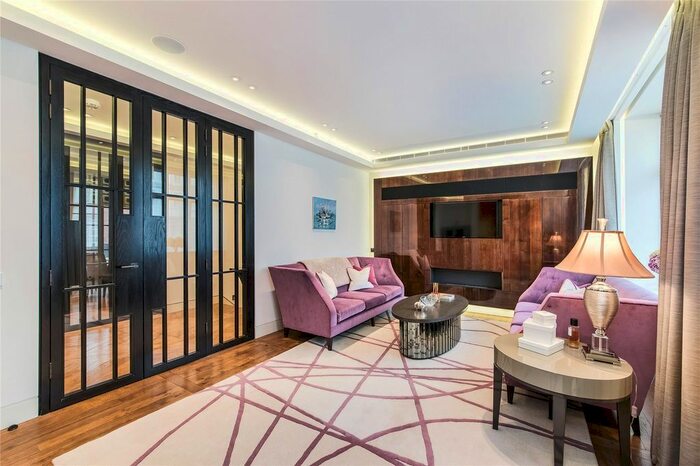
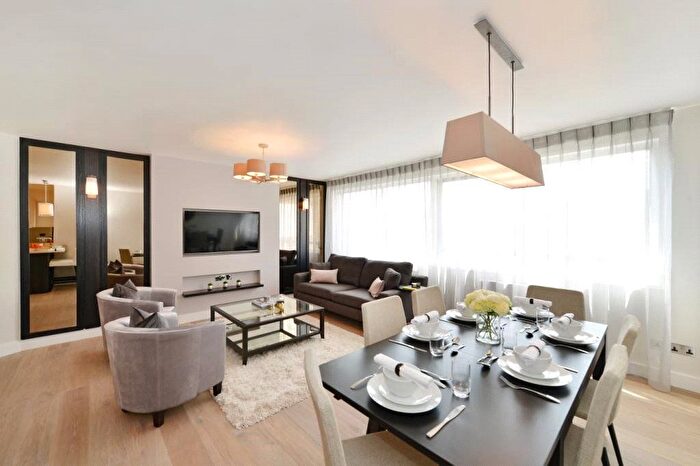
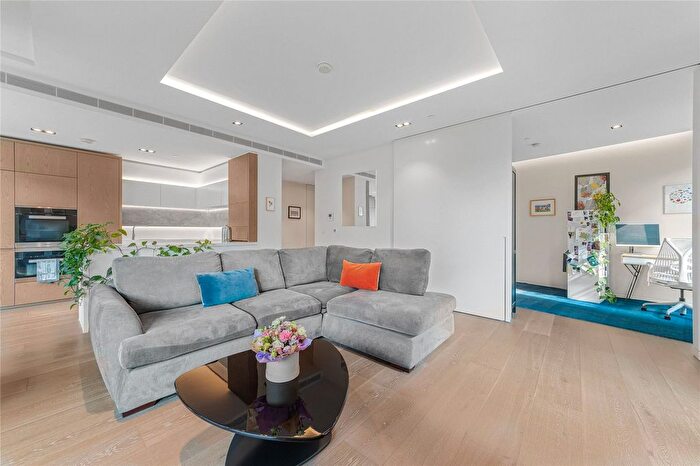
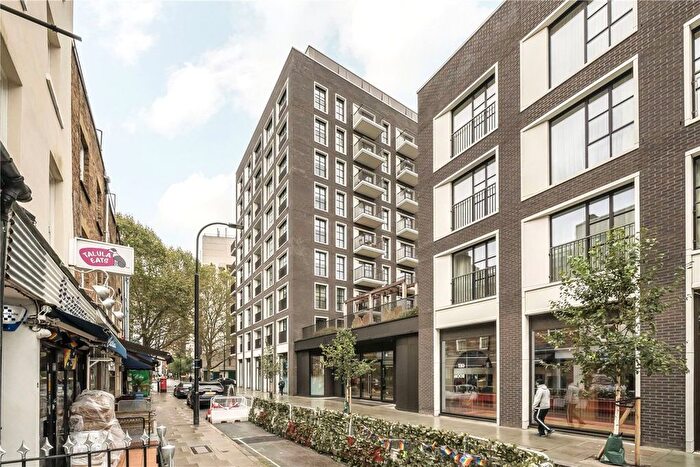
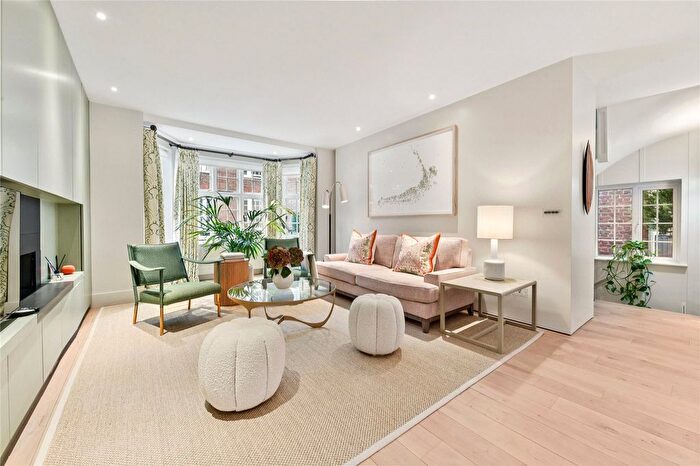
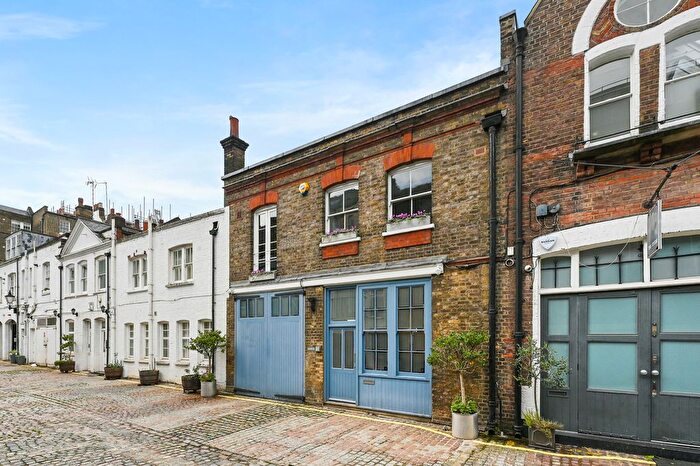
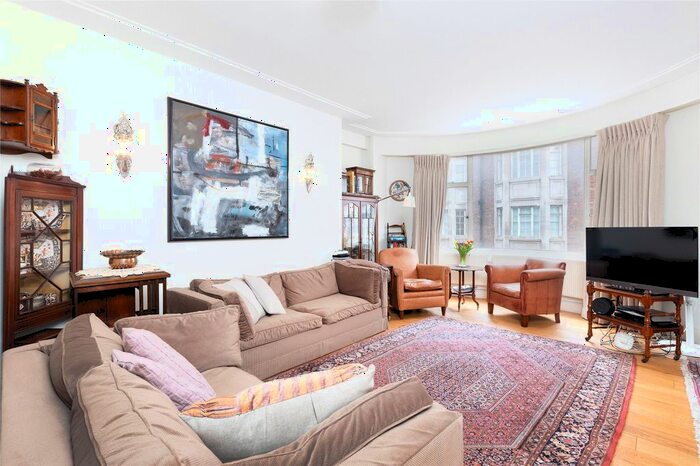
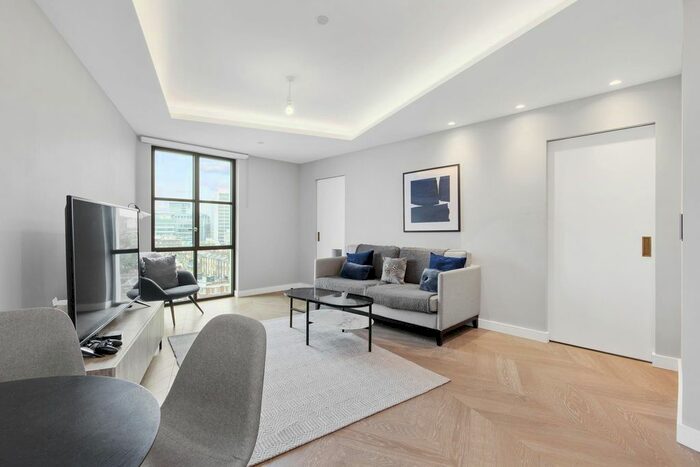
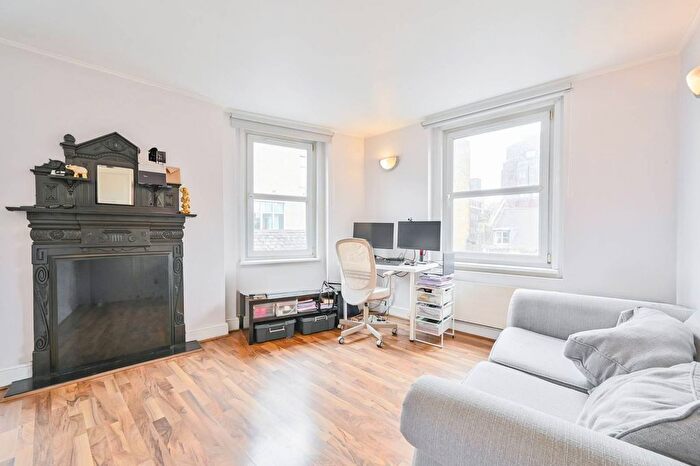
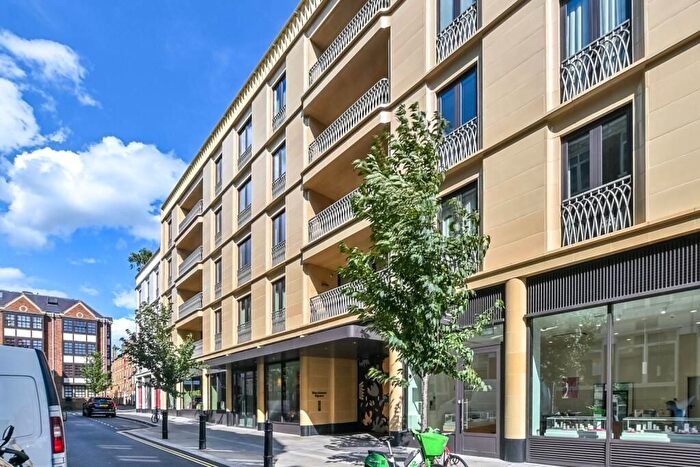
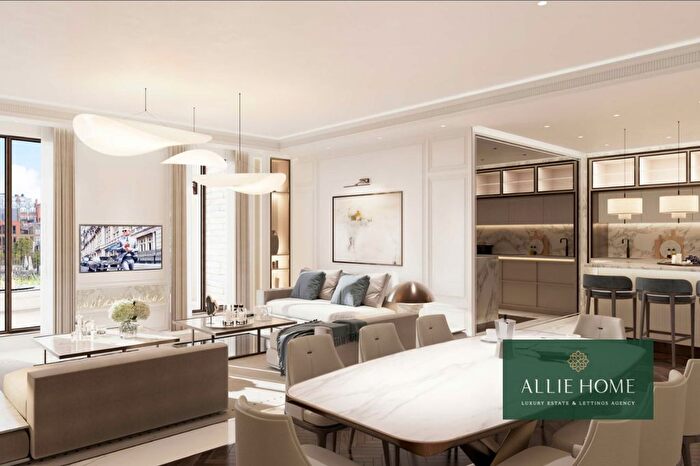
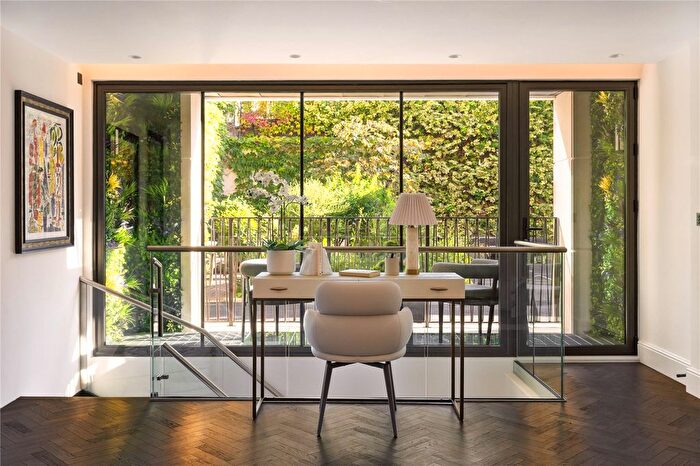
Properties for sale in West End
![]()
If you are looking to sell your house, let it out, or receive a property valuation, an expert can help you.
Click the button below to get started.


Roads and Postcodes in West End
Navigate through our locations to find the location of your next house in West End, London for sale or to rent.
Transport near West End
-
 Oxford Circus Station
 -
 Bond Street Station
 -
Piccadilly Circus Station
-
Green Park Station
-
Tottenham Court Road Station
-
Leicester Square Station
-
Goodge Street Station
-
Marble Arch Station
-
Covent Garden Station
-
Great Portland Street Station
- FAQ
- Price Paid By Year
- Property Type Price
Frequently asked questions about West End
What is the average price for a property for sale in West End?
The average price for a property for sale in West End is £4,140,211. This amount is 120% higher than the average price in London. There are 5,471 property listings for sale in West End.
What streets have the most expensive properties for sale in West End?
The streets with the most expensive properties for sale in West End are New Bond Street at an average of £82,000,000, Ashburton Place at an average of £20,845,149 and Old Park Lane at an average of £18,250,000.
What streets have the most affordable properties for sale in West End?
The streets with the most affordable properties for sale in West End are Lexington Street at an average of £420,000, Candover Street at an average of £425,000 and Rupert Street at an average of £435,000.
Which tube stations are available in or near West End?
Some of the tube stations available in or near West End are Oxford Circus, Bond Street and Piccadilly Circus.
Property Price Paid in West End by Year
The average sold property price by year was:
| Year | Average Sold Price | Price Change |
Sold Properties
|
|---|---|---|---|
| 2025 | £2,068,326 | -134% |
57 Properties |
| 2024 | £4,830,582 | 23% |
192 Properties |
| 2023 | £3,703,428 | -23% |
241 Properties |
| 2022 | £4,547,434 | 17% |
223 Properties |
| 2021 | £3,792,505 | -51% |
176 Properties |
| 2020 | £5,733,000 | 4% |
176 Properties |
| 2019 | £5,493,937 | 40% |
182 Properties |
| 2018 | £3,287,463 | 3% |
328 Properties |
| 2017 | £3,178,940 | 21% |
226 Properties |
| 2016 | £2,499,097 | -1% |
429 Properties |
| 2015 | £2,534,250 | 6% |
279 Properties |
| 2014 | £2,379,742 | 5% |
199 Properties |
| 2013 | £2,267,753 | 20% |
195 Properties |
| 2012 | £1,810,007 | 18% |
152 Properties |
| 2011 | £1,478,249 | 27% |
159 Properties |
| 2010 | £1,071,859 | 6% |
221 Properties |
| 2009 | £1,011,860 | 0,3% |
142 Properties |
| 2008 | £1,008,512 | 5% |
135 Properties |
| 2007 | £953,960 | 17% |
286 Properties |
| 2006 | £793,442 | 13% |
316 Properties |
| 2005 | £694,111 | -6% |
236 Properties |
| 2004 | £735,572 | -1% |
274 Properties |
| 2003 | £744,649 | 23% |
279 Properties |
| 2002 | £570,680 | -5% |
341 Properties |
| 2001 | £601,476 | 9% |
379 Properties |
| 2000 | £547,111 | 23% |
465 Properties |
| 1999 | £421,284 | -18% |
384 Properties |
| 1998 | £496,135 | 30% |
344 Properties |
| 1997 | £345,494 | 22% |
338 Properties |
| 1996 | £268,922 | 0,4% |
195 Properties |
| 1995 | £267,724 | - |
240 Properties |
Property Price per Property Type in West End
Here you can find historic sold price data in order to help with your property search.
The average Property Paid Price for specific property types in the last three years are:
| Property Type | Average Sold Price | Sold Properties |
|---|---|---|
| Terraced House | £8,358,392.00 | 51 Terraced Houses |
| Flat | £3,757,017.00 | 658 Flats |
| Semi Detached House | £7,100,000.00 | 2 Semi Detached Houses |
| Detached House | £19,687,700.00 | 2 Detached Houses |