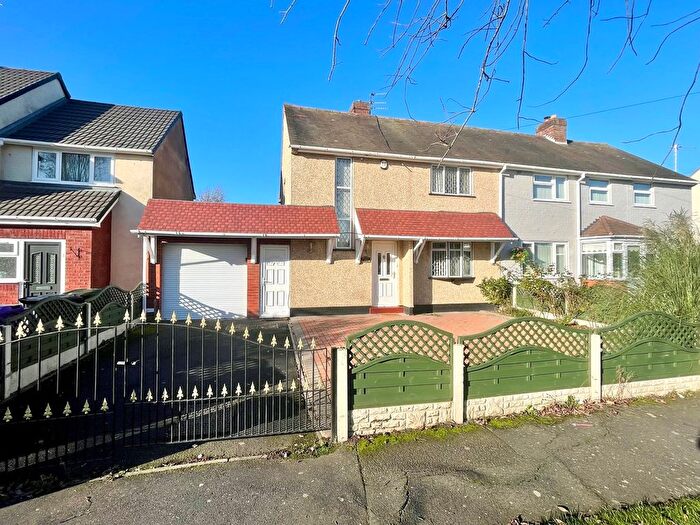
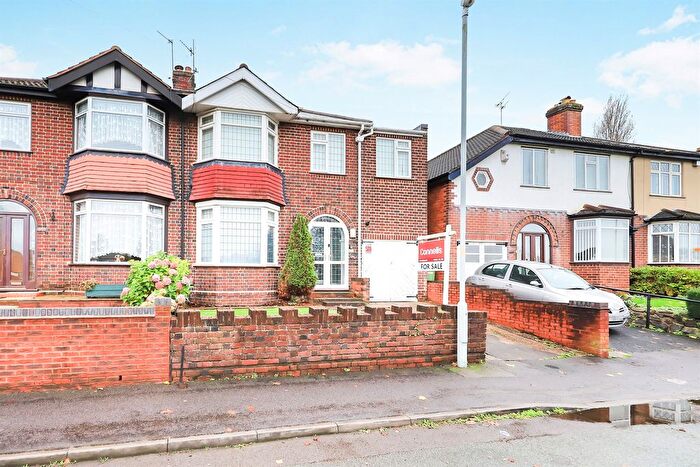
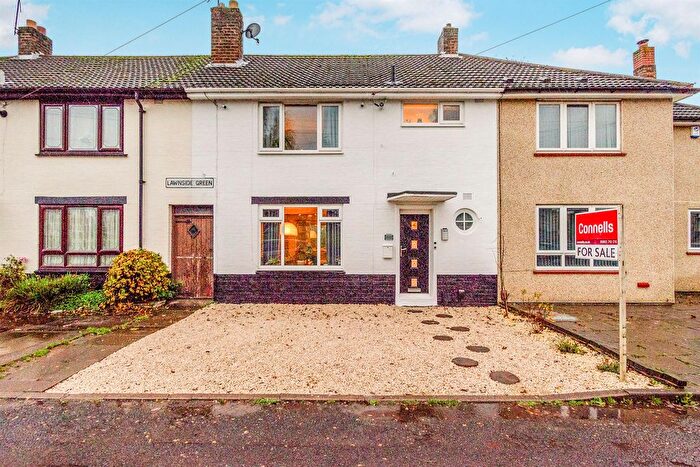
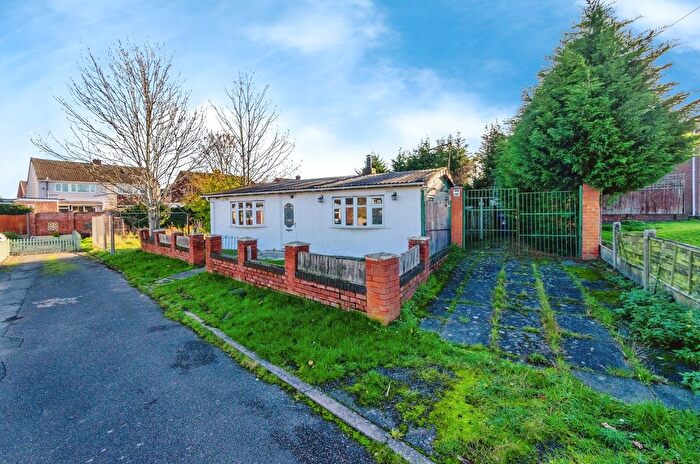
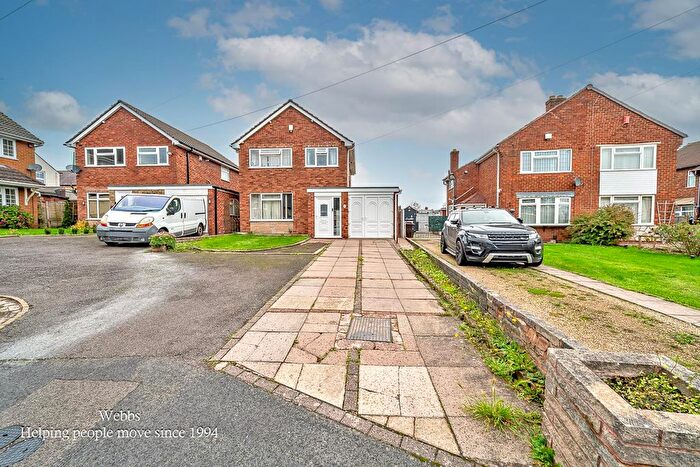
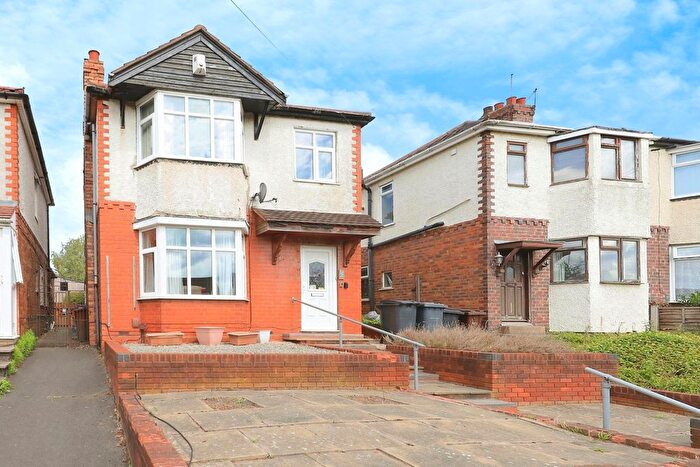
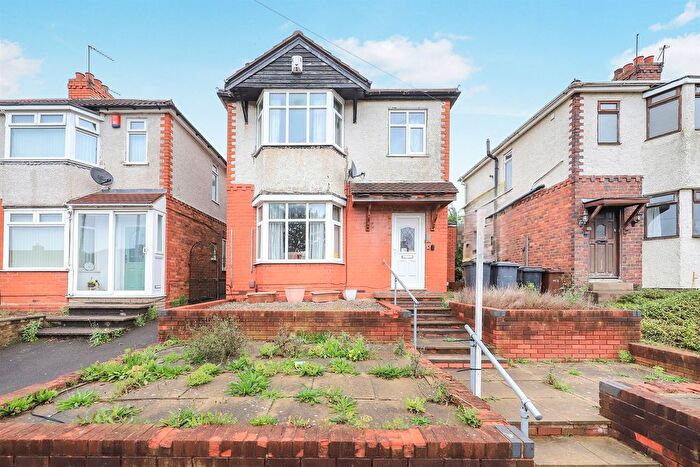
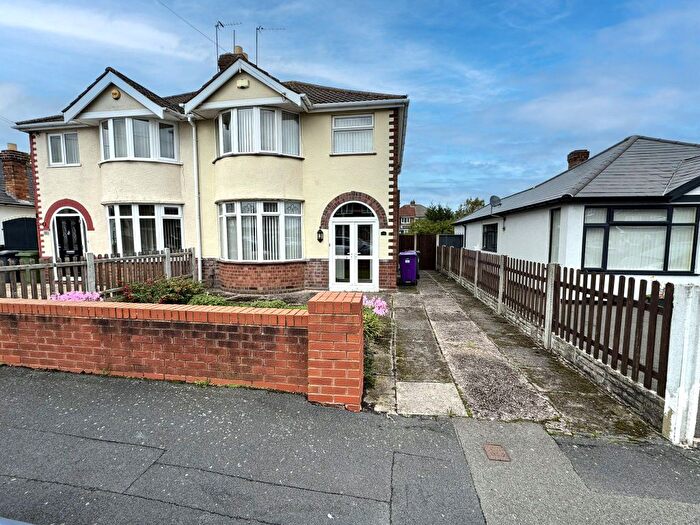
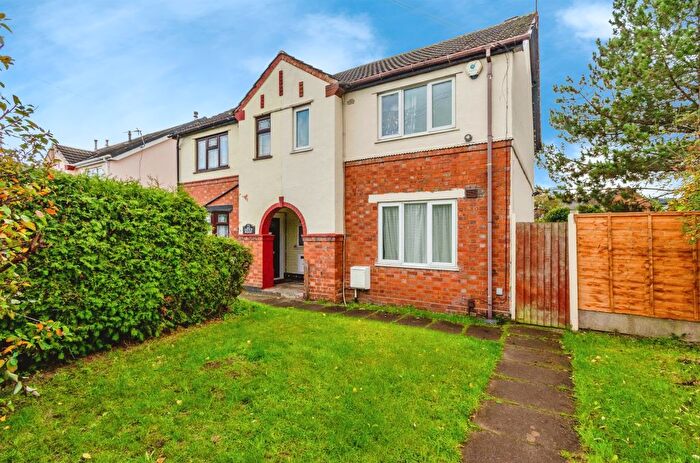
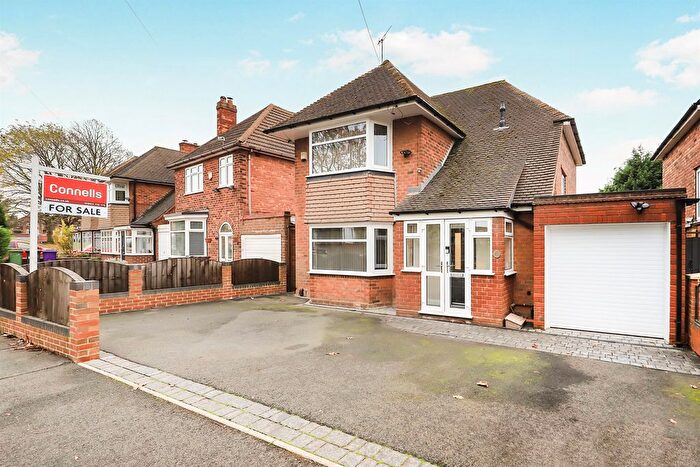
Houses for sale & to rent in East Park, Willenhall
House Prices in East Park
Properties in East Park have an average house price of £188,500.00 and had 61 Property Transactions within the last 3 years¹.
East Park is an area in Willenhall, City of Wolverhampton with 1,061 households², where the most expensive property was sold for £316,000.00.
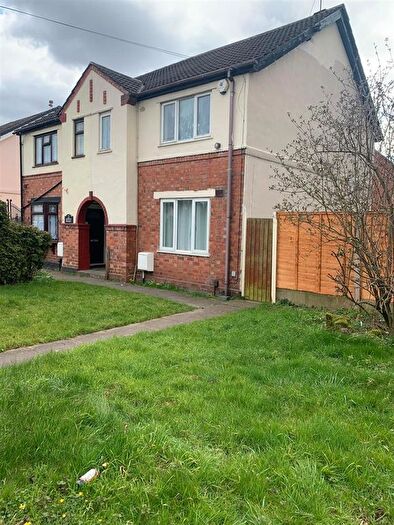
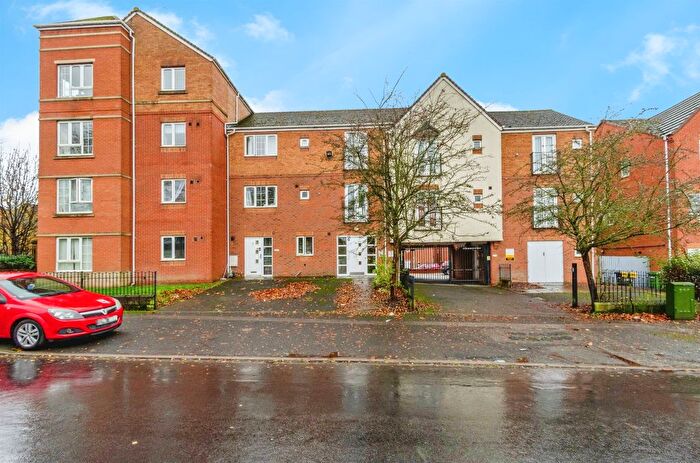
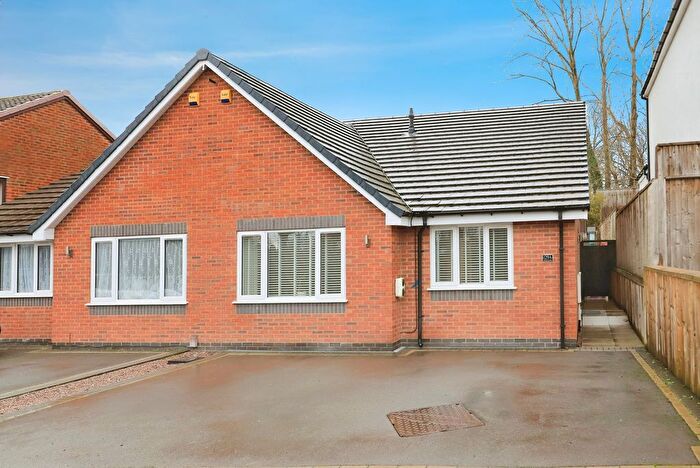
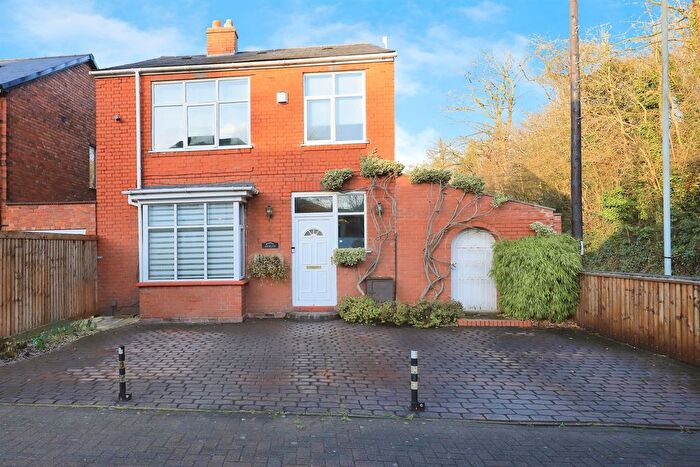
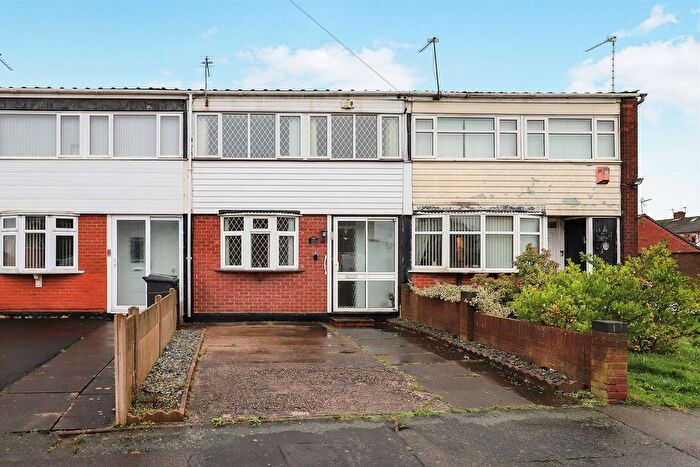
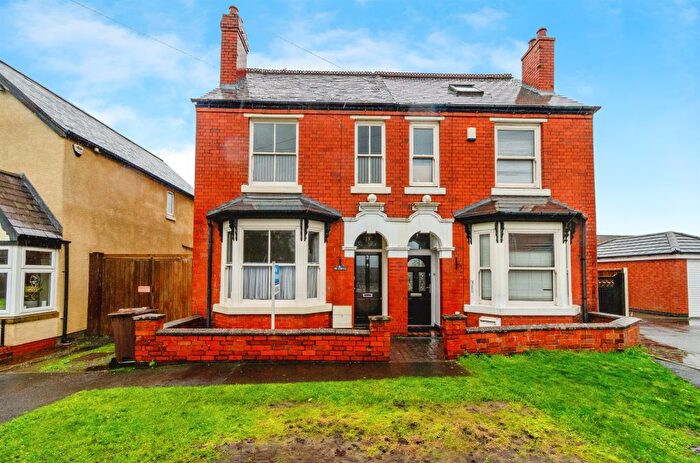
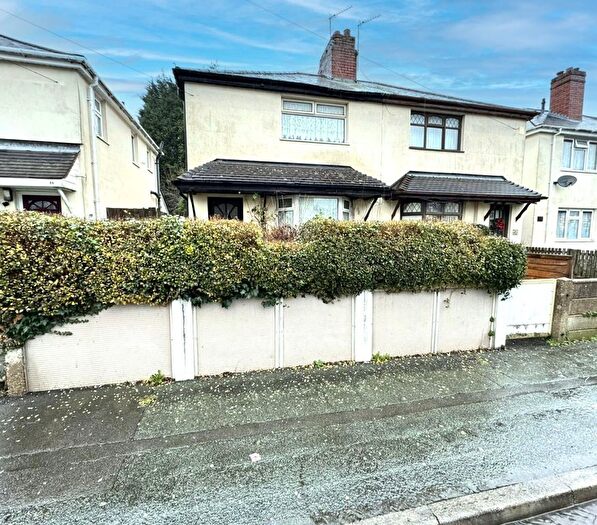
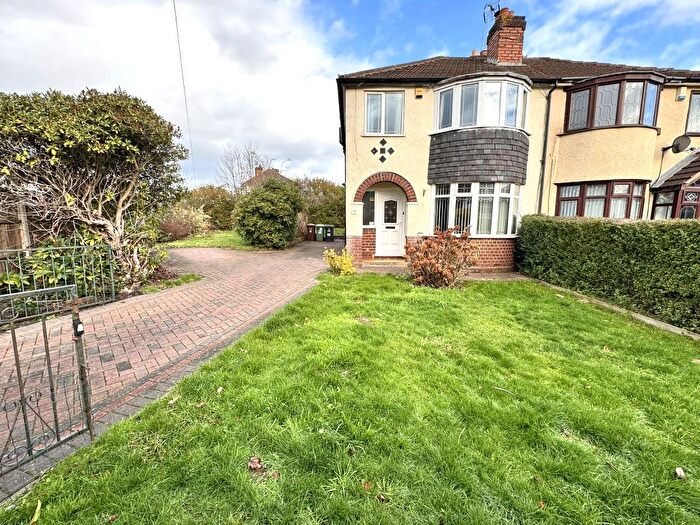
Properties for sale in East Park
Previously listed properties in East Park
Roads and Postcodes in East Park
Navigate through our locations to find the location of your next house in East Park, Willenhall for sale or to rent.
| Streets | Postcodes |
|---|---|
| Boundary Close | WV13 3NZ |
| Bowker Street | WV13 3NF WV13 3NW |
| Brick Kiln Street | WV13 3EU |
| Brook Road | WV13 3UH WV13 3UJ |
| Burford Close | WV13 3AH |
| Challenor Avenue | WV13 3NE |
| Cleveland Close | WV13 3PZ |
| Deans Gate | WV13 3NH |
| Dilloways Lane | WV13 3EW WV13 3EX |
| Evans Street | WV13 3UN |
| Hill Road | WV13 3TR WV13 3TS WV13 3TT |
| Lauder Close | WV13 3QH |
| Marshall Road | WV13 3PB WV13 3QD |
| Millichip Road | WV13 3UL |
| Moseley Road | WV13 3QB WV13 3QX WV13 3QY |
| Neachells Lane | WV13 3LR |
| New Street | WV13 3TB WV13 3TD WV13 3TL |
| Noose Lane | WV13 3AE WV13 3LW |
| Portobello Close | WV13 3QA |
| S V Business Park Road | WV13 3AN |
| Shoreham Close | WV13 3QG |
| South Street | WV13 3TG |
| Stubbington Close | WV13 3QF |
| Uplands Avenue | WV13 3PA WV13 3PR |
| Uplands Grove | WV13 3PE |
| Uplands Road | WV13 3PD WV13 3QE |
| Vaughan Road | WV13 3TJ WV13 3UD |
| Vernon Close | WV13 3TF |
| Verwood Close | WV13 3QQ |
| Willenhall Road | WV13 3LH WV13 3LP WV13 3NX WV13 3NY WV13 3PS WV13 3QU WV13 3QZ WV13 3RA WV13 3ND WV13 3RB |
| WV13 3BR |
Transport near East Park
-
Wolverhampton Station
-
Coseley Station
-
Tipton Station
-
Bloxwich Station
-
Bescot Stadium Station
-
Bloxwich North Station
-
Walsall Station
-
Dudley Port Station
-
Tame Bridge Parkway Station
- FAQ
- Price Paid By Year
- Property Type Price
Frequently asked questions about East Park
What is the average price for a property for sale in East Park?
The average price for a property for sale in East Park is £188,500. This amount is 8% lower than the average price in Willenhall. There are 359 property listings for sale in East Park.
What streets have the most expensive properties for sale in East Park?
The streets with the most expensive properties for sale in East Park are Moseley Road at an average of £240,000, Shoreham Close at an average of £230,666 and Challenor Avenue at an average of £227,000.
What streets have the most affordable properties for sale in East Park?
The streets with the most affordable properties for sale in East Park are Deans Gate at an average of £135,656, Uplands Avenue at an average of £168,666 and Boundary Close at an average of £184,333.
Which train stations are available in or near East Park?
Some of the train stations available in or near East Park are Wolverhampton, Coseley and Tipton.
Property Price Paid in East Park by Year
The average sold property price by year was:
| Year | Average Sold Price | Price Change |
Sold Properties
|
|---|---|---|---|
| 2025 | £201,333 | 10% |
15 Properties |
| 2024 | £181,026 | -3% |
19 Properties |
| 2023 | £186,629 | 8% |
27 Properties |
| 2022 | £171,386 | 3% |
40 Properties |
| 2021 | £166,714 | 6% |
28 Properties |
| 2020 | £156,456 | 14% |
37 Properties |
| 2019 | £133,896 | -1% |
29 Properties |
| 2018 | £135,747 | 20% |
19 Properties |
| 2017 | £108,094 | -0,2% |
29 Properties |
| 2016 | £108,308 | 3% |
25 Properties |
| 2015 | £104,650 | 6% |
20 Properties |
| 2014 | £98,816 | -7% |
27 Properties |
| 2013 | £106,083 | 11% |
18 Properties |
| 2012 | £94,903 | -4% |
13 Properties |
| 2011 | £98,638 | 7% |
18 Properties |
| 2010 | £91,475 | -8% |
21 Properties |
| 2009 | £99,000 | -10% |
16 Properties |
| 2008 | £108,672 | -8% |
11 Properties |
| 2007 | £116,955 | -1% |
38 Properties |
| 2006 | £118,648 | 3% |
53 Properties |
| 2005 | £115,145 | 23% |
41 Properties |
| 2004 | £88,180 | 15% |
26 Properties |
| 2003 | £74,997 | 17% |
21 Properties |
| 2002 | £62,442 | 15% |
22 Properties |
| 2001 | £52,885 | 19% |
14 Properties |
| 2000 | £42,910 | -31% |
33 Properties |
| 1999 | £56,423 | 26% |
13 Properties |
| 1998 | £41,775 | -12% |
21 Properties |
| 1997 | £46,984 | 11% |
19 Properties |
| 1996 | £41,747 | 22% |
16 Properties |
| 1995 | £32,567 | - |
11 Properties |
Property Price per Property Type in East Park
Here you can find historic sold price data in order to help with your property search.
The average Property Paid Price for specific property types in the last three years are:
| Property Type | Average Sold Price | Sold Properties |
|---|---|---|
| Semi Detached House | £207,519.00 | 26 Semi Detached Houses |
| Detached House | £204,411.00 | 17 Detached Houses |
| Terraced House | £168,318.00 | 11 Terraced Houses |
| Flat | £110,928.00 | 7 Flats |

