
Houses for sale & to rent in Wolverhampton, City of Wolverhampton
House Prices in Wolverhampton
Properties in Wolverhampton have an average house price of £220k and had 6,276 Property Transactions within the last 3 years.¹
Wolverhampton is an area in City of Wolverhampton with 86,790 households², where the most expensive property was sold for £1.95M.
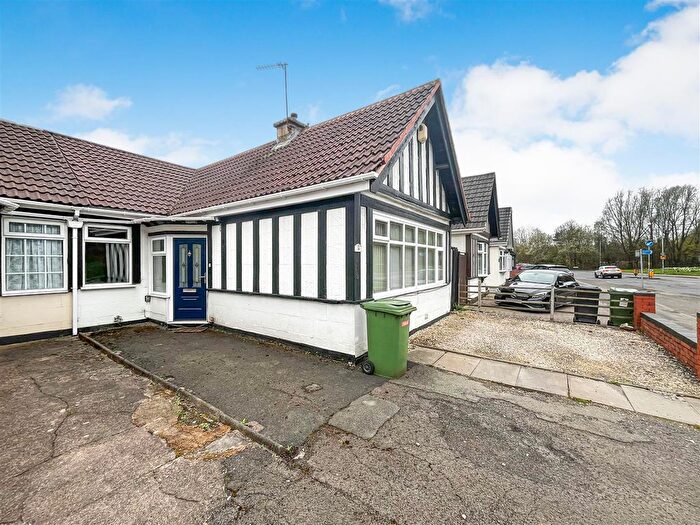
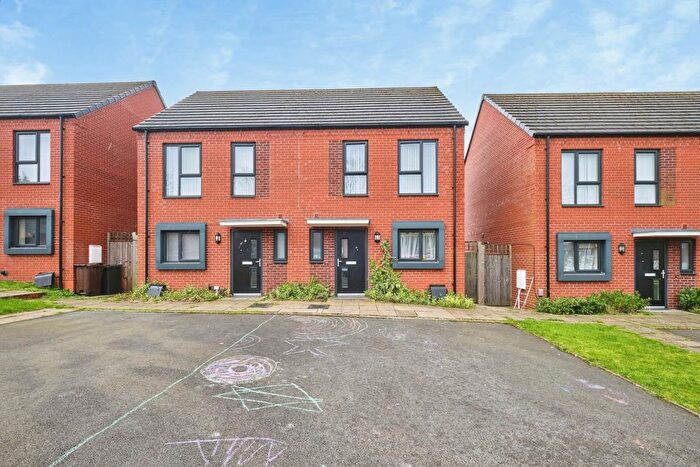
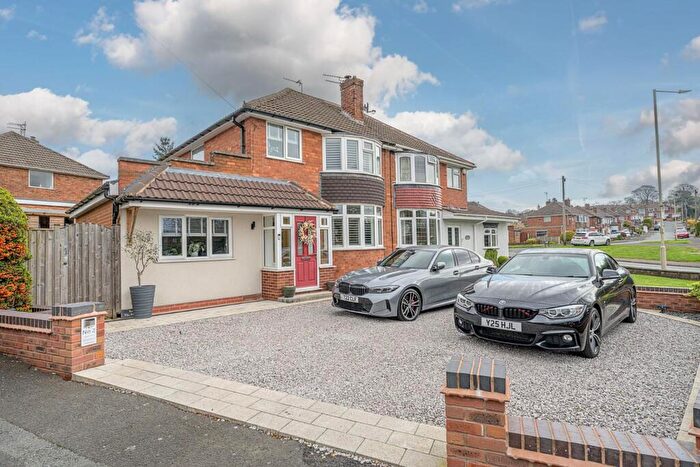
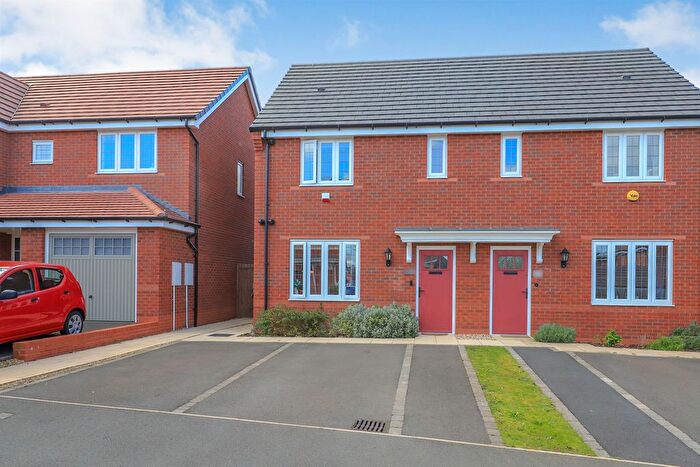
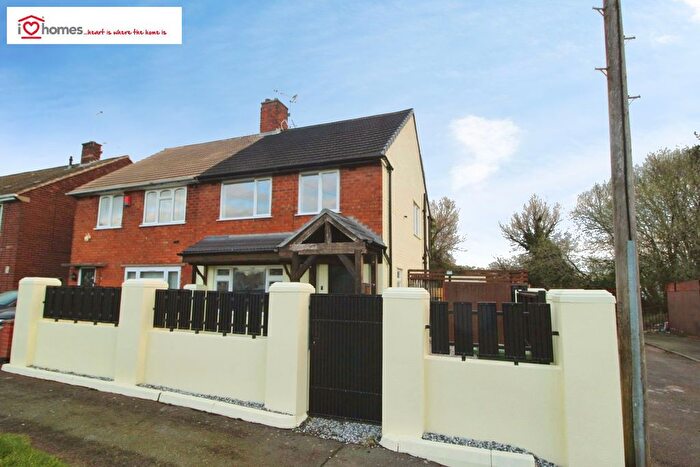
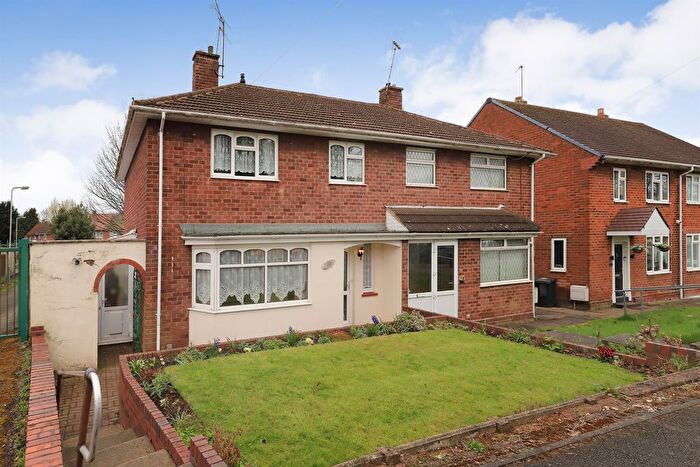
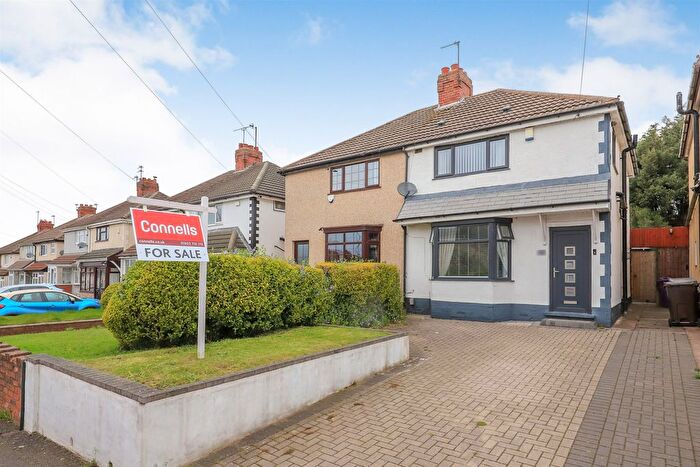
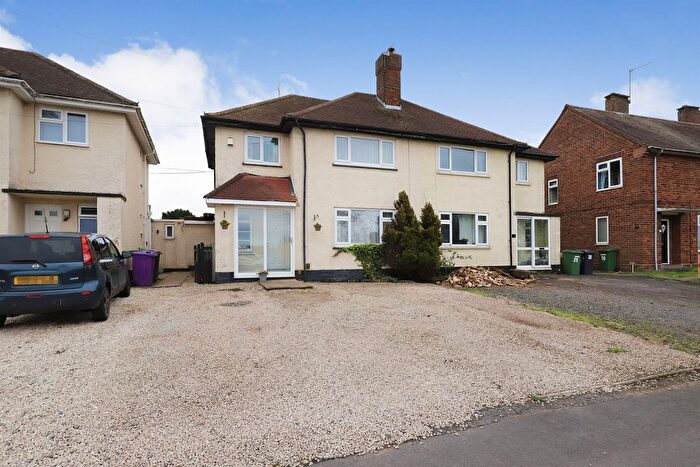
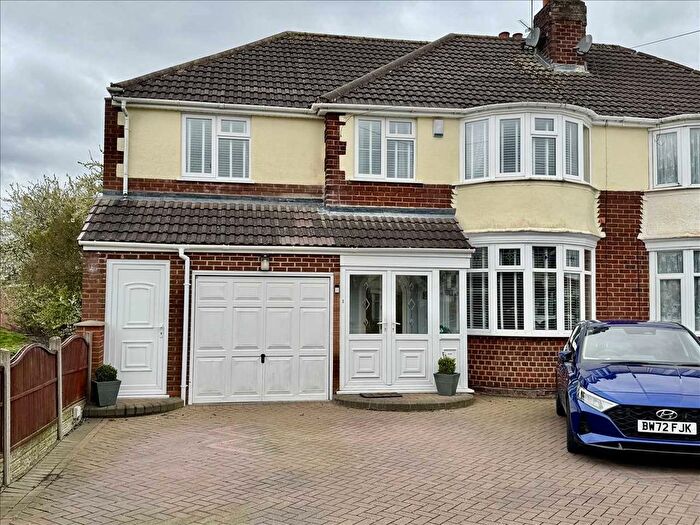
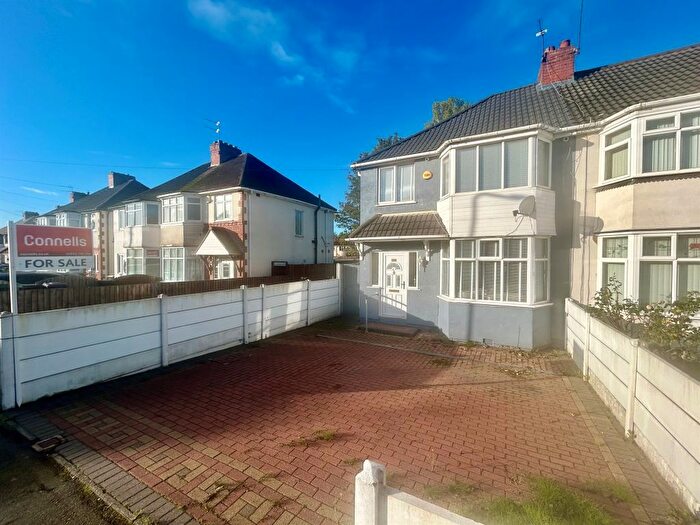
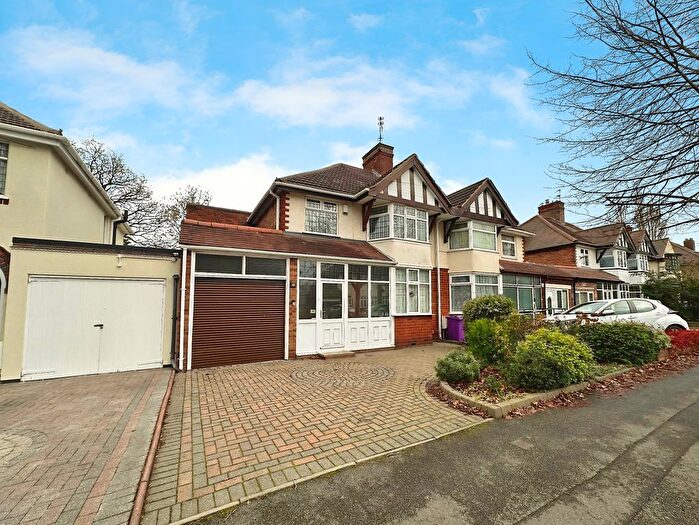
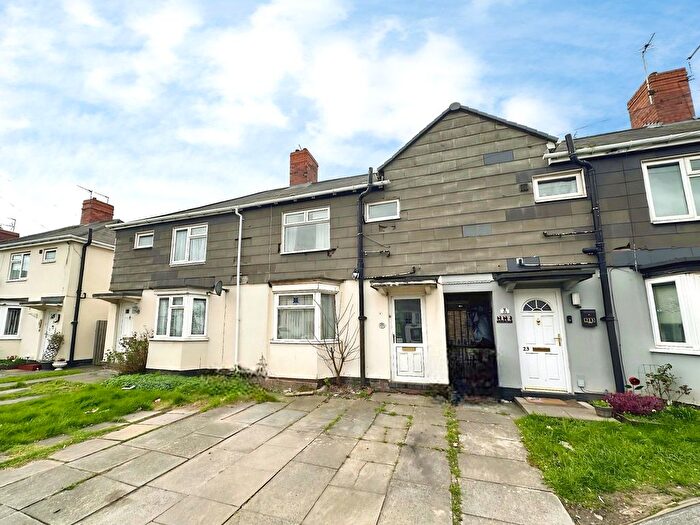
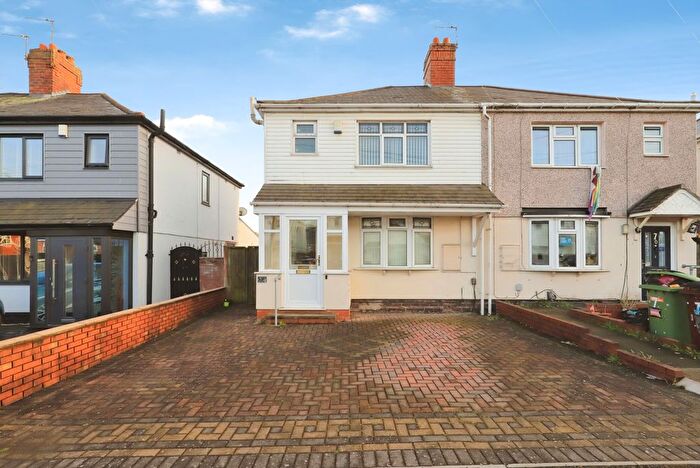
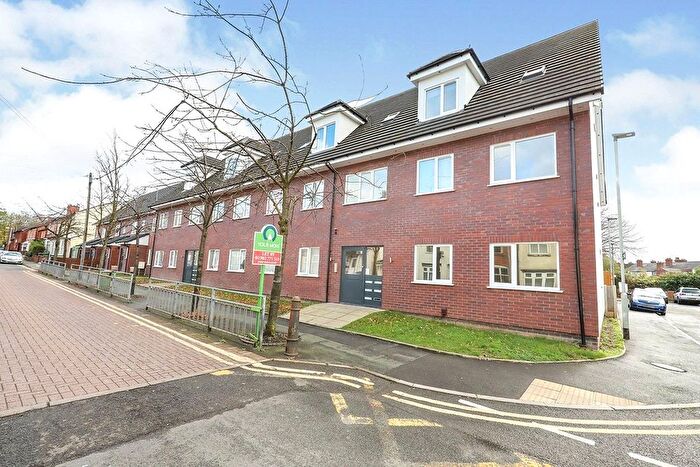
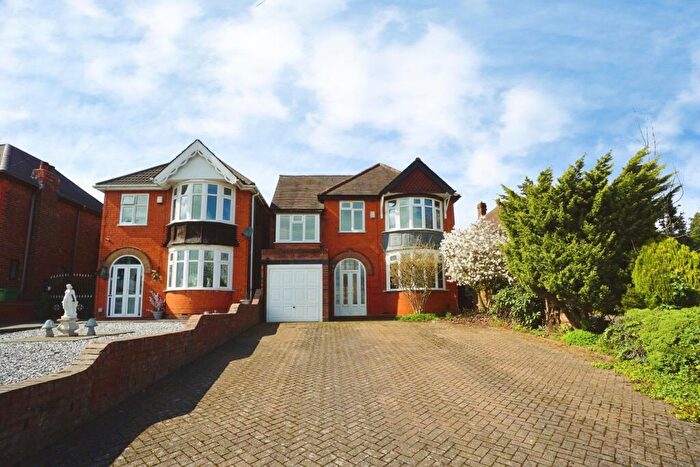
Properties for sale in Wolverhampton
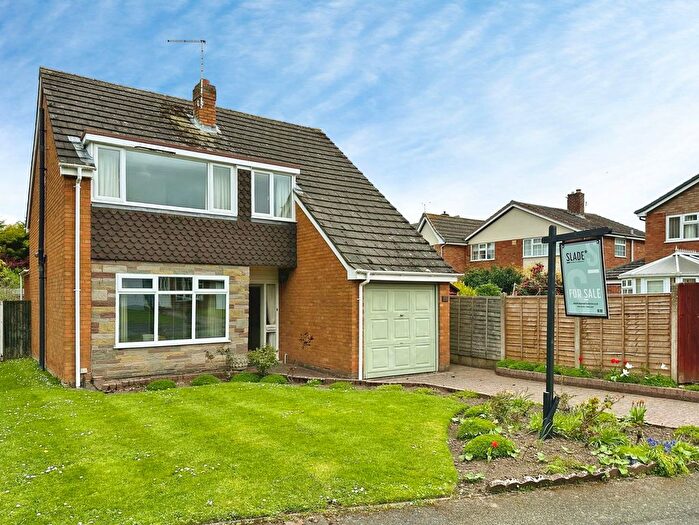
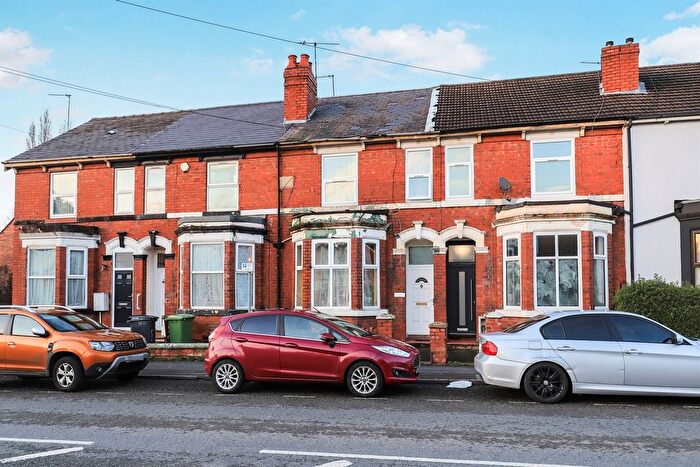
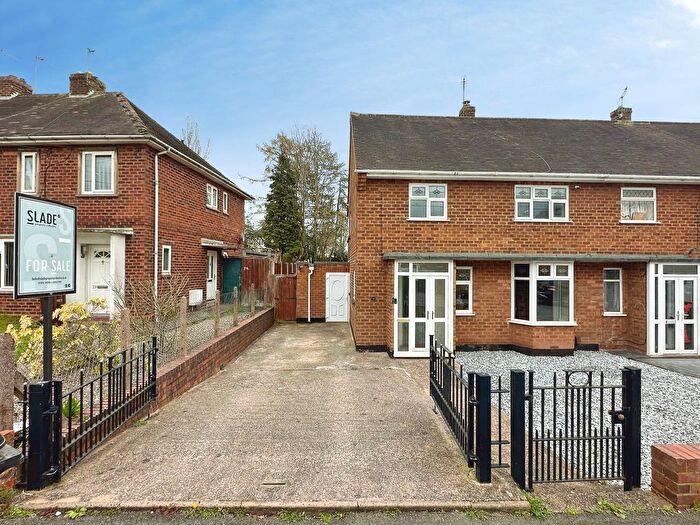
![]()
If you are looking to sell your house, let it out, or receive a property valuation, an expert can help you.
Click the button below to get started.
Neighbourhoods in Wolverhampton
Navigate through our locations to find the location of your next house in Wolverhampton, City of Wolverhampton for sale or to rent.
Transport in Wolverhampton
Please see below transportation links in this area:

- FAQ
- Price Paid By Year
- Property Type Price
Frequently asked questions about Wolverhampton
What is the average price for a property for sale in Wolverhampton?
The average price for a property for sale in Wolverhampton is £220,201. This amount is 2% higher than the average price in City of Wolverhampton. There are more than 10,000 property listings for sale in Wolverhampton.
What locations have the most expensive properties for sale in Wolverhampton?
The locations with the most expensive properties for sale in Wolverhampton are Tettenhall Regis at an average of £327,512, Bilston East at an average of £312,548 and Tettenhall Wightwick at an average of £309,394.
What locations have the most affordable properties for sale in Wolverhampton?
The locations with the most affordable properties for sale in Wolverhampton are St Peters at an average of £144,354, Heath Town at an average of £147,150 and East Park at an average of £163,083.
Which train stations are available in or near Wolverhampton?
Some of the train stations available in or near Wolverhampton are Wolverhampton, Bilbrook and Coseley.
Property Price Paid in Wolverhampton by Year
The average sold property price by year was:
| Year | Average Sold Price | Price Change |
Sold Properties
|
|---|---|---|---|
| 2026 | £213,177 | -8% |
31 Properties |
| 2025 | £231,112 | 5% |
1,880 Properties |
| 2024 | £219,849 | 4% |
2,267 Properties |
| 2023 | £210,908 | 2% |
2,098 Properties |
| 2022 | £207,343 | 6% |
2,493 Properties |
| 2021 | £195,906 | 9% |
2,946 Properties |
| 2020 | £179,172 | 3% |
2,236 Properties |
| 2019 | £173,014 | 3% |
2,738 Properties |
| 2018 | £167,830 | 4% |
2,870 Properties |
| 2017 | £160,841 | 4% |
2,942 Properties |
| 2016 | £155,010 | 5% |
2,967 Properties |
| 2015 | £147,334 | 4% |
2,605 Properties |
| 2014 | £141,803 | 4% |
2,377 Properties |
| 2013 | £135,993 | 2% |
2,009 Properties |
| 2012 | £133,617 | 1% |
1,714 Properties |
| 2011 | £131,785 | 2% |
1,672 Properties |
| 2010 | £129,210 | -4% |
1,506 Properties |
| 2009 | £133,755 | -3% |
1,515 Properties |
| 2008 | £137,969 | -3% |
1,798 Properties |
| 2007 | £141,801 | 4% |
3,329 Properties |
| 2006 | £136,700 | 5% |
3,327 Properties |
| 2005 | £129,542 | 8% |
2,955 Properties |
| 2004 | £119,567 | 16% |
3,197 Properties |
| 2003 | £100,309 | 17% |
3,415 Properties |
| 2002 | £82,768 | 16% |
3,391 Properties |
| 2001 | £69,388 | 10% |
3,140 Properties |
| 2000 | £62,347 | 5% |
2,734 Properties |
| 1999 | £59,531 | 9% |
2,816 Properties |
| 1998 | £54,259 | 2% |
2,551 Properties |
| 1997 | £53,340 | 4% |
2,666 Properties |
| 1996 | £51,055 | 1% |
2,417 Properties |
| 1995 | £50,604 | - |
2,174 Properties |
Property Price per Property Type in Wolverhampton
Here you can find historic sold price data in order to help with your property search.
The average Property Paid Price for specific property types in the last three years are:
| Property Type | Average Sold Price | Sold Properties |
|---|---|---|
| Semi Detached House | £220,398.00 | 2,803 Semi Detached Houses |
| Terraced House | £173,958.00 | 1,646 Terraced Houses |
| Detached House | £367,472.00 | 1,075 Detached Houses |
| Flat | £110,161.00 | 752 Flats |