Houses for sale & to rent in Bude, Cornwall
House Prices in Bude
Properties in Bude have an average house price of £383,076.00 and had 698 Property Transactions within the last 3 years.¹
Bude is an area in Cornwall with 6,861 households², where the most expensive property was sold for £1,351,500.00.
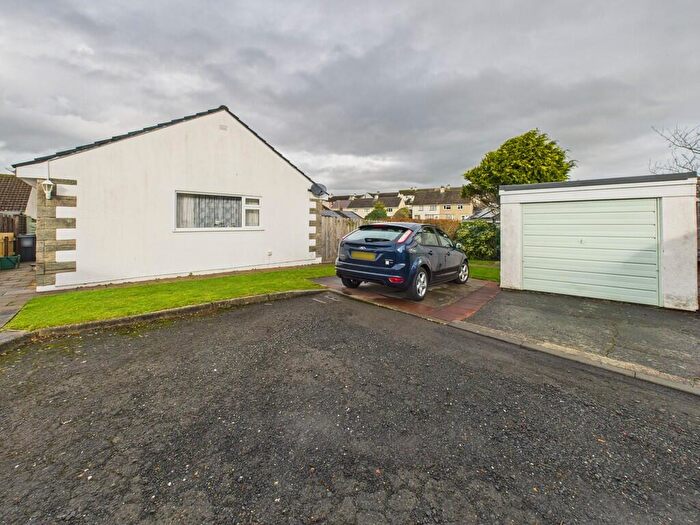
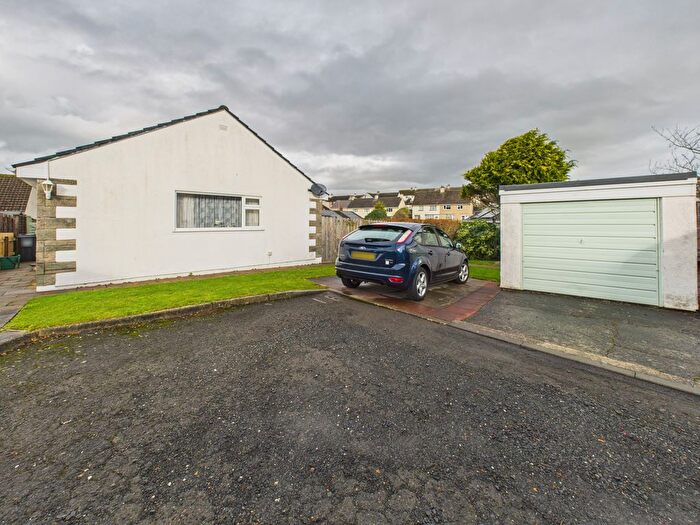
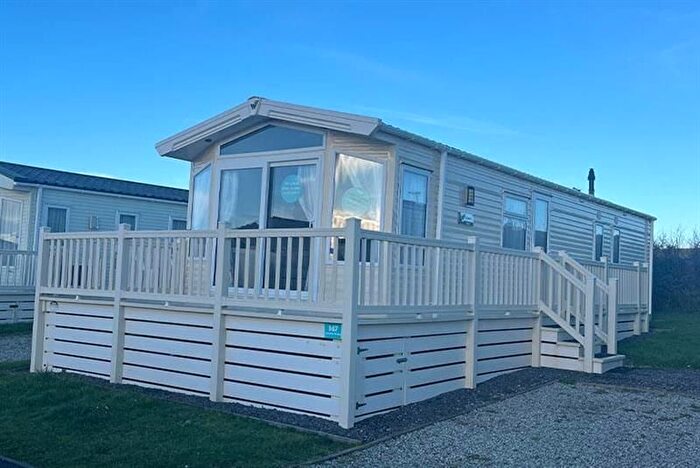
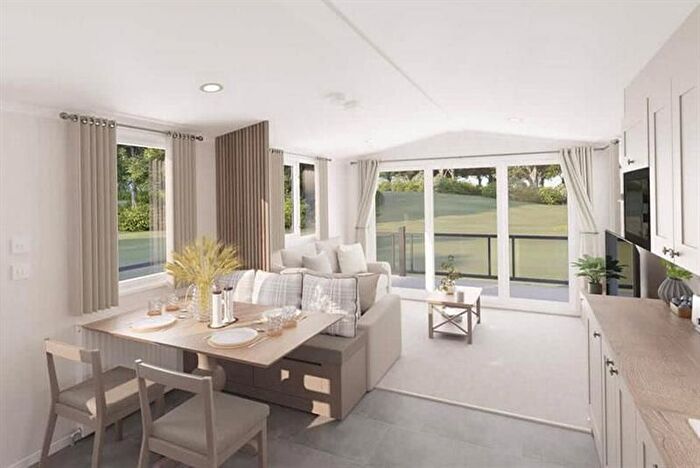
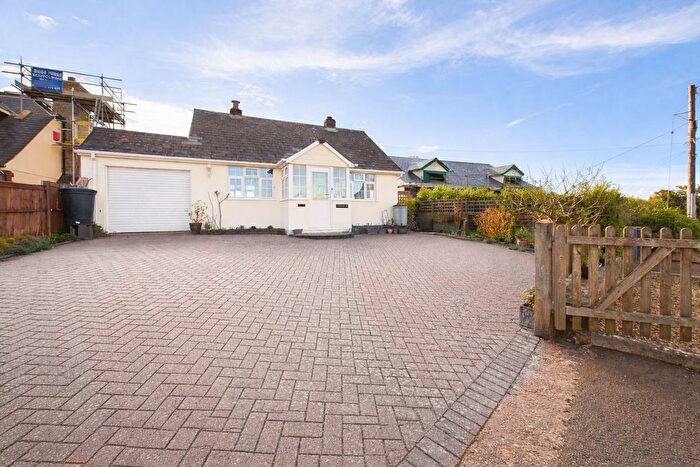
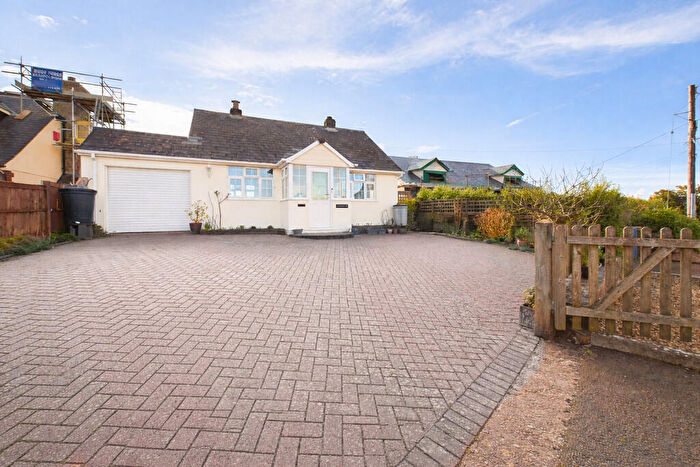
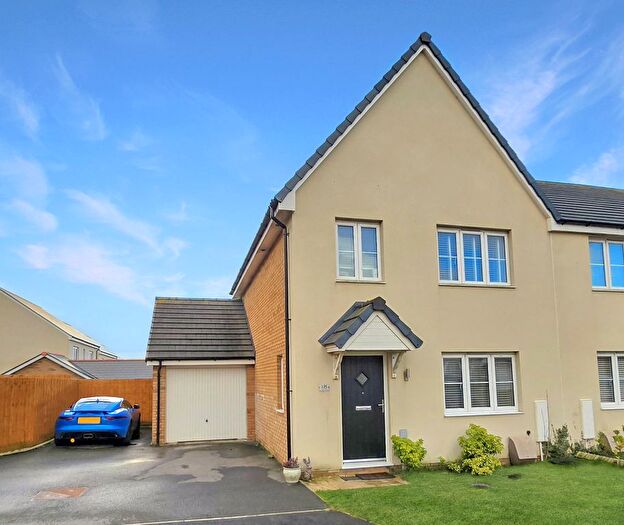
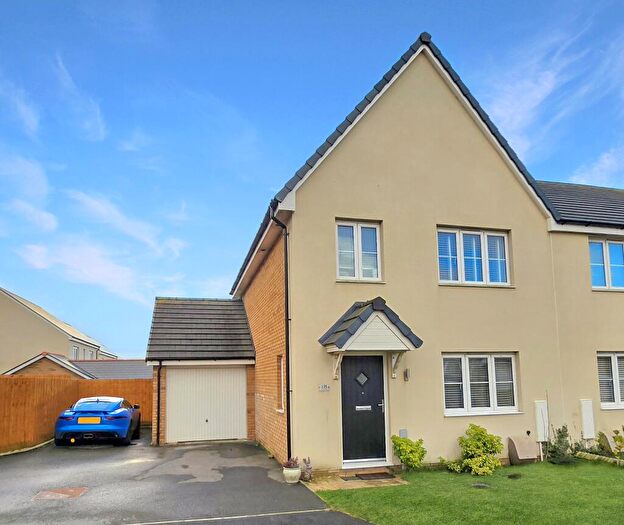
Properties for sale in Bude
Neighbourhoods in Bude
Navigate through our locations to find the location of your next house in Bude, Cornwall for sale or to rent.
Transport in Bude
Please see below transportation links in this area:
-
Okehampton Station
-
Gunnislake Station
-
Sampford Courtenay Station
-
Chapelton Station
-
Liskeard Station
-
Coombe Junction Halt Station
-
Calstock Station
-
Bodmin Parkway Station
-
Barnstaple Station
-
Umberleigh Station
- FAQ
- Price Paid By Year
- Property Type Price
Frequently asked questions about Bude
What is the average price for a property for sale in Bude?
The average price for a property for sale in Bude is £383,076. This amount is 11% higher than the average price in Cornwall. There are 4,816 property listings for sale in Bude.
What locations have the most expensive properties for sale in Bude?
The locations with the most expensive properties for sale in Bude are Poundstock at an average of £432,813 and Bude at an average of £389,042.
What locations have the most affordable properties for sale in Bude?
The location with the most affordable properties for sale in Bude is Grenville And Stratton at an average of £341,435.
Which train stations are available in or near Bude?
Some of the train stations available in or near Bude are Okehampton, Gunnislake and Sampford Courtenay.
Property Price Paid in Bude by Year
The average sold property price by year was:
| Year | Average Sold Price | Price Change |
Sold Properties
|
|---|---|---|---|
| 2025 | £366,340 | -4% |
205 Properties |
| 2024 | £382,248 | -4% |
237 Properties |
| 2023 | £397,244 | 3% |
256 Properties |
| 2022 | £385,666 | 6% |
295 Properties |
| 2021 | £360,676 | 3% |
410 Properties |
| 2020 | £349,145 | 9% |
298 Properties |
| 2019 | £318,600 | 13% |
338 Properties |
| 2018 | £278,079 | -2% |
364 Properties |
| 2017 | £284,141 | 0,1% |
382 Properties |
| 2016 | £283,826 | 4% |
355 Properties |
| 2015 | £273,819 | 9% |
353 Properties |
| 2014 | £248,415 | 1% |
305 Properties |
| 2013 | £245,696 | 4% |
266 Properties |
| 2012 | £236,987 | -5% |
248 Properties |
| 2011 | £248,143 | 1% |
226 Properties |
| 2010 | £244,551 | 7% |
260 Properties |
| 2009 | £227,121 | -9% |
223 Properties |
| 2008 | £247,062 | 4% |
236 Properties |
| 2007 | £237,042 | -1% |
390 Properties |
| 2006 | £238,595 | 12% |
411 Properties |
| 2005 | £210,466 | 1% |
289 Properties |
| 2004 | £208,728 | 17% |
324 Properties |
| 2003 | £173,749 | 19% |
349 Properties |
| 2002 | £140,230 | 18% |
441 Properties |
| 2001 | £115,624 | 11% |
410 Properties |
| 2000 | £102,521 | 14% |
444 Properties |
| 1999 | £87,734 | 14% |
392 Properties |
| 1998 | £75,873 | 10% |
315 Properties |
| 1997 | £68,536 | 12% |
396 Properties |
| 1996 | £60,645 | 0,5% |
327 Properties |
| 1995 | £60,347 | - |
249 Properties |
Property Price per Property Type in Bude
Here you can find historic sold price data in order to help with your property search.
The average Property Paid Price for specific property types in the last three years are:
| Property Type | Average Sold Price | Sold Properties |
|---|---|---|
| Semi Detached House | £339,774.00 | 121 Semi Detached Houses |
| Detached House | £461,479.00 | 349 Detached Houses |
| Terraced House | £285,099.00 | 131 Terraced Houses |
| Flat | £287,320.00 | 97 Flats |

