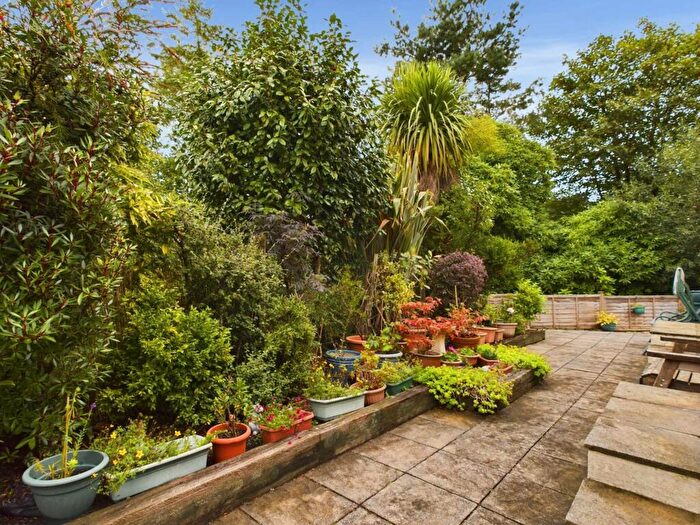
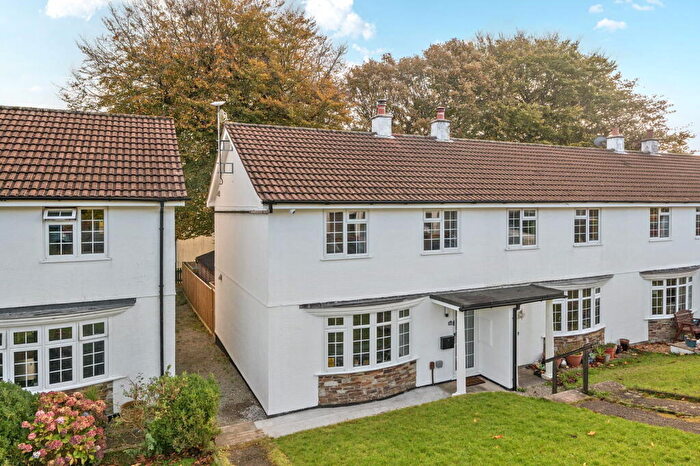
Houses for sale & to rent in Gunnislake And Calstock, Calstock
House Prices in Gunnislake And Calstock
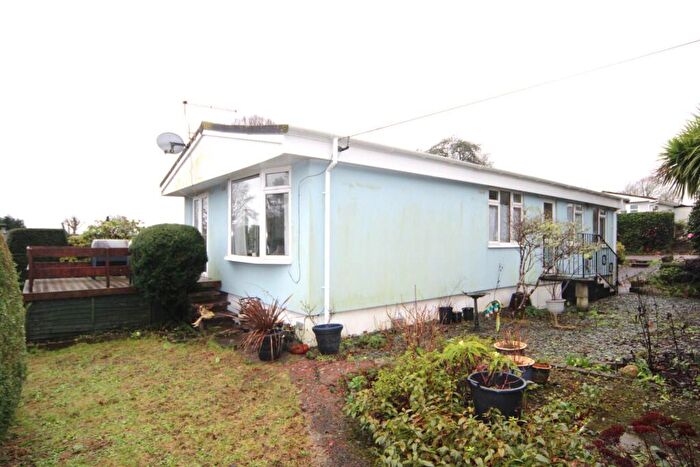
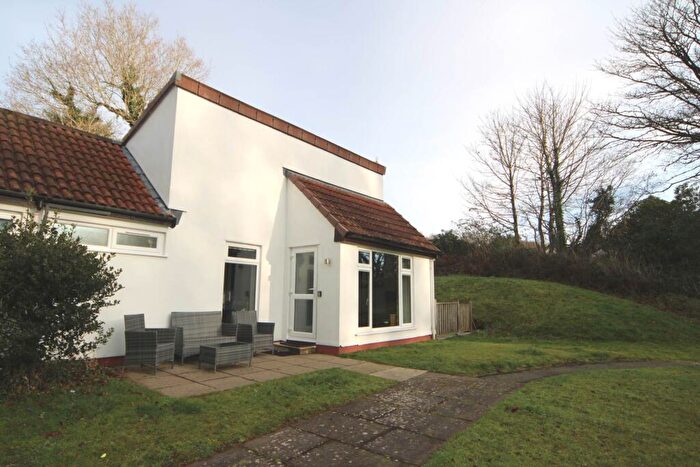
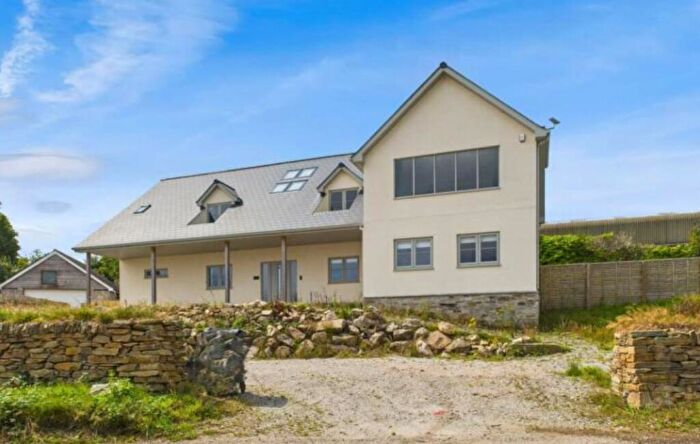
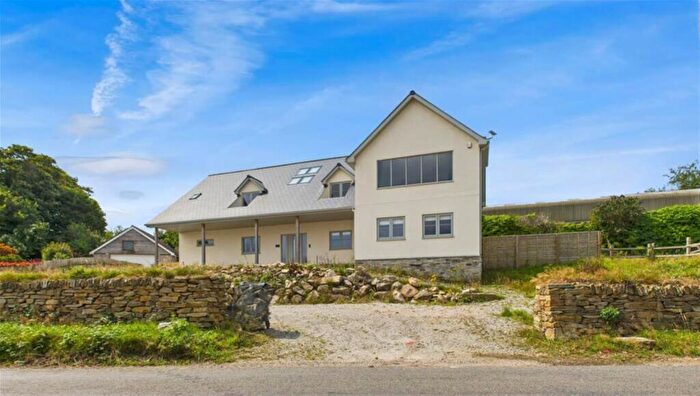
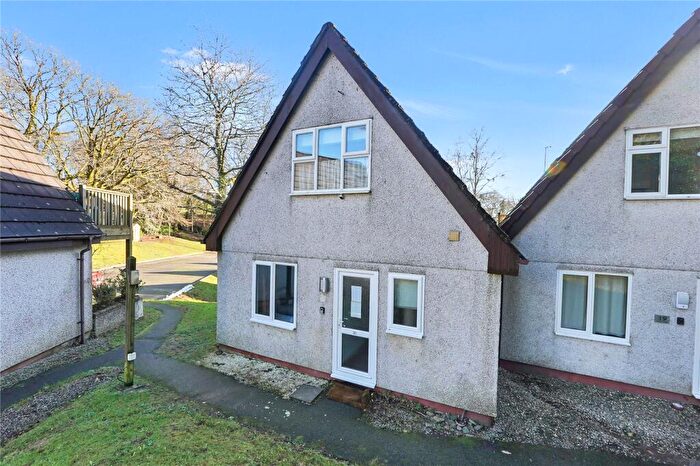
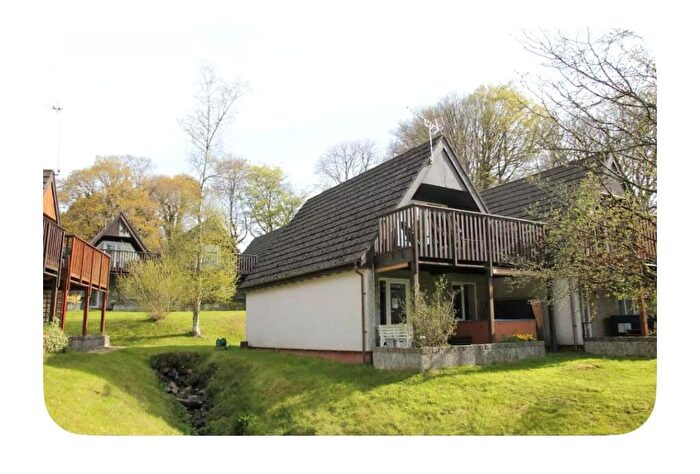
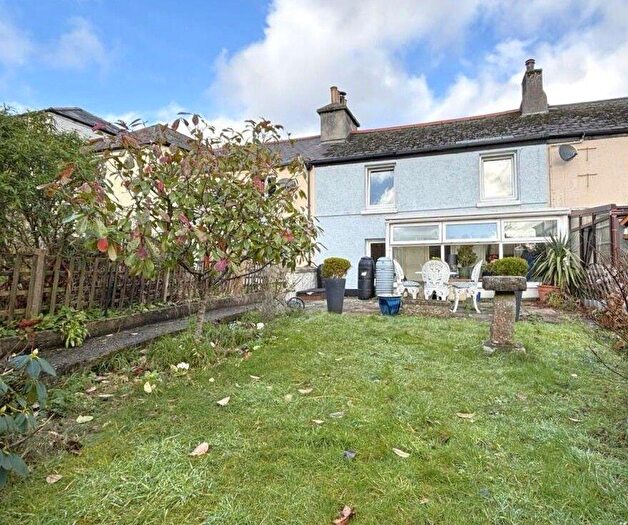
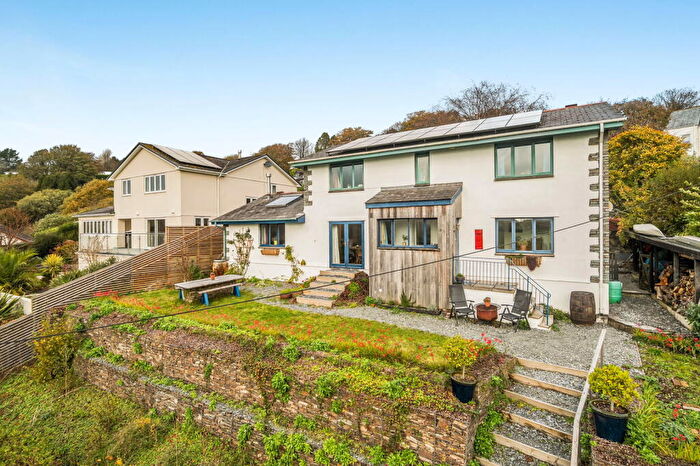
Properties in Gunnislake And Calstock have an average house price of £329,528.00 and had 65 Property Transactions within the last 3 years¹.
Gunnislake And Calstock is an area in Calstock, Cornwall with 523 households², where the most expensive property was sold for £900,000.00.
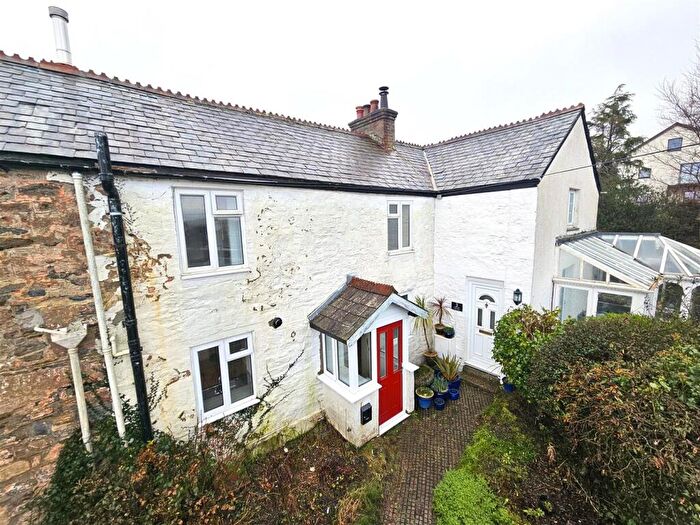
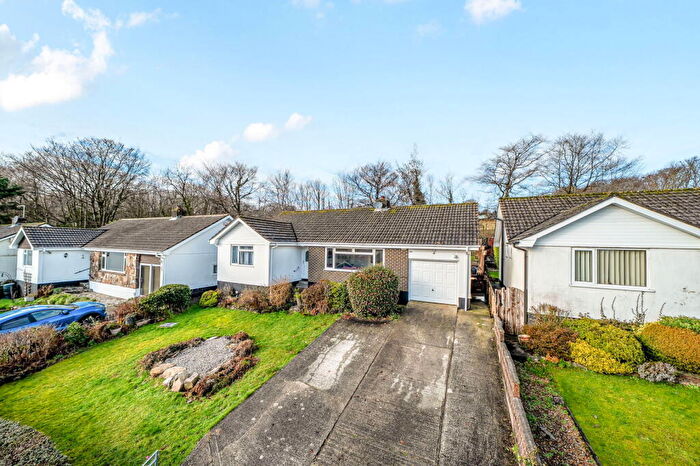
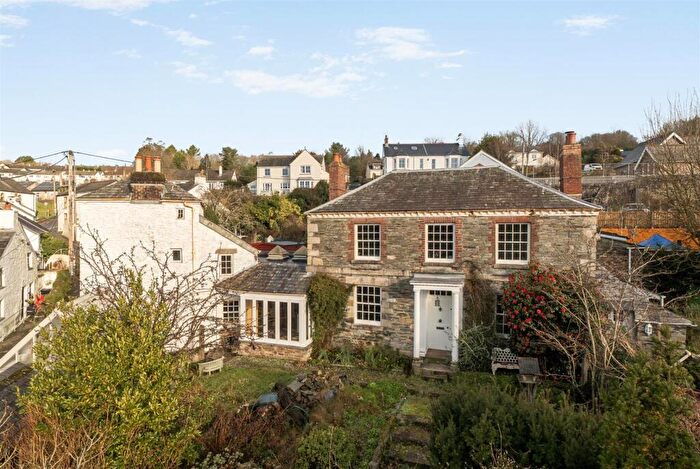
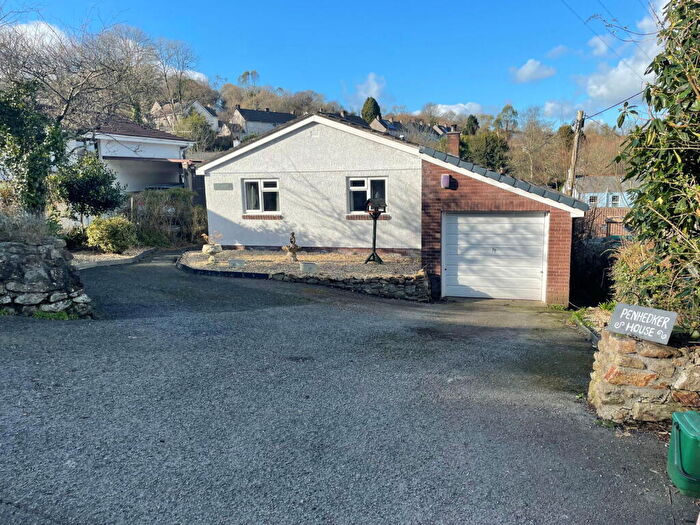
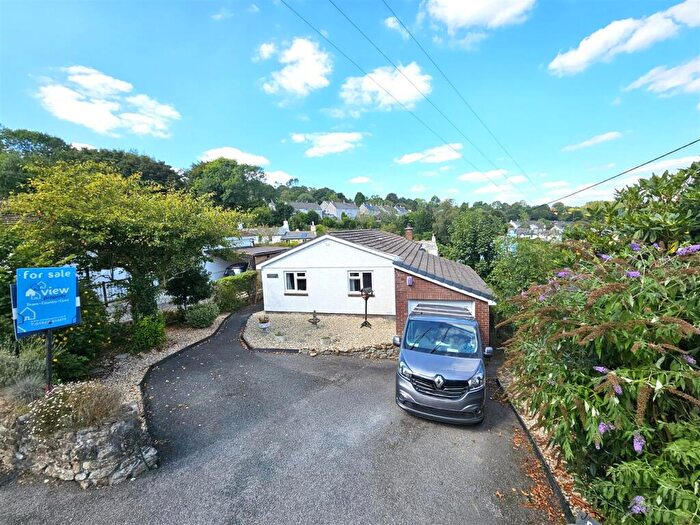
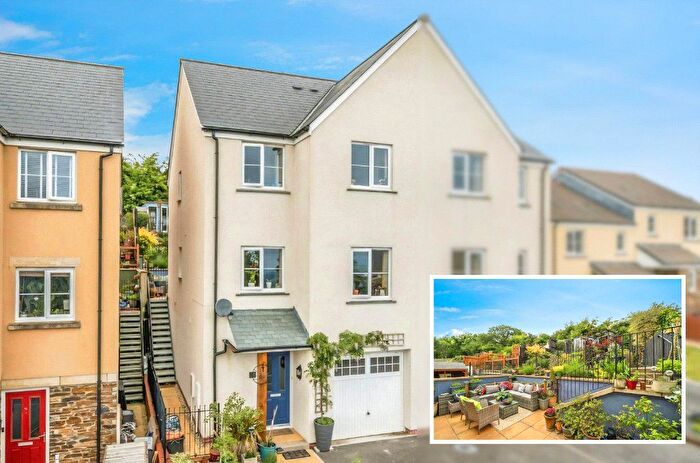
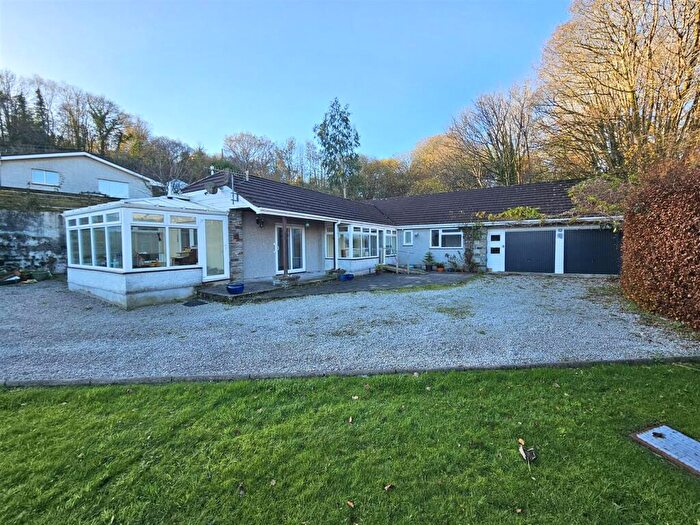
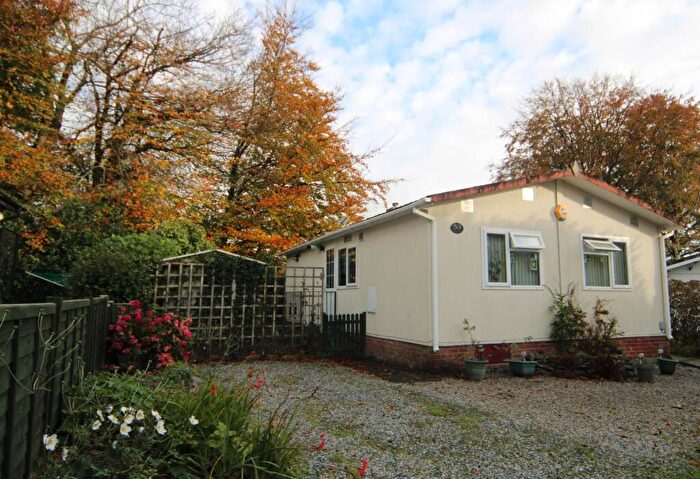
Properties for sale in Gunnislake And Calstock
Roads and Postcodes in Gunnislake And Calstock
Navigate through our locations to find the location of your next house in Gunnislake And Calstock, Calstock for sale or to rent.
| Streets | Postcodes |
|---|---|
| Adit Cottages | PL18 9QR |
| Arum Grove | PL18 9FT |
| Back Road | PL18 9QL |
| Baptist Street | PL18 9RR |
| Buzzard Rise | PL18 9FL |
| Cemetery Road | PL18 9FE |
| Church Hill | PL18 9QG PL18 9QQ |
| Church Lane | PL18 9QH |
| Church Street | PL18 9QE |
| Commercial Road | PL18 9QT |
| Cotehele View | PL18 9RJ |
| Cotehele Villas | PL18 9RD |
| Curlew Walk | PL18 9FR |
| Double White Rise | PL18 9FJ |
| Edgcumbe Close | PL18 9BS |
| Eric Road | PL18 9SH |
| Fore Street | PL18 9RN |
| Glendorgal Park | PL18 9BQ |
| Harewood Road | PL18 9QN PL18 9QW PL18 9SJ |
| Higher Kelly | PL18 9QY PL18 9QZ PL18 9RA |
| Highfield | PL18 9HR |
| Johnson Park | PL18 9RH |
| Jubilee Cottages | PL18 9LB |
| Kelly Gardens | PL18 9SA PL18 9SB |
| King Street | PL18 9LL |
| Lang Gardens | PL18 9SL |
| Liscombe Close | PL18 9LU |
| May Place | PL18 9QP |
| North Park | PL18 9DJ |
| Phoebe Close | PL18 9FB |
| Poplar Cottages | PL18 9RS |
| Providence Place | PL18 9RW |
| Raven Close | PL18 9FQ |
| Rock Park Villas | PL18 9RF |
| Rodda Close | PL18 9LT |
| Rose Hill Terrace | PL18 9RE |
| Rowse Gardens | PL18 9RB |
| Sand Lane | PL18 9QX |
| Sandways | PL18 9SE |
| Sound View | PL18 9JD |
| St Andrews Close | PL18 9RQ |
| Starling Lane | PL18 9FS |
| Station Lane | PL18 9QF |
| Tamar Place | PL18 9QU |
| The Butts | PL18 9SD |
| The Court | PL18 9QD |
| The Crescent | PL18 9JR |
| The Quay | PL18 9QA |
| Woodland Close | PL18 9JE |
| PL18 9QB PL18 9QS PL18 9RG PL18 9RT PL18 9RU PL18 9RX PL18 9RY PL18 9RZ PL18 9SF PL18 9SG PL18 9SQ PL18 9AP PL18 9EN PL18 9FF PL18 9FH PL18 9FP PL18 9FU PL18 9FW PL18 9HG PL18 9NU PL18 9NX PL18 9PA PL18 9QJ |
Transport near Gunnislake And Calstock
- FAQ
- Price Paid By Year
- Property Type Price
Frequently asked questions about Gunnislake And Calstock
What is the average price for a property for sale in Gunnislake And Calstock?
The average price for a property for sale in Gunnislake And Calstock is £329,528. There are 568 property listings for sale in Gunnislake And Calstock.
What streets have the most expensive properties for sale in Gunnislake And Calstock?
The streets with the most expensive properties for sale in Gunnislake And Calstock are Sandways at an average of £621,125, Rock Park Villas at an average of £610,000 and Higher Kelly at an average of £586,250.
What streets have the most affordable properties for sale in Gunnislake And Calstock?
The streets with the most affordable properties for sale in Gunnislake And Calstock are Phoebe Close at an average of £137,550, Rowse Gardens at an average of £145,000 and Adit Cottages at an average of £160,250.
Which train stations are available in or near Gunnislake And Calstock?
Some of the train stations available in or near Gunnislake And Calstock are Calstock, Gunnislake and Bere Alston.
Property Price Paid in Gunnislake And Calstock by Year
The average sold property price by year was:
| Year | Average Sold Price | Price Change |
Sold Properties
|
|---|---|---|---|
| 2025 | £354,842 | 23% |
27 Properties |
| 2024 | £274,031 | -27% |
19 Properties |
| 2023 | £349,052 | 14% |
19 Properties |
| 2022 | £301,056 | 1% |
33 Properties |
| 2021 | £297,115 | 16% |
66 Properties |
| 2020 | £248,938 | 0,5% |
84 Properties |
| 2019 | £247,757 | 16% |
56 Properties |
| 2018 | £209,134 | 3% |
31 Properties |
| 2017 | £202,473 | 1% |
38 Properties |
| 2016 | £199,484 | 9% |
54 Properties |
| 2015 | £180,842 | -8% |
32 Properties |
| 2014 | £196,162 | -14% |
12 Properties |
| 2013 | £224,118 | 7% |
8 Properties |
| 2012 | £208,761 | -30% |
18 Properties |
| 2011 | £272,076 | 5% |
13 Properties |
| 2010 | £257,150 | 13% |
10 Properties |
| 2009 | £223,545 | -10% |
22 Properties |
| 2008 | £245,687 | 17% |
8 Properties |
| 2007 | £204,319 | 0,2% |
25 Properties |
| 2006 | £203,855 | -3% |
28 Properties |
| 2005 | £209,377 | 15% |
15 Properties |
| 2004 | £178,347 | 18% |
17 Properties |
| 2003 | £147,085 | 10% |
31 Properties |
| 2002 | £131,780 | 14% |
30 Properties |
| 2001 | £113,757 | 17% |
44 Properties |
| 2000 | £94,904 | 13% |
32 Properties |
| 1999 | £82,365 | 24% |
33 Properties |
| 1998 | £62,560 | 2% |
23 Properties |
| 1997 | £61,541 | 11% |
31 Properties |
| 1996 | £54,595 | 3% |
20 Properties |
| 1995 | £53,127 | - |
21 Properties |
Property Price per Property Type in Gunnislake And Calstock
Here you can find historic sold price data in order to help with your property search.
The average Property Paid Price for specific property types in the last three years are:
| Property Type | Average Sold Price | Sold Properties |
|---|---|---|
| Semi Detached House | £254,944.00 | 18 Semi Detached Houses |
| Detached House | £477,054.00 | 23 Detached Houses |
| Terraced House | £253,338.00 | 21 Terraced Houses |
| Flat | £179,333.00 | 3 Flats |

