
Houses for sale & to rent in Tintagel, Camelford
House Prices in Tintagel
Properties in Tintagel have an average house price of £382,775.00 and had 28 Property Transactions within the last 3 years¹.
Tintagel is an area in Camelford, Cornwall with 278 households², where the most expensive property was sold for £747,000.00.
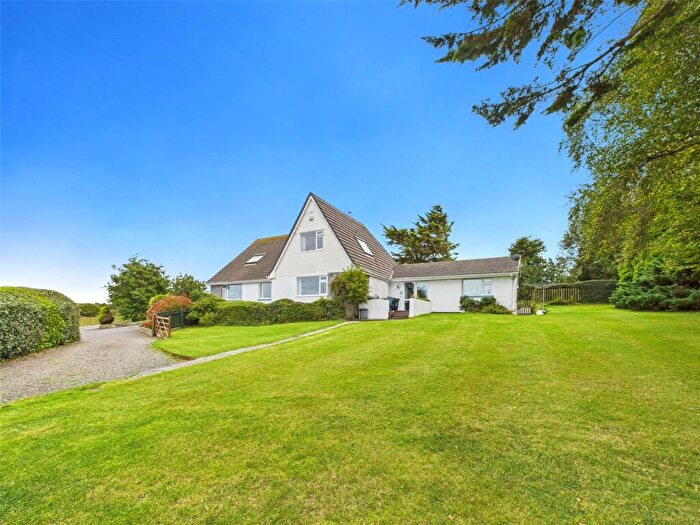
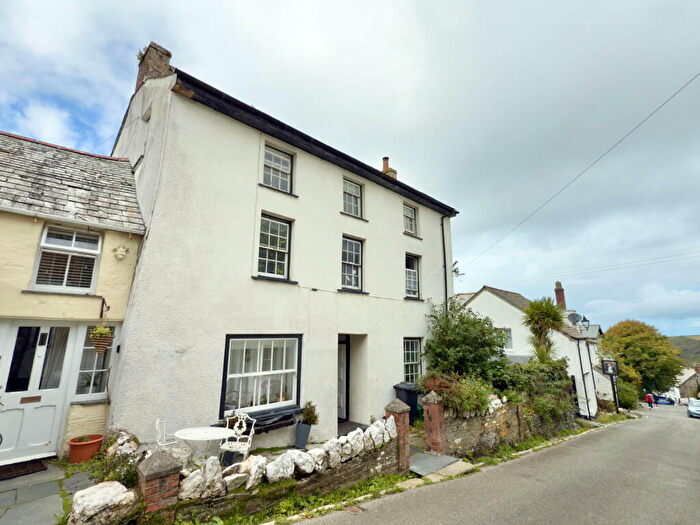
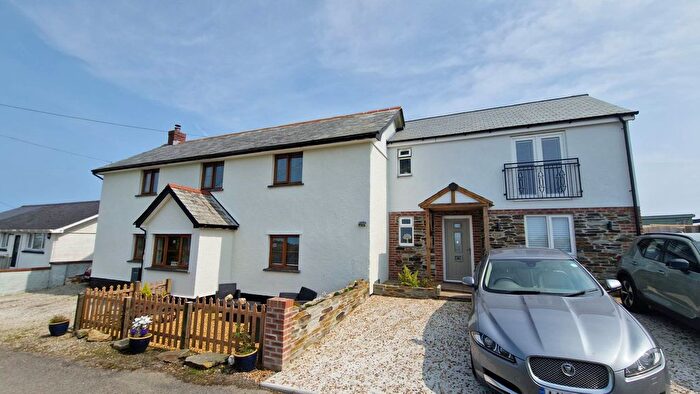
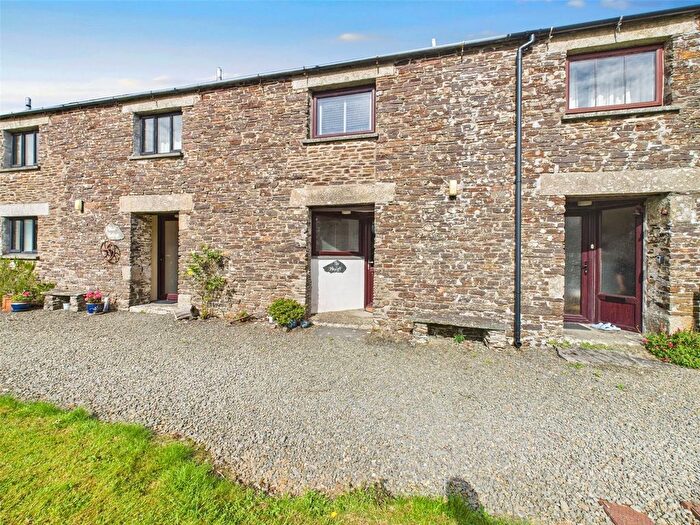
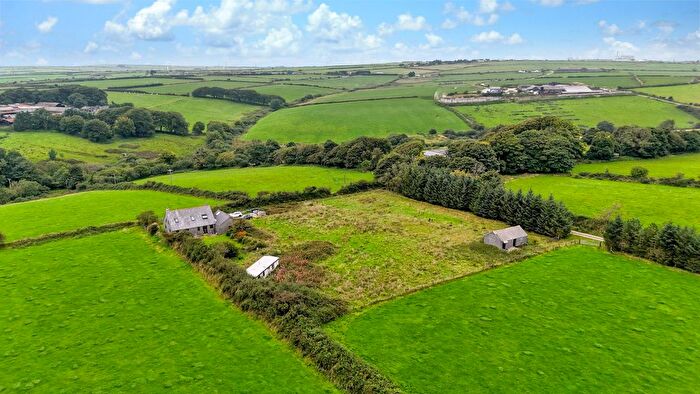
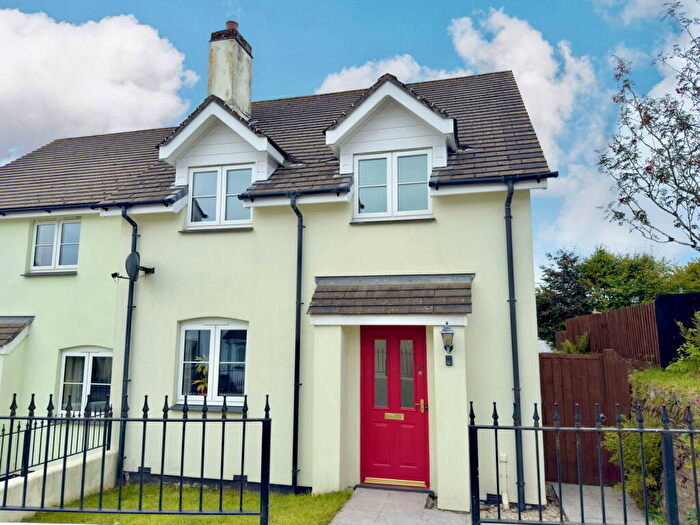
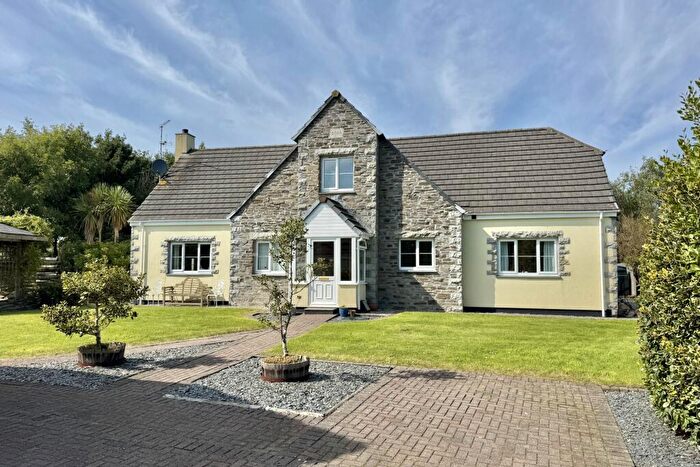
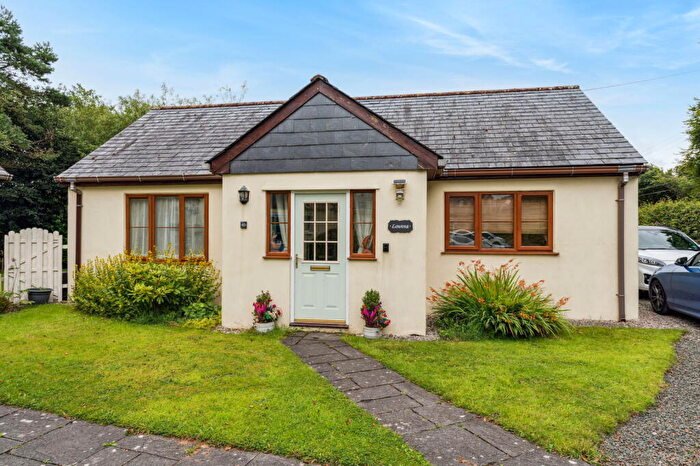
Properties for sale in Tintagel

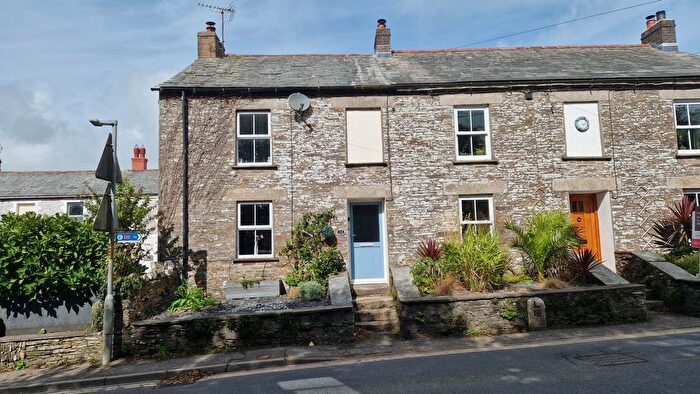

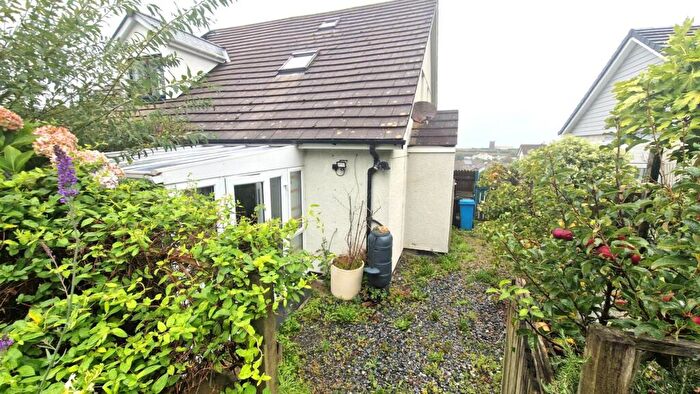

![]()
If you are looking to sell your house, let it out, or receive a property valuation, an expert can help you.
Click the button below to get started.


Roads and Postcodes in Tintagel
Navigate through our locations to find the location of your next house in Tintagel, Camelford for sale or to rent.
| Streets | Postcodes |
|---|---|
| Belah Meadows | PL32 9WH |
| Camelot View | PL32 9TU |
| Gunwennap | PL32 9SU |
| Marshgate | PL32 9YN PL32 9YW |
| Mowbray Mews | PL32 9TF |
| Otters Way | PL32 9AH |
| Slaughter Bridge | PL32 9TT |
| Trehaze Na Close | PL32 9YL |
| Westwinds | PL32 9SN |
| PL32 9SE PL32 9SJ PL32 9SL PL32 9SS PL32 9ST PL32 9SW PL32 9SX PL32 9SY PL32 9SZ PL32 9TA PL32 9TY PL32 9TZ PL32 9UB PL32 9YP PL32 9YR PL32 9SP PL32 9SR PL32 9TQ PL32 9UA |
Transport near Tintagel
-
 Bodmin Parkway Station
 -
Coombe Junction Halt Station
-
Liskeard Station
-
Lostwithiel Station
-
St.Keyne Wishing Well Halt Station
-
Menheniot Station
- FAQ
- Price Paid By Year
- Property Type Price
Frequently asked questions about Tintagel
What is the average price for a property for sale in Tintagel?
The average price for a property for sale in Tintagel is £382,775. This amount is 34% higher than the average price in Camelford. There are 737 property listings for sale in Tintagel.
What streets have the most expensive properties for sale in Tintagel?
The streets with the most expensive properties for sale in Tintagel are Trehaze Na Close at an average of £590,000 and Marshgate at an average of £543,000.
What streets have the most affordable properties for sale in Tintagel?
The street with the most affordable properties for sale in Tintagel is Mowbray Mews at an average of £154,916.
Which train stations are available in or near Tintagel?
Some of the train stations available in or near Tintagel are Bodmin Parkway, Coombe Junction Halt and Liskeard.
Property Price Paid in Tintagel by Year
The average sold property price by year was:
| Year | Average Sold Price | Price Change |
Sold Properties
|
|---|---|---|---|
| 2025 | £242,500 | -79% |
2 Properties |
| 2024 | £434,777 | 1% |
9 Properties |
| 2023 | £428,750 | 17% |
4 Properties |
| 2022 | £354,207 | 1% |
13 Properties |
| 2021 | £350,027 | -34% |
18 Properties |
| 2020 | £467,908 | 28% |
6 Properties |
| 2019 | £335,552 | 24% |
9 Properties |
| 2018 | £253,964 | 4% |
14 Properties |
| 2017 | £244,300 | -5% |
10 Properties |
| 2016 | £257,296 | -5% |
15 Properties |
| 2015 | £270,993 | 0,1% |
8 Properties |
| 2014 | £270,763 | -12% |
11 Properties |
| 2013 | £303,400 | 11% |
5 Properties |
| 2012 | £270,557 | 22% |
13 Properties |
| 2011 | £210,300 | -51% |
5 Properties |
| 2010 | £317,806 | 49% |
8 Properties |
| 2009 | £160,990 | -85% |
5 Properties |
| 2008 | £297,666 | 15% |
3 Properties |
| 2007 | £253,995 | -5% |
10 Properties |
| 2006 | £265,962 | 10% |
16 Properties |
| 2005 | £240,444 | 17% |
9 Properties |
| 2004 | £198,932 | 10% |
17 Properties |
| 2003 | £178,666 | 7% |
18 Properties |
| 2002 | £165,933 | 35% |
15 Properties |
| 2001 | £107,046 | 0,3% |
15 Properties |
| 2000 | £106,777 | 11% |
9 Properties |
| 1999 | £95,368 | 5% |
20 Properties |
| 1998 | £90,300 | 11% |
10 Properties |
| 1997 | £80,713 | 19% |
14 Properties |
| 1996 | £65,090 | 28% |
11 Properties |
| 1995 | £46,666 | - |
9 Properties |
Property Price per Property Type in Tintagel
Here you can find historic sold price data in order to help with your property search.
The average Property Paid Price for specific property types in the last three years are:
| Property Type | Average Sold Price | Sold Properties |
|---|---|---|
| Semi Detached House | £293,333.00 | 3 Semi Detached Houses |
| Detached House | £454,160.00 | 20 Detached Houses |
| Terraced House | £150,900.00 | 5 Terraced Houses |