
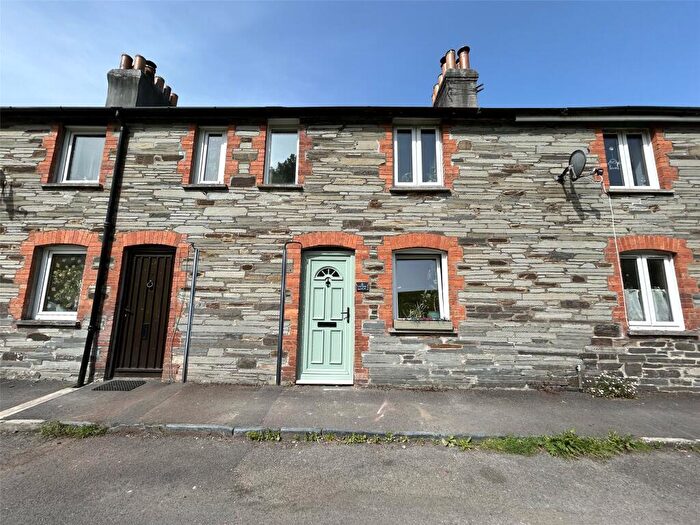
Houses for sale in PL15 7BL, Garfield Villas, Launceston Central, Launceston
House Prices in PL15 7BL, Garfield Villas, Launceston Central
Properties in PL15 7BL have no sales history available within the last 3 years. PL15 7BL is a postcode in Garfield Villas located in Launceston Central, an area in Launceston, Cornwall, with 2 households².
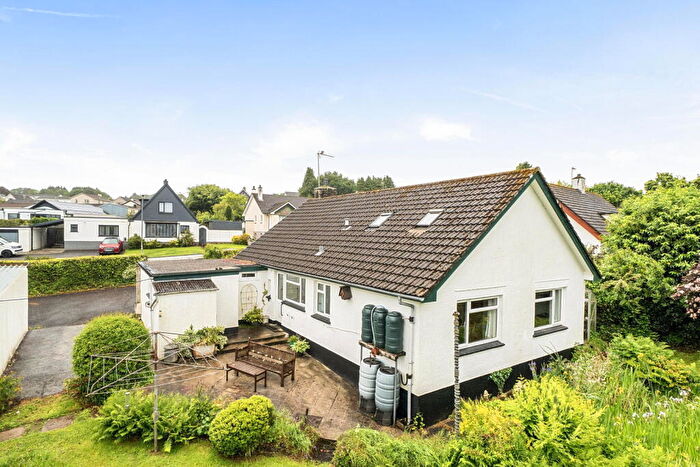
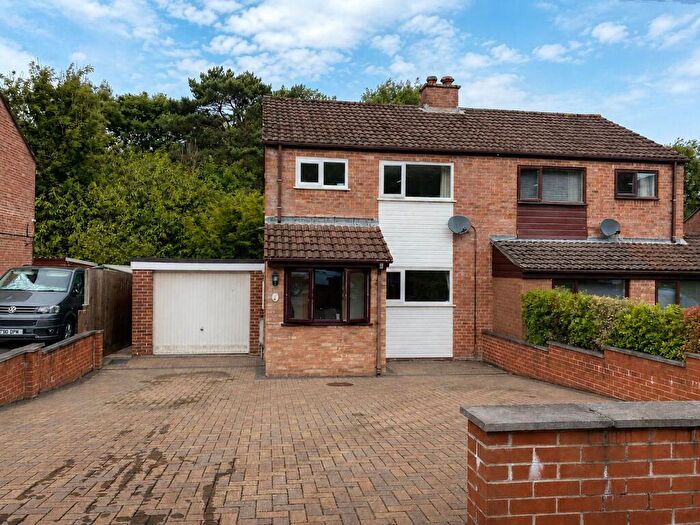
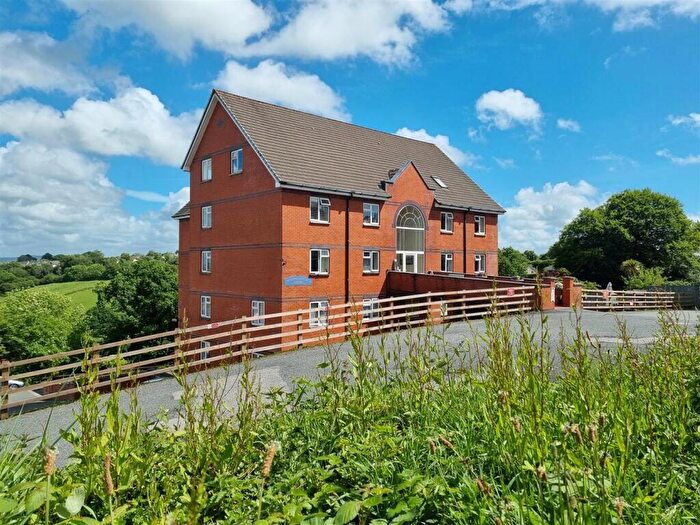
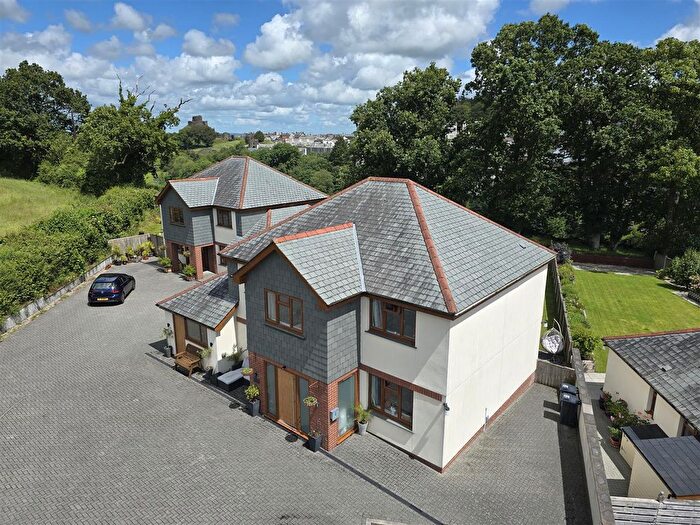
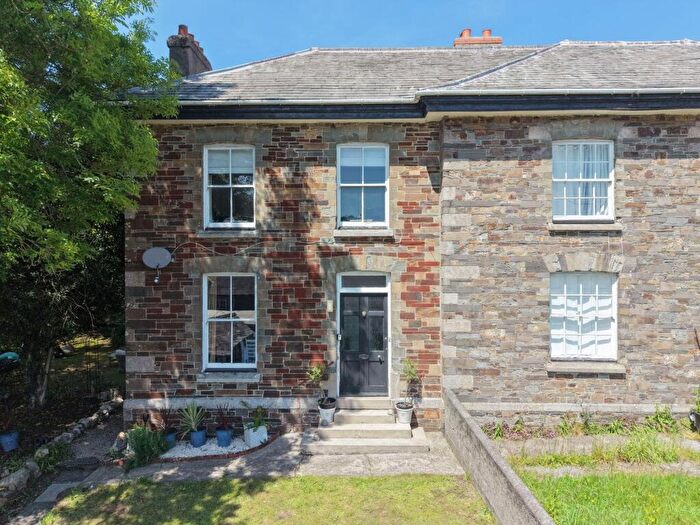
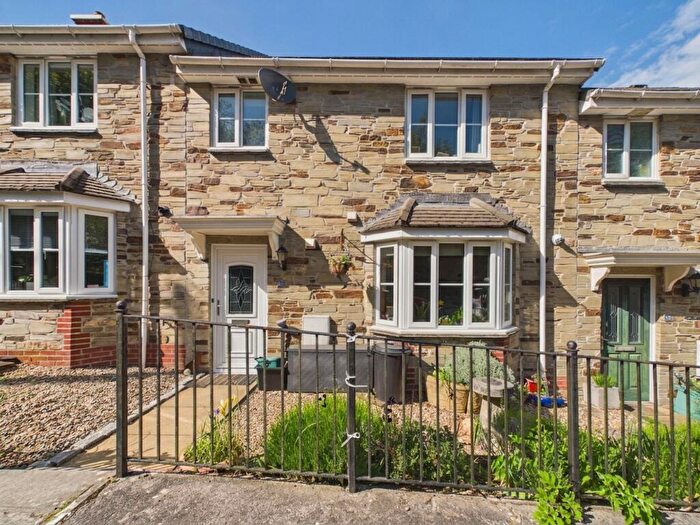
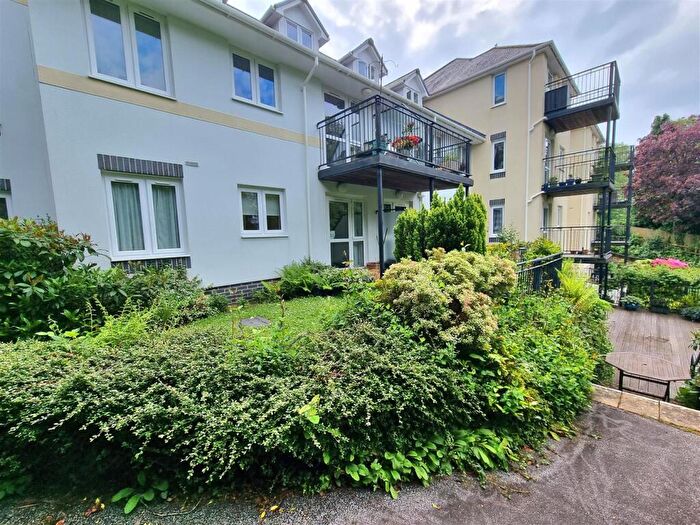
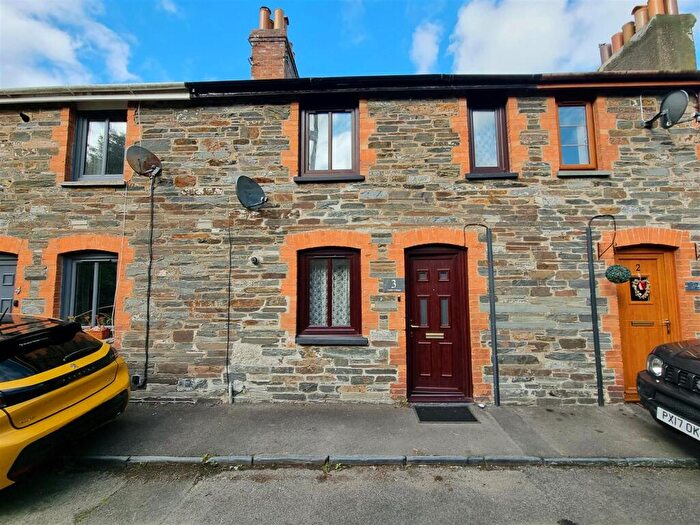
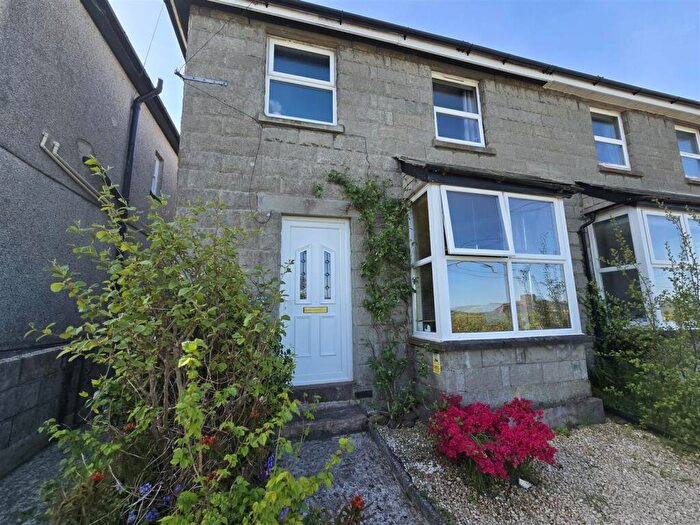
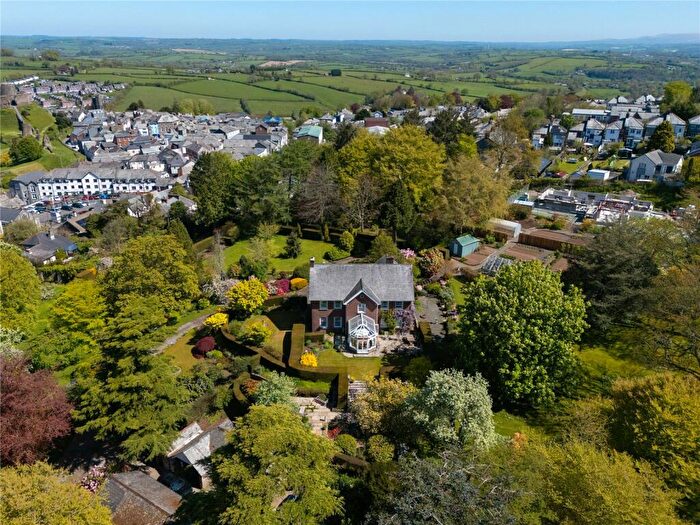
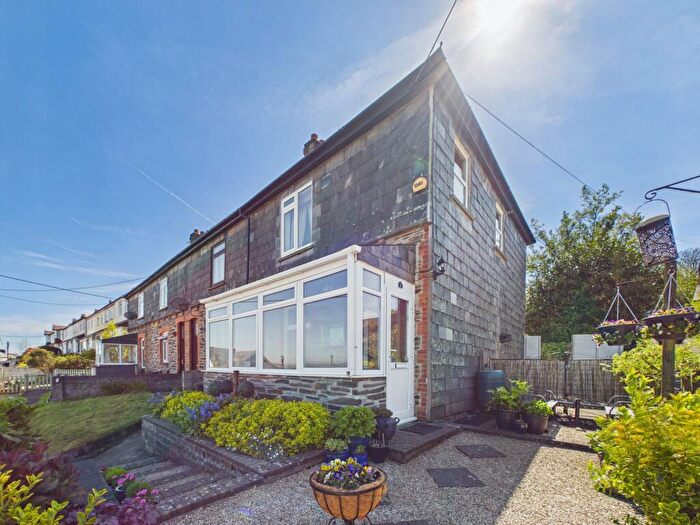
Properties for sale near PL15 7BL, Garfield Villas
![]()
If you are looking to sell your house, let it out, or receive a property valuation, an expert can help you.
Click the button below to get started.
Price Paid in Garfield Villas, PL15 7BL, Launceston Central
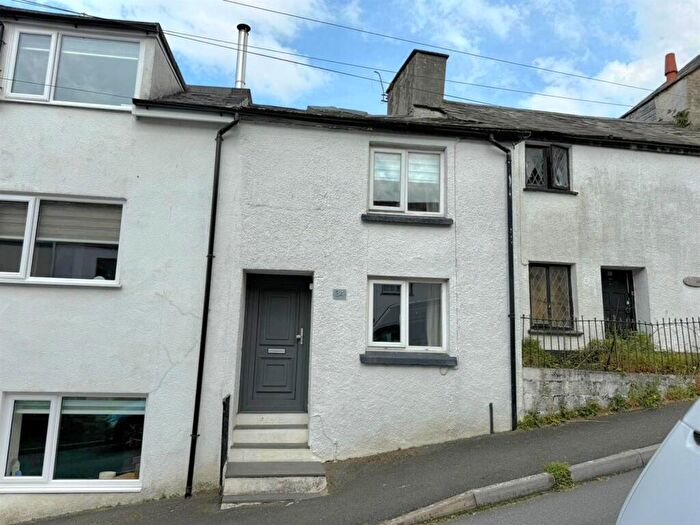
2 Garfield Villas, PL15 7BL, Launceston Central Launceston
Property 2 has been sold 3 times. The last time it was sold was in 27/05/2022 and the sold price was £150,000.00.
This terraced house, sold as a freehold on 27/05/2022, is a 111 sqm semi-detached house with an EPC rating of D.
| Date | Price | Property Type | Tenure | Classification |
|---|---|---|---|---|
| 27/05/2022 | £150,000.00 | Terraced House | freehold | Established Building |
| 18/08/2004 | £115,000.00 | Terraced House | freehold | Established Building |
| 26/01/1996 | £18,000.00 | Terraced House | freehold | Established Building |
1 Garfield Villas, PL15 7BL, Launceston Central Launceston
Property 1 has been sold 1 time. The last time it was sold was in 07/09/2012 and the sold price was £85,000.00.
This semi detached house, sold as a freehold on 07/09/2012, is a 115 sqm semi-detached house with an EPC rating of E.
| Date | Price | Property Type | Tenure | Classification |
|---|---|---|---|---|
| 07/09/2012 | £85,000.00 | Semi Detached House | freehold | Established Building |
Property price trends in PL15 7BL, Garfield Villas
According to the latest Land Registry data, the average home in PL15 7BL, Garfield Villas sold for £150,000 in 2022. That figure comes from 4 sales logged over the past 26 years.
Zoom out to the past decade for the fuller picture. Back in 2012, homes here averaged £85,000, so the typical sold price has climbed about 76.5% since then, roughly 5.8% a year.
Property Price Paid in PL15 7BL, Garfield Villas by Year
The average sold property price by year was:
| Year | Average Sold Price | Price Change |
Sold Properties
|
|---|---|---|---|
| 2022 | £150,000 | 43% |
1 Property |
| 2012 | £85,000 | -35% |
1 Property |
| 2004 | £115,000 | 84% |
1 Property |
| 1996 | £18,000 | - |
1 Property |
