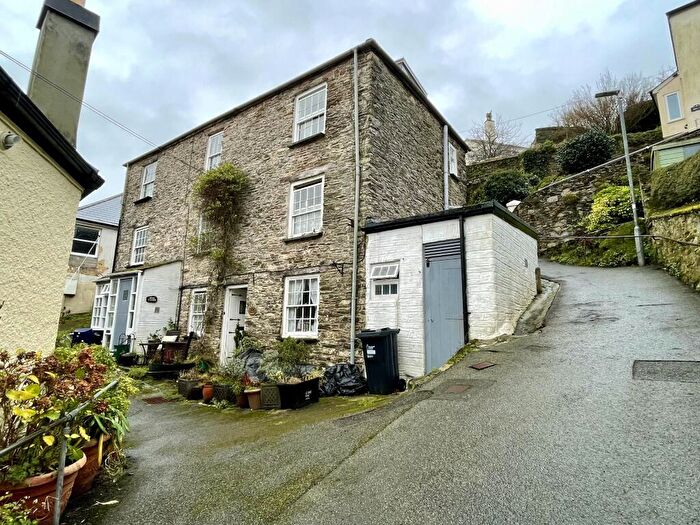
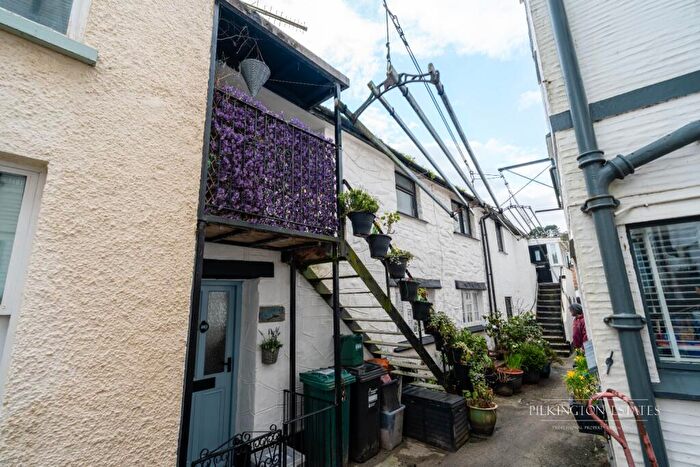
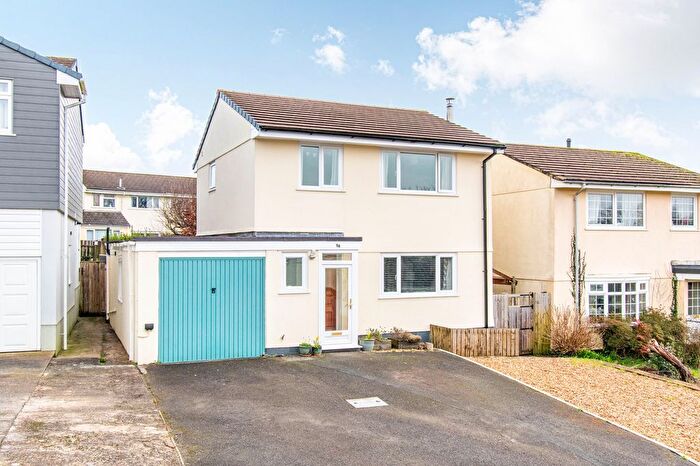
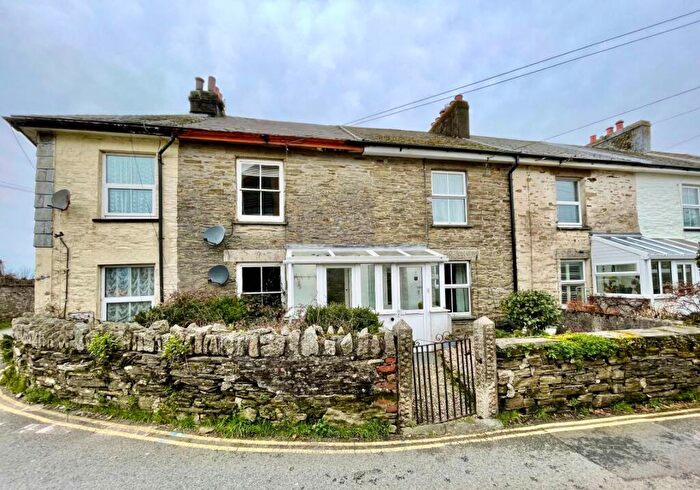
Houses for sale & to rent in Trelawny, Looe
House Prices in Trelawny
Properties in Trelawny have an average house price of £320,577.00 and had 77 Property Transactions within the last 3 years¹.
Trelawny is an area in Looe, Cornwall with 1,010 households², where the most expensive property was sold for £779,140.00.
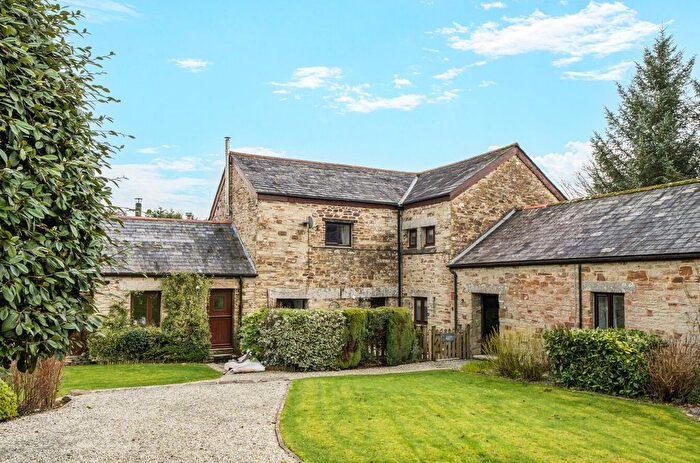
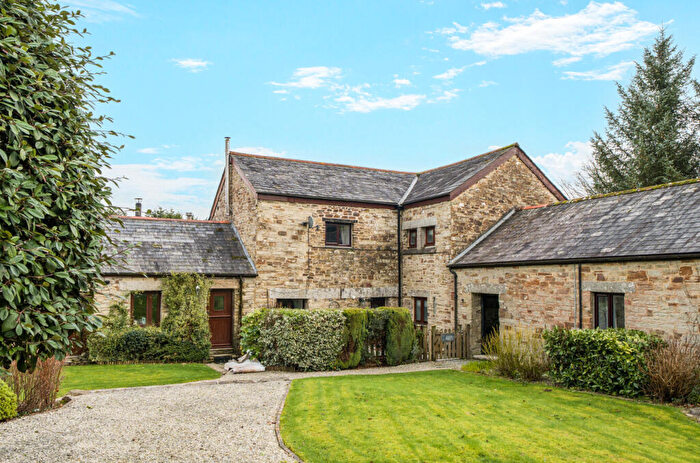
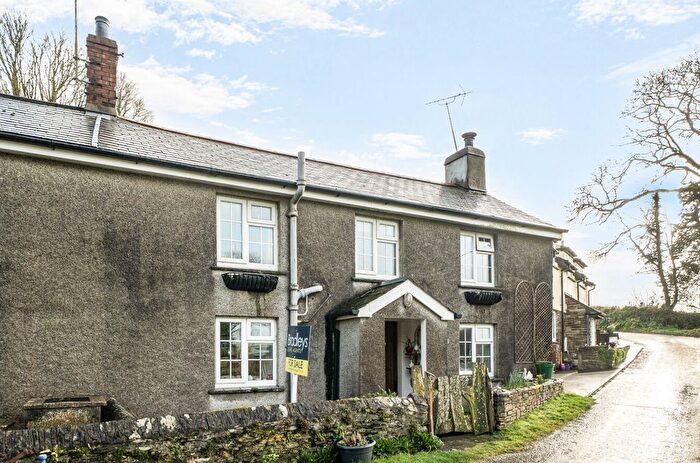
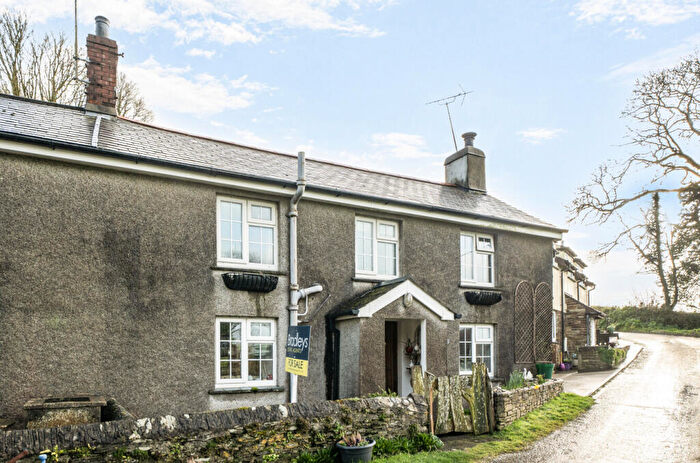
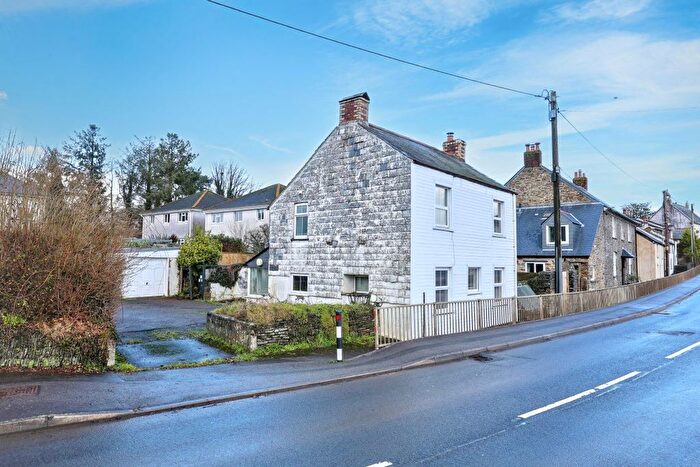
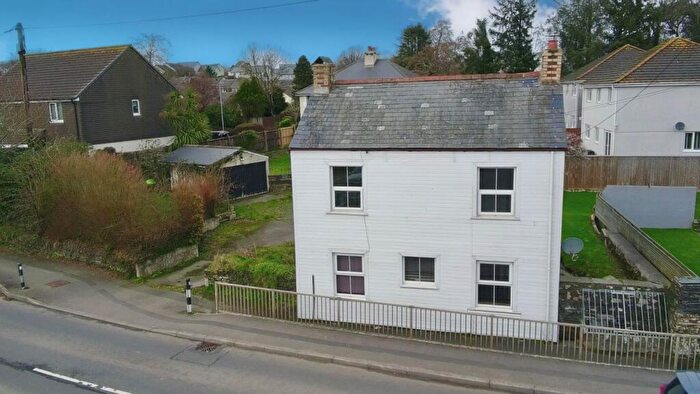
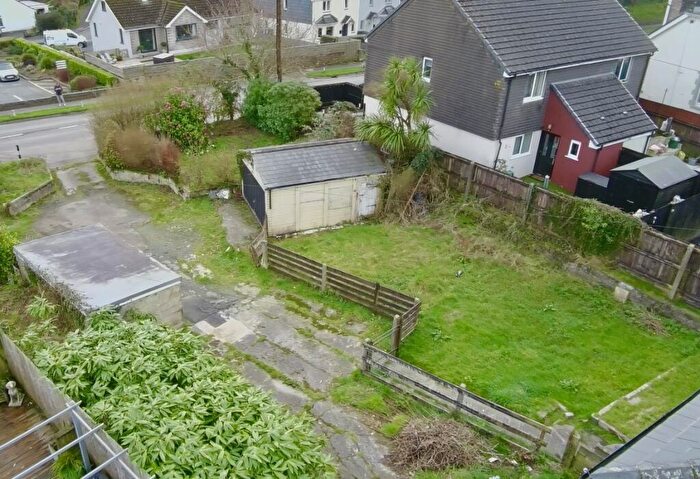
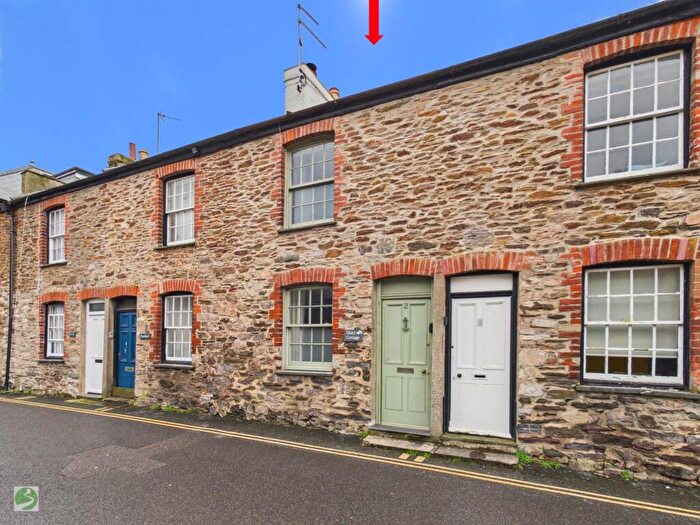
Properties for sale in Trelawny
Roads and Postcodes in Trelawny
Navigate through our locations to find the location of your next house in Trelawny, Looe for sale or to rent.
| Streets | Postcodes |
|---|---|
| Barton Meadow | PL13 2LW |
| Beacon Park | PL13 2PQ |
| Buller Terrace | PL13 2LD |
| Cardwen Estate | PL13 2LH PL13 2LJ |
| Carlyon Close | PL13 2FB |
| Farriers Way | PL13 1FL |
| Glebe Close | PL13 2HS |
| Grylls Park | PL13 2NG |
| Harding Meadow | PL13 1QX |
| Jubilee Hill | PL13 2JZ |
| Jubilee Terrace | PL13 2LQ |
| Luffman Close | PL13 2LR |
| Lydcott Close | PL13 1QF |
| Lydcott Crescent | PL13 1QG |
| Meadow Road | PL13 2NS |
| Meadow View | PL13 1AG |
| Morview Road | PL13 1QE |
| Mount Pleasant Cottages | PL13 2PD |
| No Mans Land | PL13 1PQ PL13 1PX |
| Old School Row | PL13 2FL |
| Polperro Road | PL13 2JS |
| Rally Close | PL13 2FH |
| Rectory Gardens | PL13 2TA |
| Richmond Road | PL13 2NH |
| Sandplace | PL13 1PH PL13 1PJ |
| Shortacross View | PL13 1QY |
| Sowdens Bridge | PL13 2GZ |
| Springfield Park | PL13 1QT |
| St Marnarchs | PL13 2NL |
| St Marnarchs Road | PL13 2NR |
| Summer Lane | PL13 2LP PL13 2FN |
| Summer Lane Park | PL13 2JW |
| Tower Close | PL13 2NQ |
| Tower Park | PL13 2LL PL13 2LN |
| Tregarland Bridge | PL13 1PL |
| Tregarrick Way | PL13 2NN |
| Trelawne Cottage Gardens | PL13 2TG |
| Trelawne Cross | PL13 2BT |
| Trelawne Gardens | PL13 2TR |
| Trelawny Close | PL13 2FF |
| Tremayne Terrace | PL13 1QW |
| Trenant Point | PL13 2AA |
| Tretharrup | PL13 2NZ |
| Wilton Terrace | PL13 2LE |
| Windwards Close | PL13 2WP |
| Winsor Estate | PL13 2JY |
| PL13 1PN PL13 1PP PL13 1PR PL13 1PY PL13 1PZ PL13 1QA PL13 1QB PL13 1QD PL13 1QJ PL13 1QL PL13 1QN PL13 2JU PL13 2JX PL13 2LA PL13 2LB PL13 2LF PL13 2LG PL13 2LS PL13 2LU PL13 2LX PL13 2LY PL13 2NA PL13 2NB PL13 2NT PL13 2NU PL13 2NW PL13 2NX PL13 2NY PL13 2PA PL13 2PG PL13 2QH PL13 2QQ PL13 2LT PL13 2LZ PL13 2ND PL13 2NP PL13 2PB PL13 2PE PL13 2QG PL13 2RW |
Transport near Trelawny
- FAQ
- Price Paid By Year
- Property Type Price
Frequently asked questions about Trelawny
What is the average price for a property for sale in Trelawny?
The average price for a property for sale in Trelawny is £320,577. This amount is 0.64% lower than the average price in Looe. There are 3,662 property listings for sale in Trelawny.
What streets have the most expensive properties for sale in Trelawny?
The streets with the most expensive properties for sale in Trelawny are Rectory Gardens at an average of £510,000, Sandplace at an average of £505,333 and Rally Close at an average of £415,000.
What streets have the most affordable properties for sale in Trelawny?
The streets with the most affordable properties for sale in Trelawny are Shortacross View at an average of £66,000, Trelawny Close at an average of £116,400 and Wilton Terrace at an average of £180,000.
Which train stations are available in or near Trelawny?
Some of the train stations available in or near Trelawny are Sandplace, Looe and Causeland.
Property Price Paid in Trelawny by Year
The average sold property price by year was:
| Year | Average Sold Price | Price Change |
Sold Properties
|
|---|---|---|---|
| 2025 | £309,632 | 15% |
29 Properties |
| 2024 | £264,571 | -42% |
21 Properties |
| 2023 | £375,892 | 4% |
27 Properties |
| 2022 | £361,920 | 17% |
32 Properties |
| 2021 | £298,658 | -7% |
57 Properties |
| 2020 | £318,540 | 16% |
49 Properties |
| 2019 | £267,177 | -5% |
50 Properties |
| 2018 | £279,898 | 7% |
37 Properties |
| 2017 | £261,393 | 1% |
47 Properties |
| 2016 | £258,292 | 12% |
40 Properties |
| 2015 | £228,233 | 1% |
34 Properties |
| 2014 | £225,311 | 4% |
48 Properties |
| 2013 | £216,105 | 0,5% |
38 Properties |
| 2012 | £215,048 | -4% |
25 Properties |
| 2011 | £224,258 | 3% |
24 Properties |
| 2010 | £218,208 | 0,1% |
35 Properties |
| 2009 | £218,036 | -21% |
25 Properties |
| 2008 | £264,872 | 2% |
24 Properties |
| 2007 | £260,608 | 16% |
51 Properties |
| 2006 | £220,012 | -4% |
44 Properties |
| 2005 | £229,646 | 0,4% |
27 Properties |
| 2004 | £228,625 | 18% |
43 Properties |
| 2003 | £187,647 | 13% |
37 Properties |
| 2002 | £162,649 | 23% |
53 Properties |
| 2001 | £125,782 | 21% |
42 Properties |
| 2000 | £99,044 | 13% |
45 Properties |
| 1999 | £86,217 | 6% |
45 Properties |
| 1998 | £81,054 | -2% |
34 Properties |
| 1997 | £82,971 | 18% |
42 Properties |
| 1996 | £68,295 | 5% |
44 Properties |
| 1995 | £64,653 | - |
33 Properties |
Property Price per Property Type in Trelawny
Here you can find historic sold price data in order to help with your property search.
The average Property Paid Price for specific property types in the last three years are:
| Property Type | Average Sold Price | Sold Properties |
|---|---|---|
| Semi Detached House | £266,577.00 | 14 Semi Detached Houses |
| Detached House | £390,056.00 | 46 Detached Houses |
| Terraced House | £175,316.00 | 15 Terraced Houses |
| Flat | £190,000.00 | 2 Flats |

