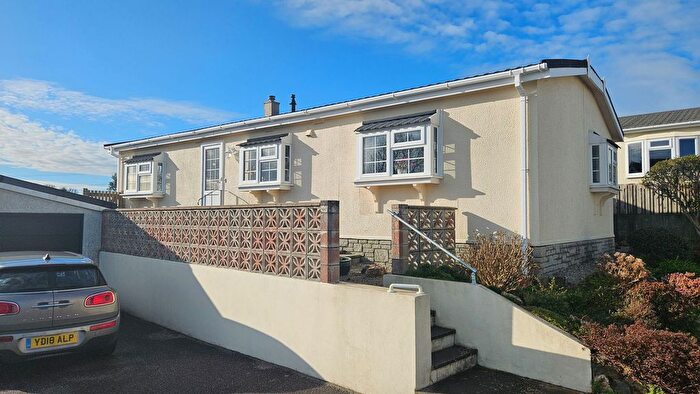
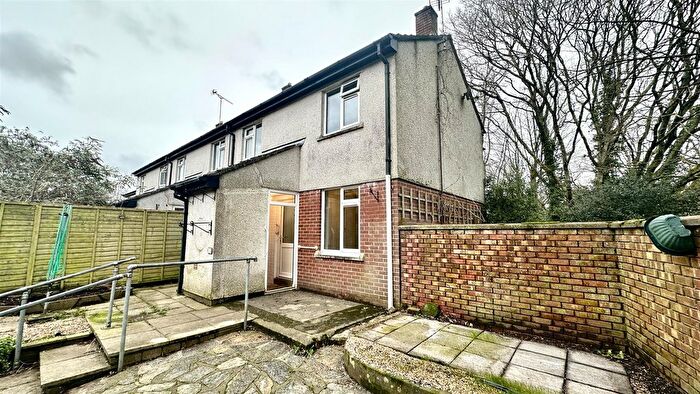
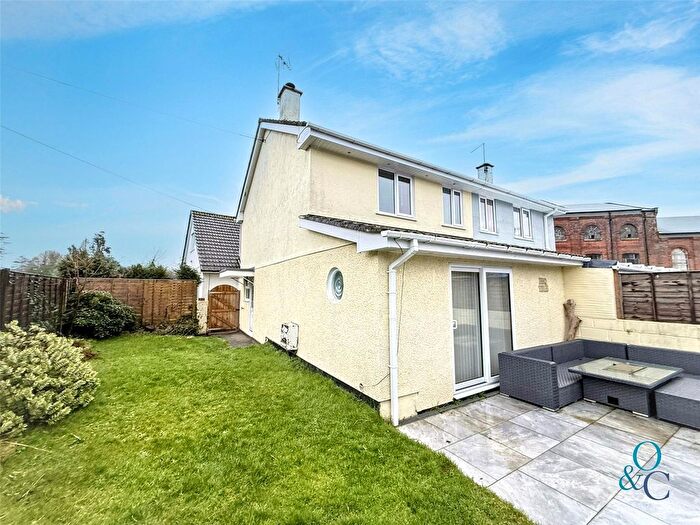
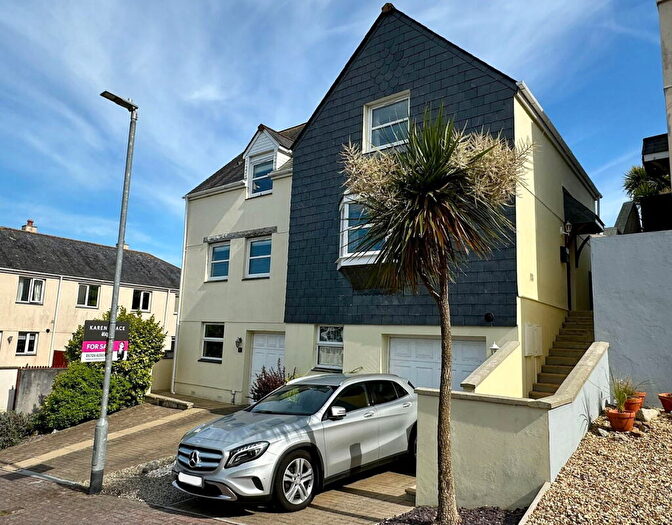
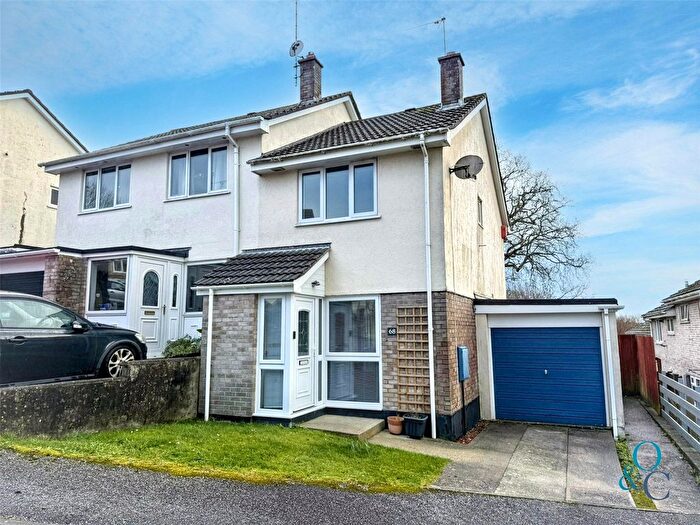
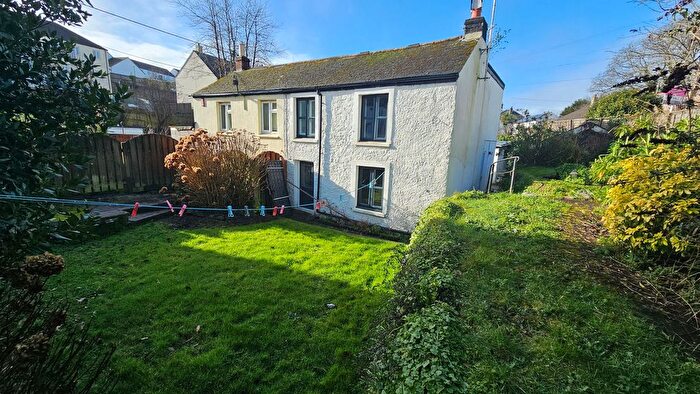
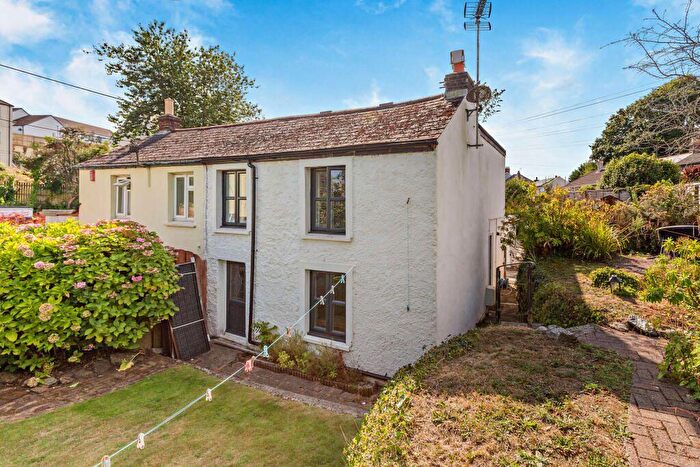
Houses for sale & to rent in Fowey And Tywardreath, Par
House Prices in Fowey And Tywardreath
Properties in Fowey And Tywardreath have an average house price of £330,805.00 and had 72 Property Transactions within the last 3 years¹.
Fowey And Tywardreath is an area in Par, Cornwall with 796 households², where the most expensive property was sold for £705,000.00.
Properties for sale in Fowey And Tywardreath
Roads and Postcodes in Fowey And Tywardreath
Navigate through our locations to find the location of your next house in Fowey And Tywardreath, Par for sale or to rent.
| Streets | Postcodes |
|---|---|
| Anjardyn Place | PL24 2PJ |
| Belmont Street | PL24 2PP |
| Castledore Road | PL24 2TR |
| Church Street | PL24 2QG PL24 2QQ |
| Driving Lane | PL24 2RH |
| Elderfield Close | PL24 2PX |
| Fore Street | PL24 2QP |
| Glenview | PL24 2PR |
| Legion Lane | PL24 2QR |
| Mount Bennett Road | PL24 2QU PL24 2QX |
| Mount Bennett Terrace | PL24 2QY |
| North Street | PL24 2PN PL24 2PW |
| Nursery Close | PL24 2QW |
| Penstrasse Place | PL24 2QL |
| Poldrea | PL24 2RA PL24 2RB |
| Polmear Hill | PL24 2AR PL24 2TJ |
| Polpey Lane | PL24 2TP |
| Priory Close | PL24 2PG |
| Priory Lane | PL24 2QF |
| Southpark Road | PL24 2PT PL24 2PU |
| St Andrews Road | PL24 2LU PL24 2LX PL24 2DJ |
| St Andrews Terrace | PL24 2LY |
| St Benedicts Place | PL24 2QE |
| St Sampsons Close | PL24 2QZ |
| Stockman Terrace | PL24 2QA |
| Swallowfield Close | PL24 2QB |
| Tehidy Road | PL24 2PE PL24 2PF PL24 2QD |
| Trenant Road | PL24 2QJ |
| Trevance Park | PL24 2PY |
| Vicarage Lane | PL24 2FD |
| Vicarage Road | PL24 2PH PL24 2PQ |
| Vine Place | PL24 2QS |
| Well Street | PL24 2QH PL24 2QN |
| Wood Lane | PL24 2PS |
| Woodland Avenue | PL24 2PL |
| PL24 2RS PL24 2TS PL24 2TT PL24 2TX PL24 2TY PL24 2UA PL24 2TL PL24 2TN PL24 2TZ |
Transport near Fowey And Tywardreath
- FAQ
- Price Paid By Year
- Property Type Price
Frequently asked questions about Fowey And Tywardreath
What is the average price for a property for sale in Fowey And Tywardreath?
The average price for a property for sale in Fowey And Tywardreath is £330,805. This amount is 27% higher than the average price in Par. There are 1,316 property listings for sale in Fowey And Tywardreath.
What streets have the most expensive properties for sale in Fowey And Tywardreath?
The streets with the most expensive properties for sale in Fowey And Tywardreath are Polpey Lane at an average of £504,500, Southpark Road at an average of £482,583 and Woodland Avenue at an average of £481,666.
What streets have the most affordable properties for sale in Fowey And Tywardreath?
The streets with the most affordable properties for sale in Fowey And Tywardreath are Priory Close at an average of £150,000, Poldrea at an average of £190,000 and Wood Lane at an average of £218,000.
Which train stations are available in or near Fowey And Tywardreath?
Some of the train stations available in or near Fowey And Tywardreath are Par, Luxulyan and Lostwithiel.
Property Price Paid in Fowey And Tywardreath by Year
The average sold property price by year was:
| Year | Average Sold Price | Price Change |
Sold Properties
|
|---|---|---|---|
| 2025 | £344,080 | 17% |
25 Properties |
| 2024 | £286,095 | -24% |
21 Properties |
| 2023 | £354,153 | 2% |
26 Properties |
| 2022 | £345,433 | 23% |
32 Properties |
| 2021 | £267,288 | -3% |
45 Properties |
| 2020 | £274,016 | 21% |
30 Properties |
| 2019 | £216,288 | -5% |
31 Properties |
| 2018 | £227,690 | 0,1% |
30 Properties |
| 2017 | £227,425 | 3% |
27 Properties |
| 2016 | £220,176 | -4% |
28 Properties |
| 2015 | £229,512 | 9% |
29 Properties |
| 2014 | £208,778 | -10% |
37 Properties |
| 2013 | £228,997 | 22% |
20 Properties |
| 2012 | £178,218 | -17% |
25 Properties |
| 2011 | £208,997 | 6% |
19 Properties |
| 2010 | £196,328 | 5% |
21 Properties |
| 2009 | £186,145 | -13% |
24 Properties |
| 2008 | £211,174 | -13% |
20 Properties |
| 2007 | £238,510 | 9% |
41 Properties |
| 2006 | £215,937 | -12% |
41 Properties |
| 2005 | £242,704 | 28% |
36 Properties |
| 2004 | £173,711 | 6% |
36 Properties |
| 2003 | £162,867 | 31% |
39 Properties |
| 2002 | £111,575 | 21% |
36 Properties |
| 2001 | £87,921 | -6% |
26 Properties |
| 2000 | £93,311 | 29% |
30 Properties |
| 1999 | £65,800 | 19% |
37 Properties |
| 1998 | £53,095 | 3% |
41 Properties |
| 1997 | £51,632 | 5% |
46 Properties |
| 1996 | £48,997 | 1% |
34 Properties |
| 1995 | £48,510 | - |
40 Properties |
Property Price per Property Type in Fowey And Tywardreath
Here you can find historic sold price data in order to help with your property search.
The average Property Paid Price for specific property types in the last three years are:
| Property Type | Average Sold Price | Sold Properties |
|---|---|---|
| Semi Detached House | £303,041.00 | 12 Semi Detached Houses |
| Detached House | £390,118.00 | 38 Detached Houses |
| Terraced House | £246,761.00 | 21 Terraced Houses |
| Flat | £175,000.00 | 1 Flat |

