
Houses for sale & to rent in TR10 9LP, Rame Common Cross, Crowan And Wendron, Penryn
House Prices in TR10 9LP, Rame Common Cross, Crowan And Wendron
Properties in TR10 9LP have no sales history available within the last 3 years. TR10 9LP is a postcode in Rame Common Cross located in Crowan And Wendron, an area in Penryn, Cornwall, with 4 households².
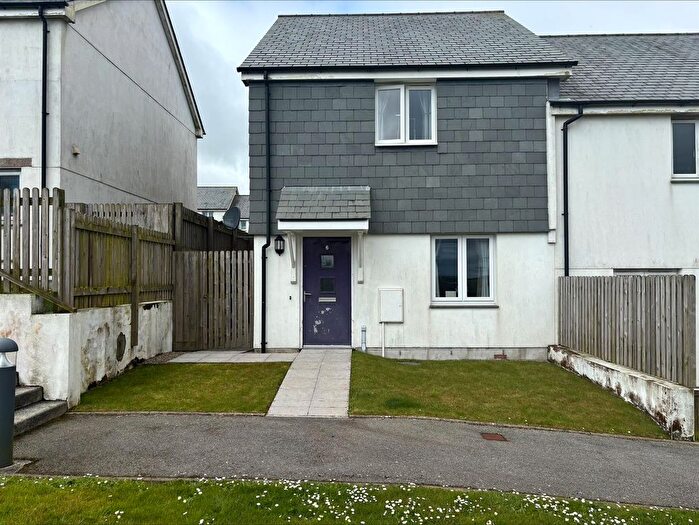
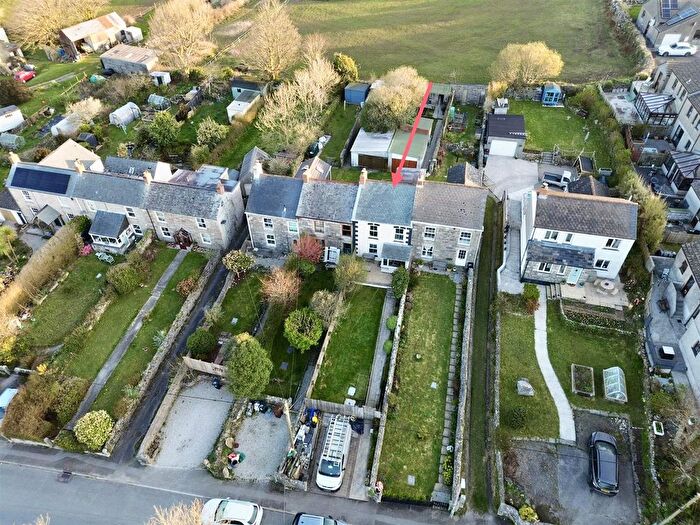
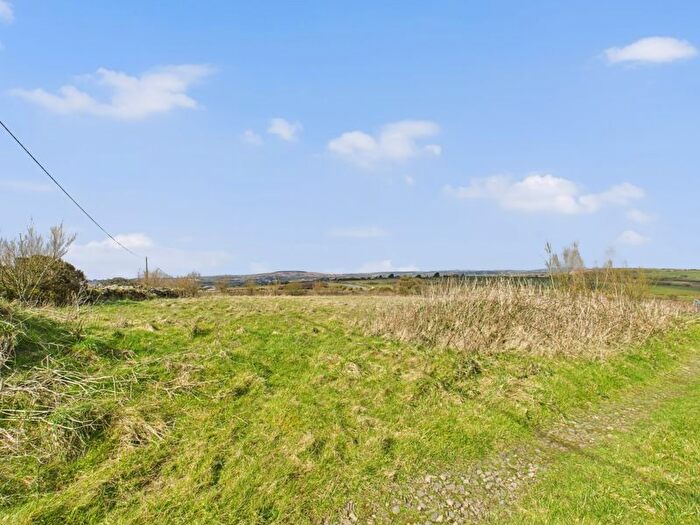
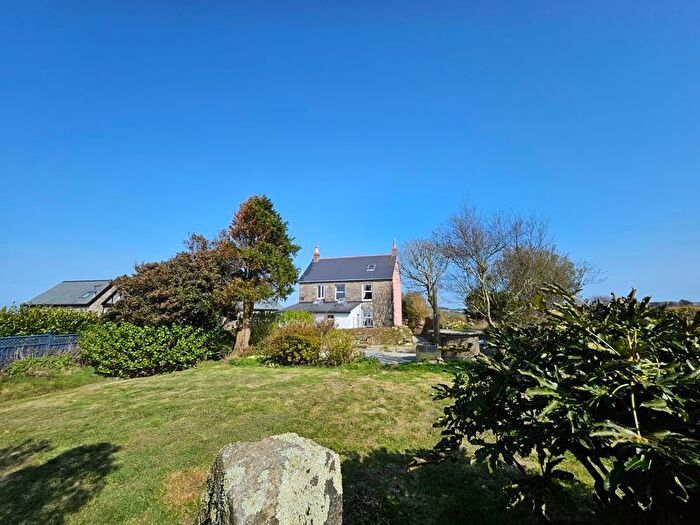
Previously listed properties near TR10 9LP, Rame Common Cross

![]()
If you are looking to sell your house, let it out, or receive a property valuation, an expert can help you.
Click the button below to get started.

Price Paid in Rame Common Cross, TR10 9LP, Crowan And Wendron
RAME COTTAGE Rame Common Cross, TR10 9LP, Crowan And Wendron Penryn
Property RAME COTTAGE has been sold 4 times. The last time it was sold was in 17/12/2018 and the sold price was £300,000.00.
This detached house, sold as a freehold on 17/12/2018, is a 103 sqm detached house with an EPC rating of F.
| Date | Price | Property Type | Tenure | Classification |
|---|---|---|---|---|
| 17/12/2018 | £300,000.00 | Detached House | freehold | Established Building |
| 27/11/2006 | £275,000.00 | Detached House | freehold | Established Building |
| 10/06/2005 | £230,000.00 | Detached House | freehold | Established Building |
| 26/01/1998 | £69,000.00 | Detached House | freehold | Established Building |
HALMARREN Rame Common Cross, TR10 9LP, Crowan And Wendron Penryn
Property HALMARREN has been sold 2 times. The last time it was sold was in 09/05/2007 and the sold price was £365,000.00.
This detached house, sold as a freehold on 09/05/2007, is a 144 sqm detached house with an EPC rating of G.
| Date | Price | Property Type | Tenure | Classification |
|---|---|---|---|---|
| 09/05/2007 | £365,000.00 | Detached House | freehold | Established Building |
| 21/03/2000 | £129,000.00 | Detached House | freehold | Established Building |
Transport near TR10 9LP, Rame Common Cross

House price paid reports for TR10 9LP, Rame Common Cross
Click on the buttons below to see price paid reports by year or property price:
- Price Paid By Year
Property Price Paid in TR10 9LP, Rame Common Cross by Year
The average sold property price by year was:
| Year | Average Sold Price | Price Change |
Sold Properties
|
|---|---|---|---|
| 2018 | £300,000 | -22% |
1 Property |
| 2007 | £365,000 | 25% |
1 Property |
| 2006 | £275,000 | 16% |
1 Property |
| 2005 | £230,000 | 44% |
1 Property |
| 2000 | £129,000 | 47% |
1 Property |
| 1998 | £69,000 | - |
1 Property |