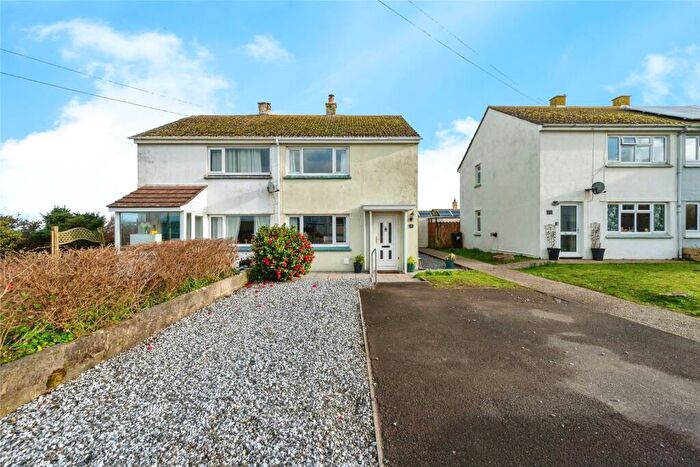
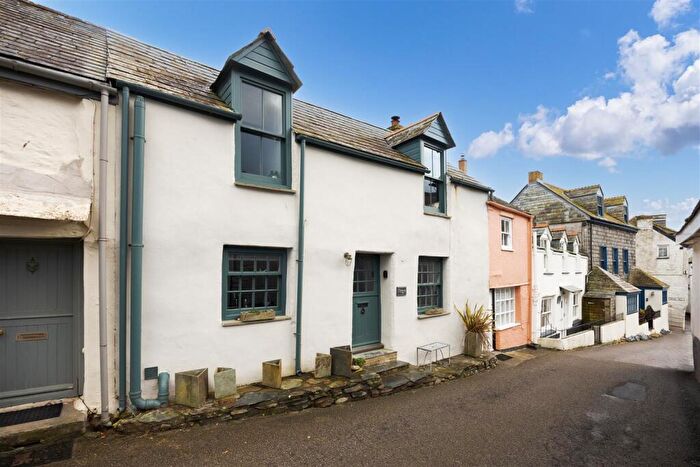
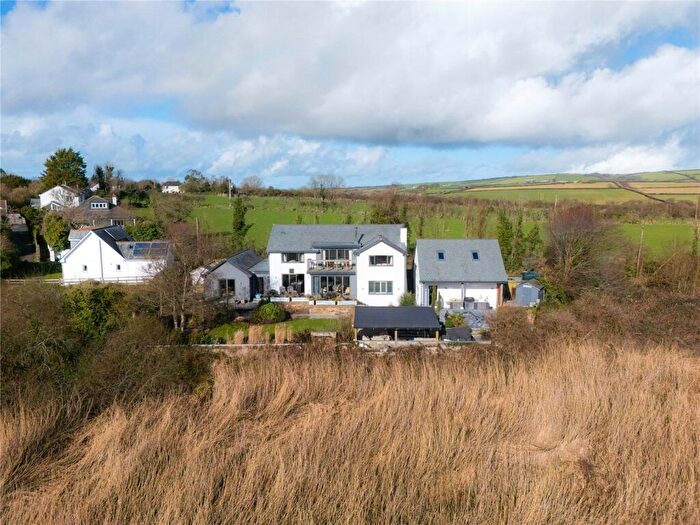
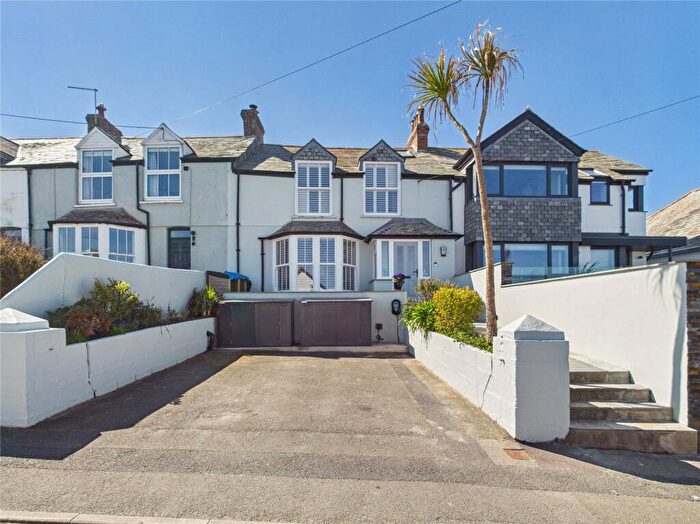
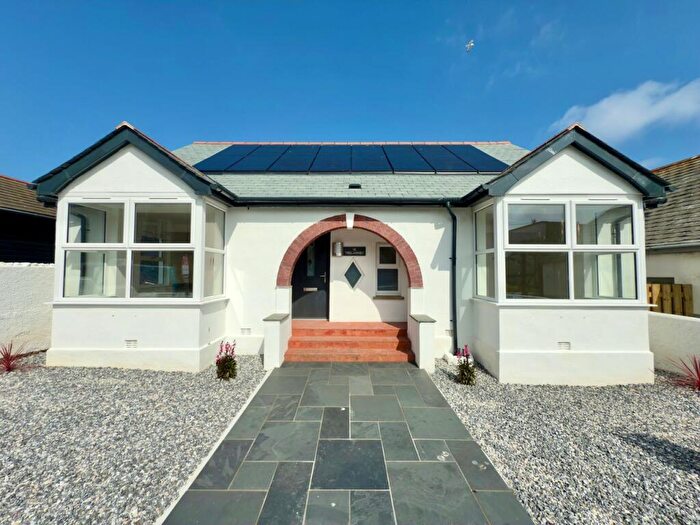
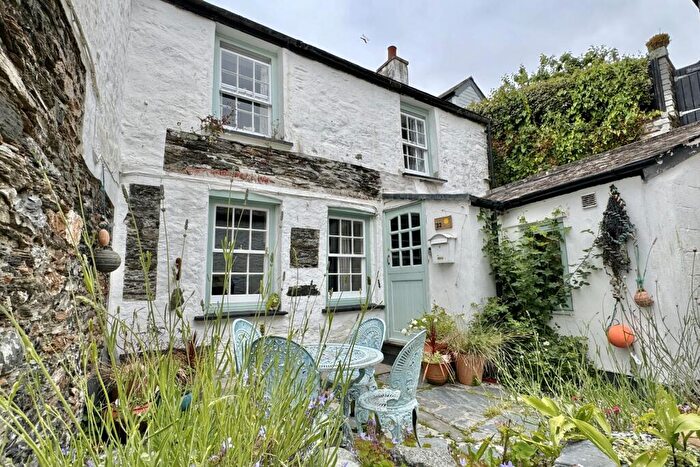
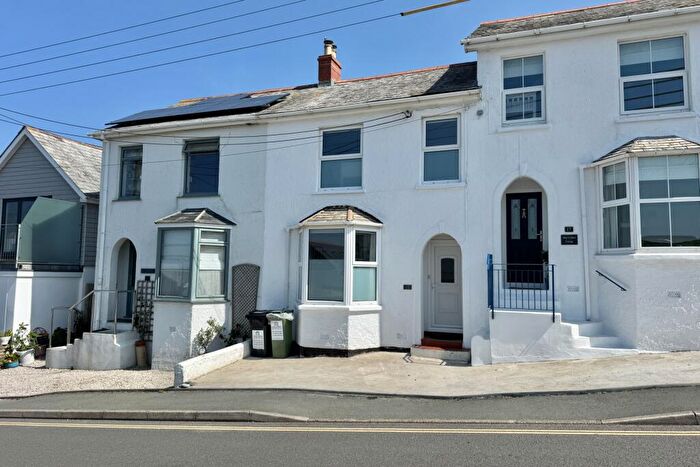
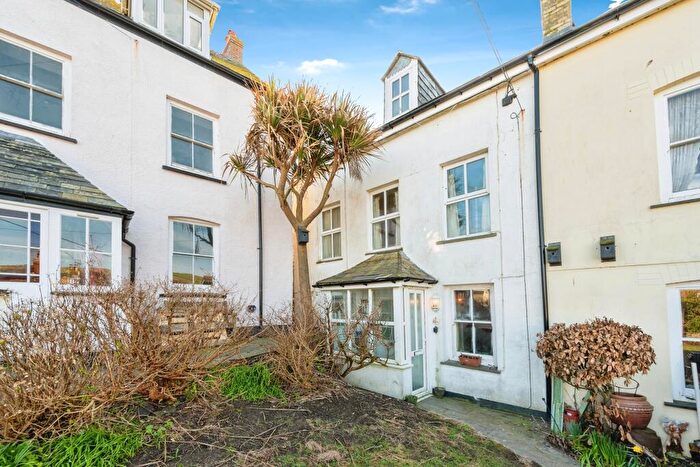
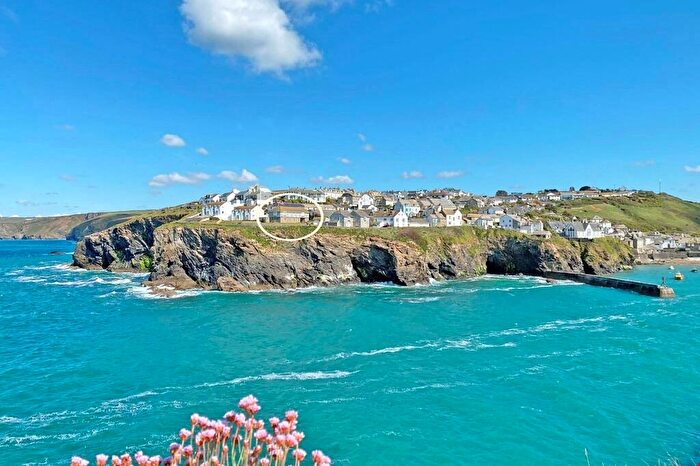
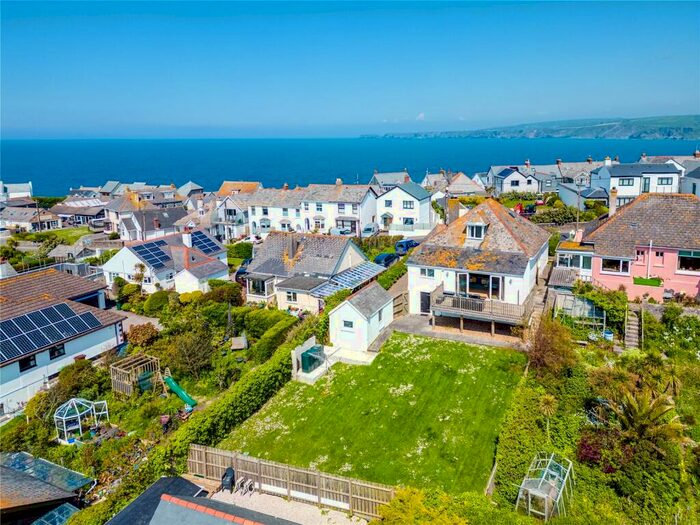
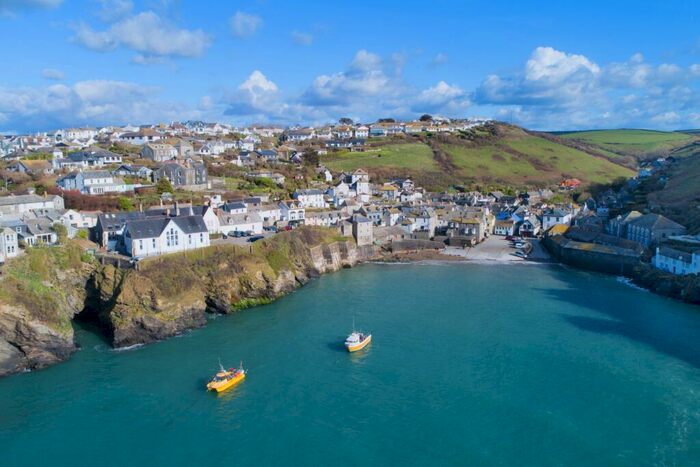
Houses for sale & to rent in St Minver And St Endellion, Port Isaac
House Prices in St Minver And St Endellion
Properties in St Minver And St Endellion have an average house price of £530,896.00 and had 56 Property Transactions within the last 3 years¹.
St Minver And St Endellion is an area in Port Isaac, Cornwall with 491 households², where the most expensive property was sold for £1,800,000.00.
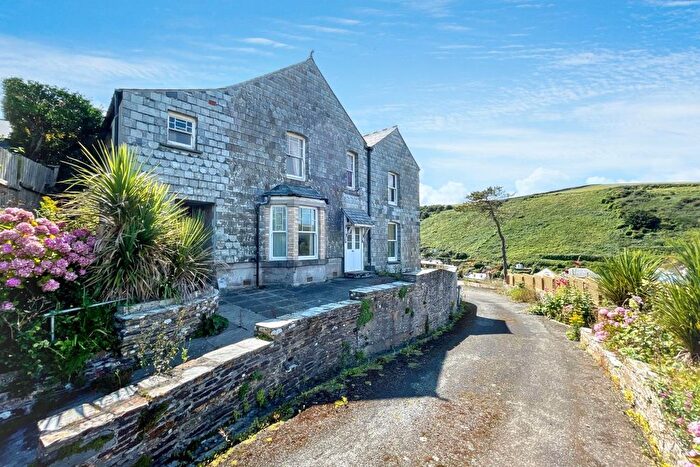
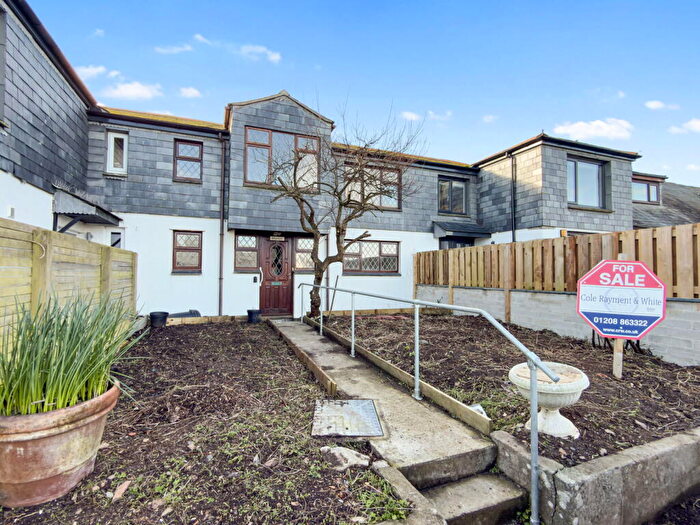
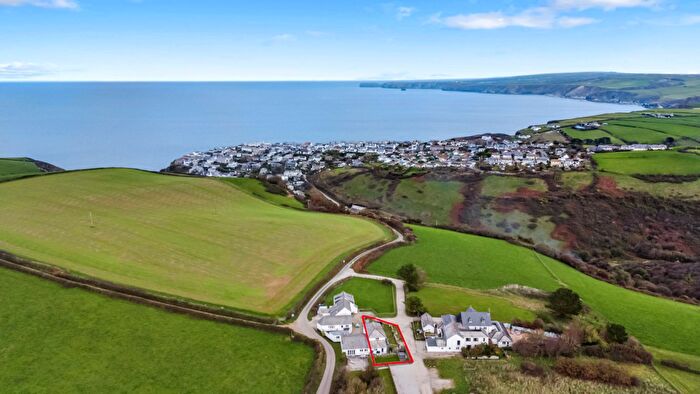
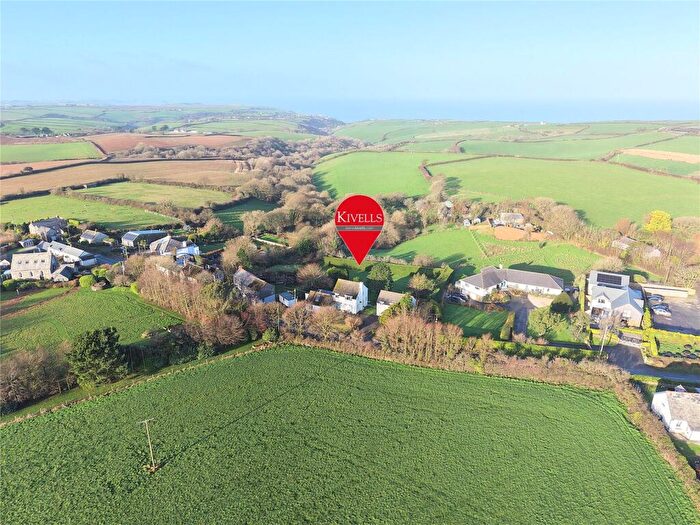
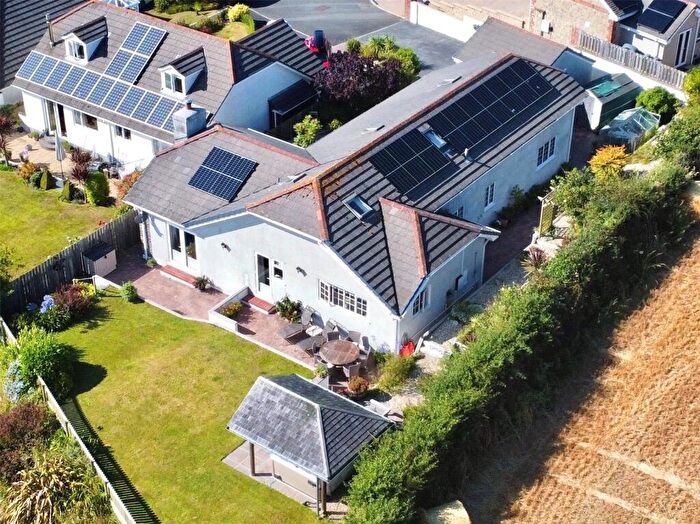
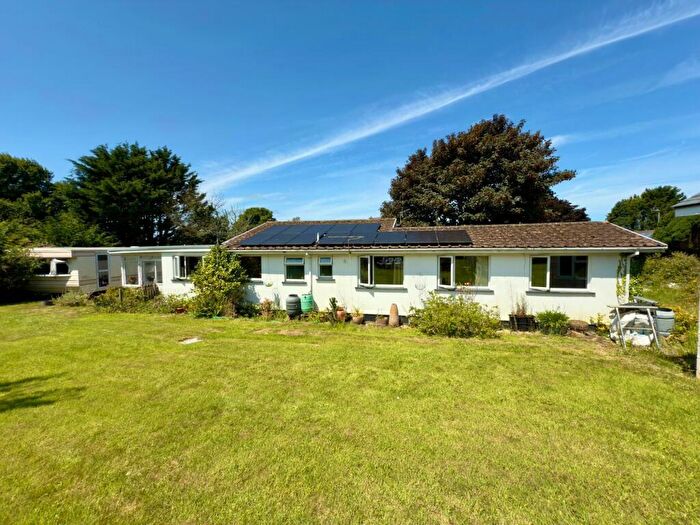
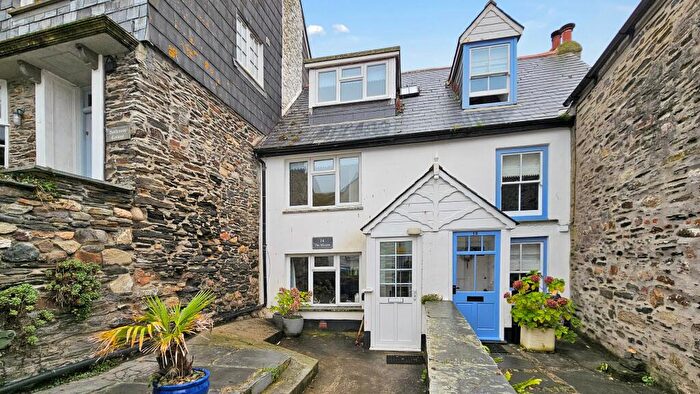
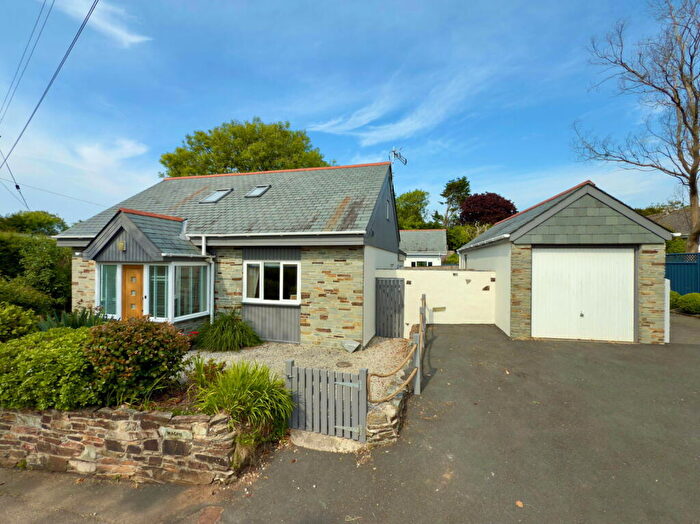
Properties for sale in St Minver And St Endellion
Roads and Postcodes in St Minver And St Endellion
Navigate through our locations to find the location of your next house in St Minver And St Endellion, Port Isaac for sale or to rent.
| Streets | Postcodes |
|---|---|
| Brentons Park | PL29 3TY |
| Brooklands View | PL29 3AE |
| Bunts Mews | PL29 3TQ |
| Castle Rock | PL29 3AB |
| Church Hill | PL29 3RQ PL29 3SP |
| Coast Guard Hill | PL29 3SA |
| Dolphin Street | PL29 3RJ |
| Fore Street | PL29 3RB PL29 3RD PL29 3RE PL29 3RF PL29 3RA |
| Hartland Road | PL29 3RP |
| Hillson Close | PL29 3TR |
| Lundy Road | PL29 3RR |
| Marshalls Way | PL29 3TE |
| Mayfield Close | PL29 3RS |
| Mayfield Drive | PL29 3SL |
| Mayfield Road | PL29 3RT |
| Middle Street | PL29 3RH |
| New Road | PL29 3SB PL29 3SD |
| Overcliff | PL29 3RZ |
| Roscarrock Hill | PL29 3RG |
| Rose Hill | PL29 3RL |
| Silvershell Road | PL29 3SN |
| Silvershell View | PL29 3TU |
| St Endellion Lane | PL29 3TG |
| The Barton | PL29 3TX |
| The Terrace | PL29 3SG |
| Tintagel Terrace | PL29 3SE |
| Trewetha Lane | PL29 3RN PL29 3RW |
| PL29 3AD PL29 3RU PL29 3SH PL29 3SJ PL29 3SQ PL29 3SR PL29 3SU PL29 3SX PL29 3TA PL29 3TF PL29 3TH PL29 3TJ PL29 3TL PL29 3TN PL29 3TP PL29 3TS PL29 3TW PL29 3RX PL29 3SS PL29 3ST PL29 3SY PL29 3SZ PL29 3TB PL29 3TT |
Transport near St Minver And St Endellion
-
Roche Station
-
Bodmin Parkway Station
-
Bugle Station
-
St.Columb Road Station
-
Luxulyan Station
-
Lostwithiel Station
- FAQ
- Price Paid By Year
- Property Type Price
Frequently asked questions about St Minver And St Endellion
What is the average price for a property for sale in St Minver And St Endellion?
The average price for a property for sale in St Minver And St Endellion is £530,896. There are 183 property listings for sale in St Minver And St Endellion.
What streets have the most expensive properties for sale in St Minver And St Endellion?
The streets with the most expensive properties for sale in St Minver And St Endellion are Silvershell View at an average of £1,150,000, Trewetha Lane at an average of £1,080,000 and Bunts Mews at an average of £523,333.
What streets have the most affordable properties for sale in St Minver And St Endellion?
The streets with the most affordable properties for sale in St Minver And St Endellion are Mayfield Drive at an average of £235,000, Overcliff at an average of £333,200 and Middle Street at an average of £409,000.
Which train stations are available in or near St Minver And St Endellion?
Some of the train stations available in or near St Minver And St Endellion are Roche, Bodmin Parkway and Bugle.
Property Price Paid in St Minver And St Endellion by Year
The average sold property price by year was:
| Year | Average Sold Price | Price Change |
Sold Properties
|
|---|---|---|---|
| 2025 | £581,906 | 15% |
16 Properties |
| 2024 | £495,383 | -8% |
24 Properties |
| 2023 | £533,156 | -24% |
16 Properties |
| 2022 | £660,715 | 9% |
19 Properties |
| 2021 | £598,127 | 22% |
48 Properties |
| 2020 | £468,020 | 5% |
22 Properties |
| 2019 | £444,235 | 5% |
33 Properties |
| 2018 | £422,344 | 10% |
29 Properties |
| 2017 | £381,897 | 10% |
39 Properties |
| 2016 | £343,241 | -9% |
29 Properties |
| 2015 | £374,602 | 8% |
41 Properties |
| 2014 | £344,633 | 21% |
32 Properties |
| 2013 | £273,144 | -8% |
17 Properties |
| 2012 | £296,305 | -15% |
18 Properties |
| 2011 | £340,200 | -50% |
10 Properties |
| 2010 | £508,986 | 41% |
19 Properties |
| 2009 | £298,065 | -21% |
23 Properties |
| 2008 | £359,414 | 18% |
25 Properties |
| 2007 | £294,483 | 6% |
34 Properties |
| 2006 | £278,058 | 13% |
32 Properties |
| 2005 | £242,304 | -23% |
32 Properties |
| 2004 | £298,672 | 22% |
34 Properties |
| 2003 | £232,750 | 19% |
36 Properties |
| 2002 | £188,019 | 21% |
23 Properties |
| 2001 | £148,340 | 14% |
38 Properties |
| 2000 | £128,209 | 23% |
38 Properties |
| 1999 | £98,475 | 19% |
48 Properties |
| 1998 | £79,771 | 4% |
49 Properties |
| 1997 | £76,829 | 14% |
44 Properties |
| 1996 | £65,695 | 7% |
30 Properties |
| 1995 | £61,011 | - |
17 Properties |
Property Price per Property Type in St Minver And St Endellion
Here you can find historic sold price data in order to help with your property search.
The average Property Paid Price for specific property types in the last three years are:
| Property Type | Average Sold Price | Sold Properties |
|---|---|---|
| Semi Detached House | £609,772.00 | 11 Semi Detached Houses |
| Detached House | £618,270.00 | 24 Detached Houses |
| Terraced House | £411,166.00 | 18 Terraced Houses |
| Flat | £261,066.00 | 3 Flats |

