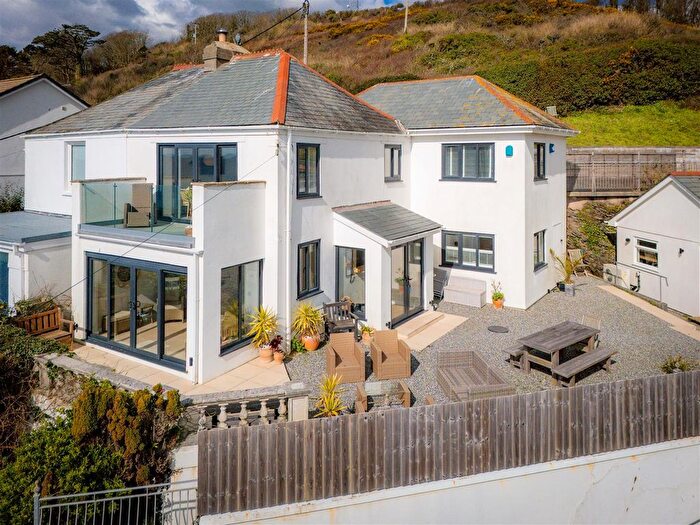
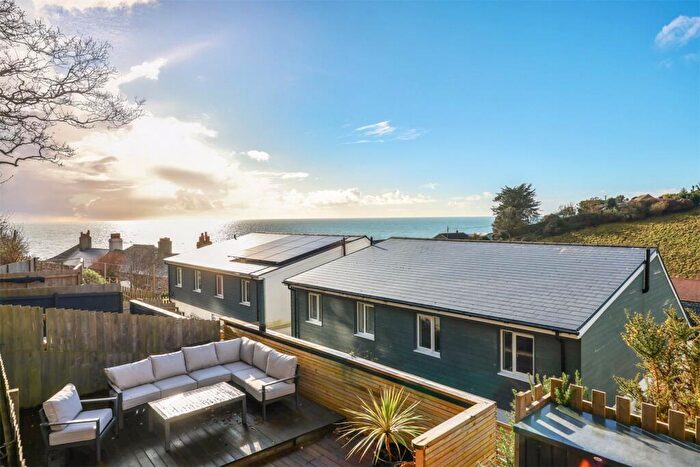
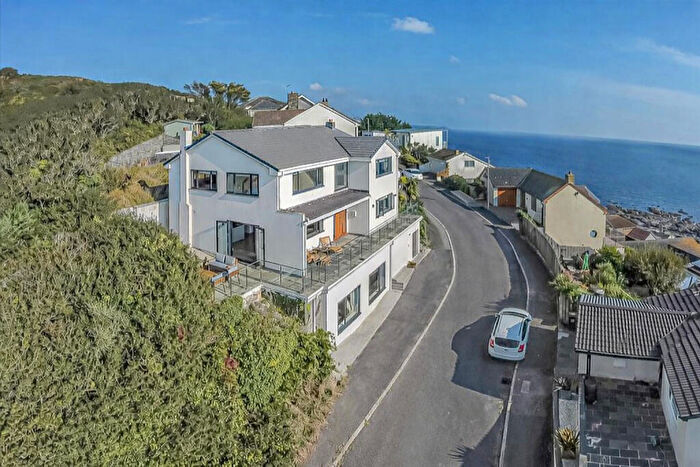
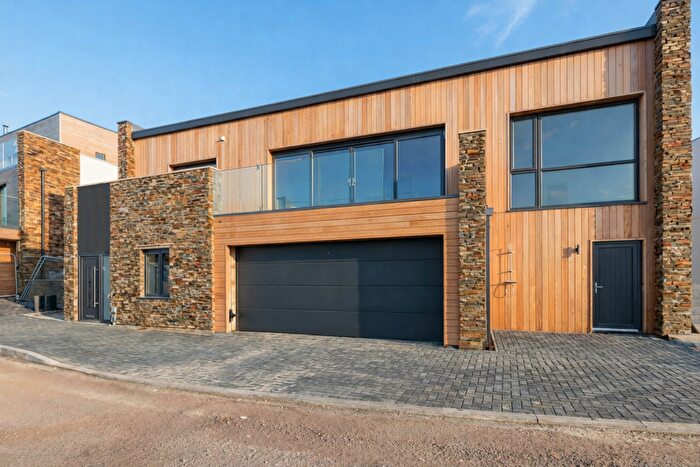
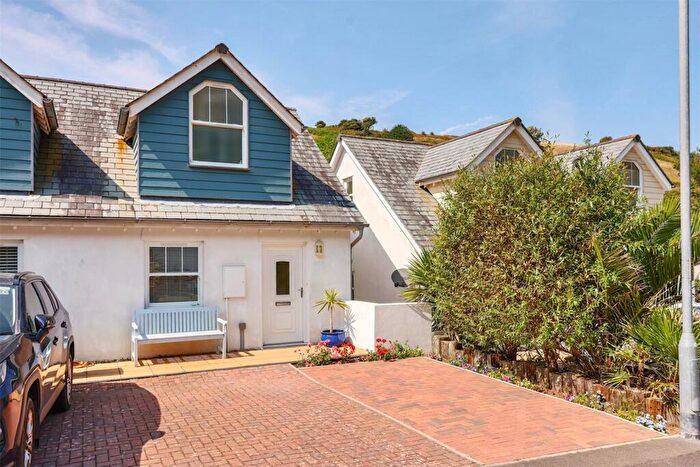
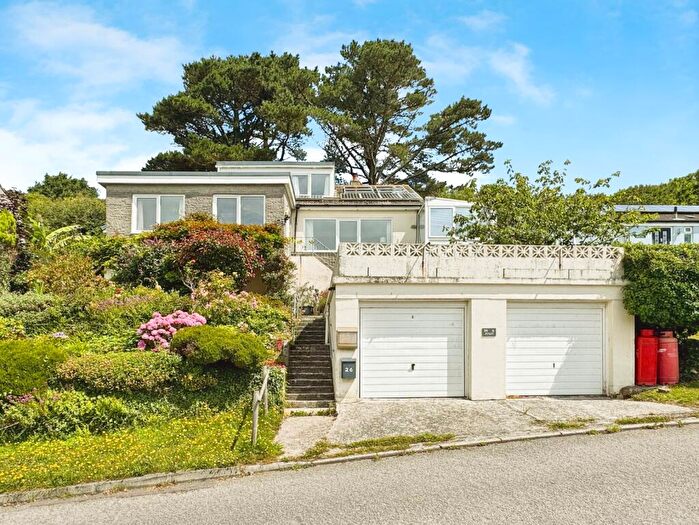
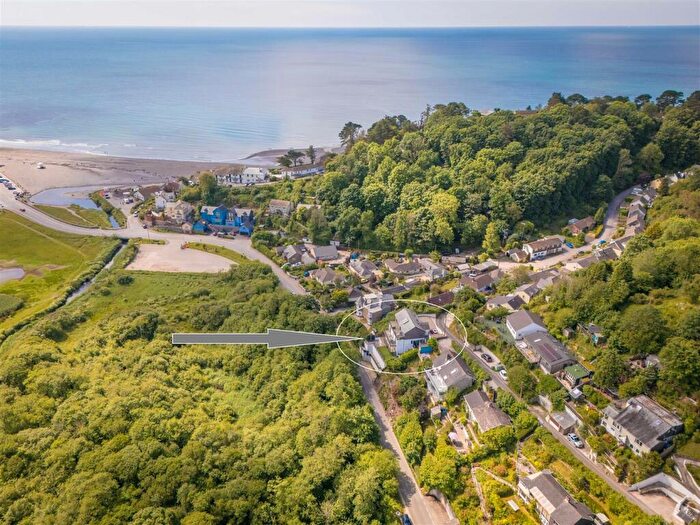
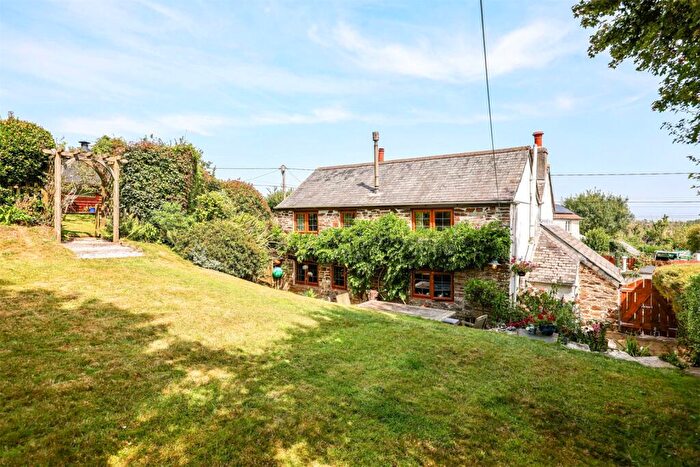
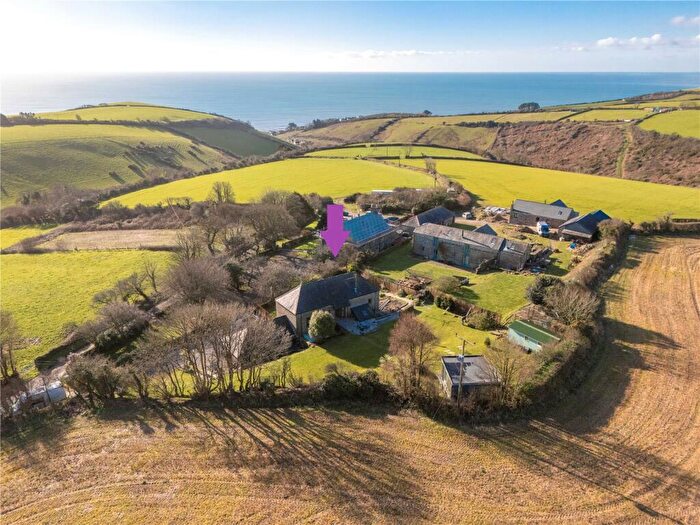
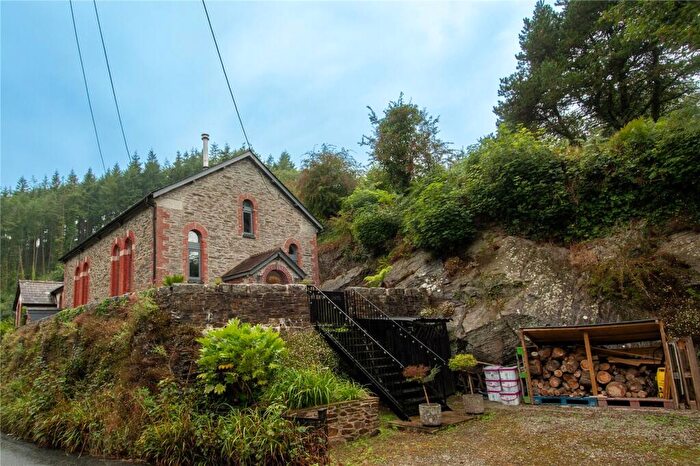
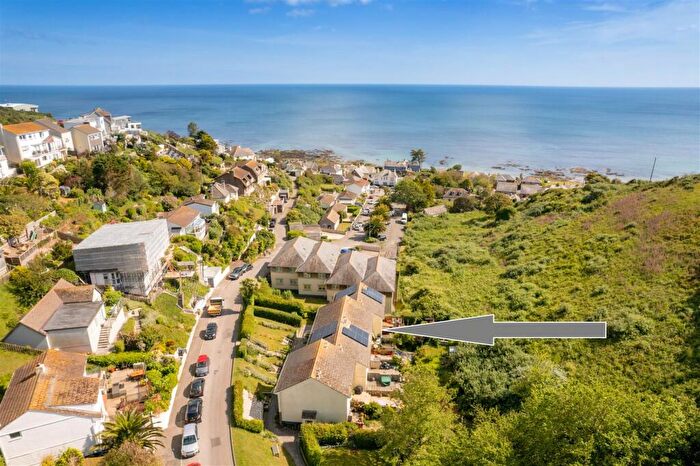
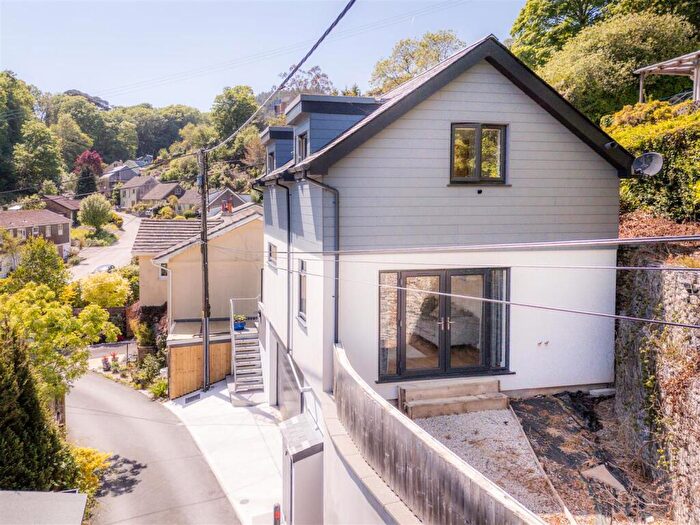
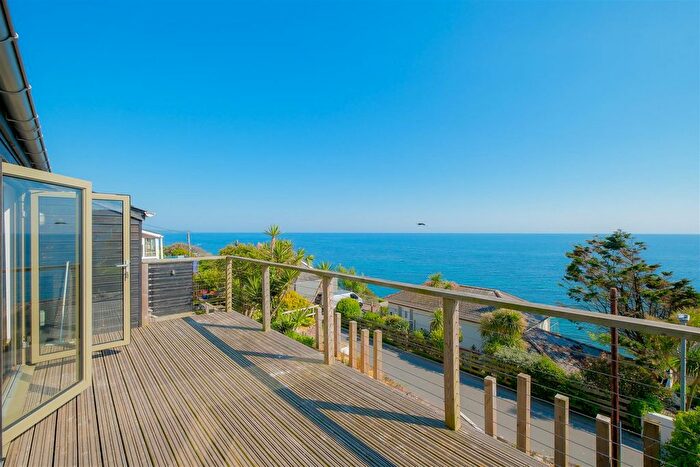
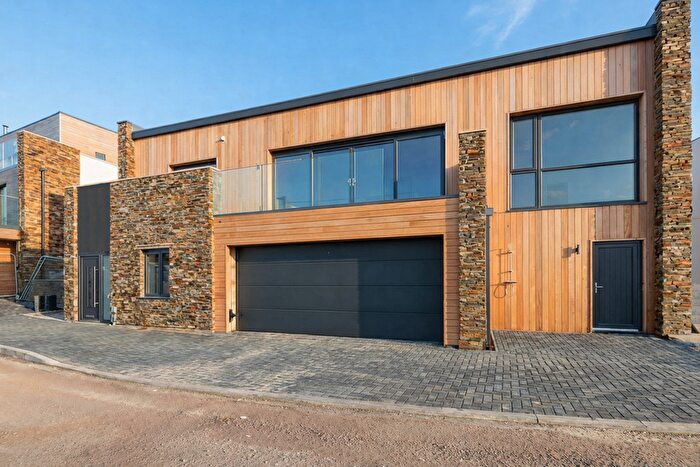
Houses for sale & to rent in Trelawny, Torpoint
House Prices in Trelawny
Properties in Trelawny have an average house price of £483,827.00 and had 77 Property Transactions within the last 3 years¹.
Trelawny is an area in Torpoint, Cornwall with 612 households², where the most expensive property was sold for £2,900,000.00.
Properties for sale in Trelawny
Previously listed properties in Trelawny
Roads and Postcodes in Trelawny
Navigate through our locations to find the location of your next house in Trelawny, Torpoint for sale or to rent.
| Streets | Postcodes |
|---|---|
| Beach Hill | PL11 3NT PL11 3NS |
| Brenton Terrace | PL11 3JB |
| Broads Yard | PL11 3EF |
| Buttlegate | PL11 3NQ |
| Church Hill | PL11 3HR |
| Coastguard Cottages | PL11 3LN |
| Deviock Hill | PL11 3NA |
| East Camps Bay | PL11 3LQ |
| Fore Street | PL11 3HP |
| Hessenford Road | PL11 3JL PL11 3JW |
| Hillside Terrace | PL11 3LT |
| Keveral Gardens | PL11 3JH |
| Keveral Lane | PL11 3JJ |
| Looe Hill | PL11 3JN PL11 3JQ |
| Morweth Court | PL11 3JP |
| Seaton Park | PL11 3JF |
| The Pavillion | PL11 3JS |
| Top Road | PL11 3LZ |
| Tregunnick Lane | PL11 3JT |
| Treliddon Cottages | PL11 3DP |
| Treliddon Lane | PL11 3LP PL11 3LR PL11 3LS |
| Treliddon Terrace | PL11 3DR |
| Trerieve | PL11 3JR PL11 3LY |
| Trerieve Estate | PL11 3LX PL11 3NH |
| Trerose Coombe | PL11 3LA |
| Trewall Hill | PL11 3FB |
| Trewall Lane | PL11 3LU |
| West Camps Bay | PL11 3LG |
| PL11 3BZ PL11 3DL PL11 3DN PL11 3DW PL11 3DX PL11 3DY PL11 3HB PL11 3HE PL11 3HH PL11 3HJ PL11 3HL PL11 3HW PL11 3JA PL11 3JD PL11 3JU PL11 3JX PL11 3JZ PL11 3LD PL11 3LE PL11 3LF PL11 3LH PL11 3LJ PL11 3LL PL11 3LW PL11 3DH PL11 3DJ PL11 3DS PL11 3DT PL11 3JY |
Transport near Trelawny
- FAQ
- Price Paid By Year
- Property Type Price
Frequently asked questions about Trelawny
What is the average price for a property for sale in Trelawny?
The average price for a property for sale in Trelawny is £483,827. This amount is 56% higher than the average price in Torpoint. There are 334 property listings for sale in Trelawny.
What streets have the most expensive properties for sale in Trelawny?
The streets with the most expensive properties for sale in Trelawny are Looe Hill at an average of £1,051,875, East Camps Bay at an average of £725,000 and Seaton Park at an average of £655,000.
What streets have the most affordable properties for sale in Trelawny?
The streets with the most affordable properties for sale in Trelawny are Trerieve Estate at an average of £141,666, Morweth Court at an average of £166,562 and Fore Street at an average of £255,000.
Which train stations are available in or near Trelawny?
Some of the train stations available in or near Trelawny are St.Germans, Looe and Sandplace.
Property Price Paid in Trelawny by Year
The average sold property price by year was:
| Year | Average Sold Price | Price Change |
Sold Properties
|
|---|---|---|---|
| 2025 | £284,433 | -50% |
15 Properties |
| 2024 | £427,632 | -50% |
32 Properties |
| 2023 | £643,466 | 25% |
30 Properties |
| 2022 | £485,792 | 1% |
47 Properties |
| 2021 | £482,295 | 17% |
57 Properties |
| 2020 | £400,289 | 16% |
51 Properties |
| 2019 | £334,886 | -3% |
47 Properties |
| 2018 | £345,397 | -1% |
34 Properties |
| 2017 | £348,167 | 22% |
42 Properties |
| 2016 | £273,198 | -0,2% |
40 Properties |
| 2015 | £273,631 | 8% |
46 Properties |
| 2014 | £252,472 | -12% |
58 Properties |
| 2013 | £281,752 | 6% |
29 Properties |
| 2012 | £264,537 | -7% |
24 Properties |
| 2011 | £282,009 | -20% |
34 Properties |
| 2010 | £337,897 | 22% |
20 Properties |
| 2009 | £263,051 | -24% |
39 Properties |
| 2008 | £326,972 | 13% |
18 Properties |
| 2007 | £285,190 | 8% |
54 Properties |
| 2006 | £261,790 | -14% |
49 Properties |
| 2005 | £297,478 | 40% |
30 Properties |
| 2004 | £177,755 | 6% |
66 Properties |
| 2003 | £167,841 | 7% |
45 Properties |
| 2002 | £156,052 | 7% |
42 Properties |
| 2001 | £144,625 | 22% |
41 Properties |
| 2000 | £112,674 | 14% |
50 Properties |
| 1999 | £96,979 | 18% |
43 Properties |
| 1998 | £79,442 | -7% |
26 Properties |
| 1997 | £85,367 | 19% |
32 Properties |
| 1996 | £69,268 | 12% |
38 Properties |
| 1995 | £61,288 | - |
20 Properties |
Property Price per Property Type in Trelawny
Here you can find historic sold price data in order to help with your property search.
The average Property Paid Price for specific property types in the last three years are:
| Property Type | Average Sold Price | Sold Properties |
|---|---|---|
| Semi Detached House | £383,058.00 | 17 Semi Detached Houses |
| Detached House | £675,467.00 | 39 Detached Houses |
| Terraced House | £219,250.00 | 4 Terraced Houses |
| Flat | £207,205.00 | 17 Flats |

