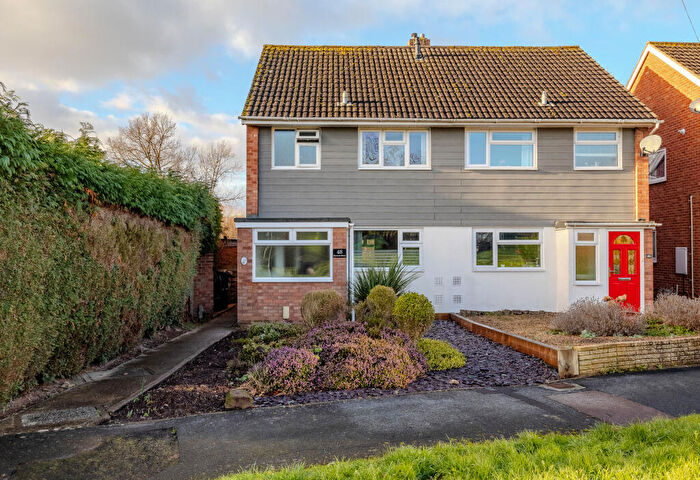
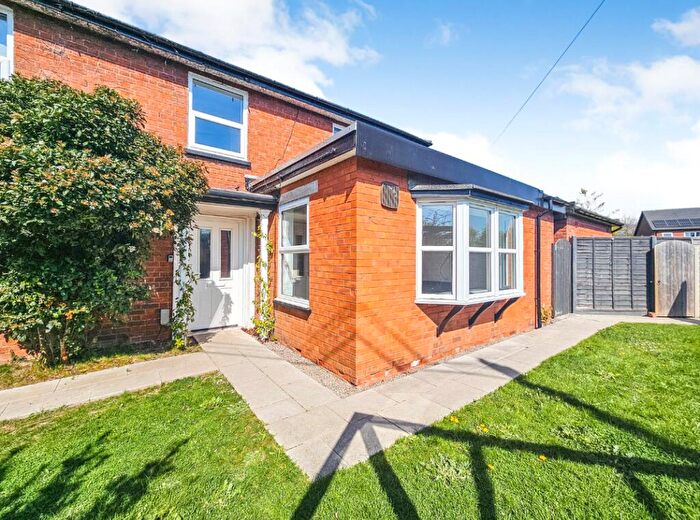
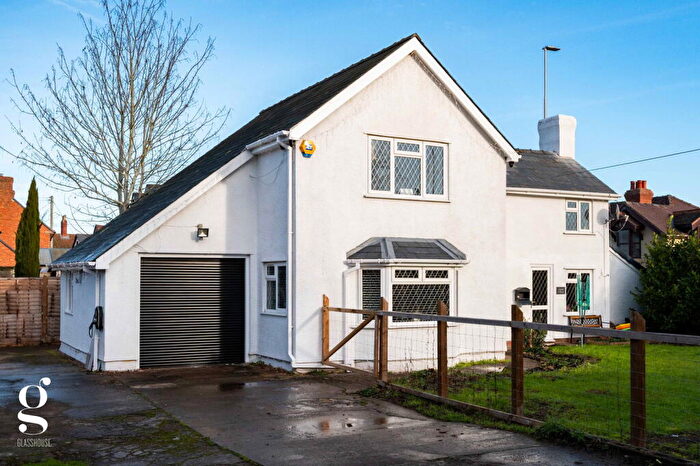
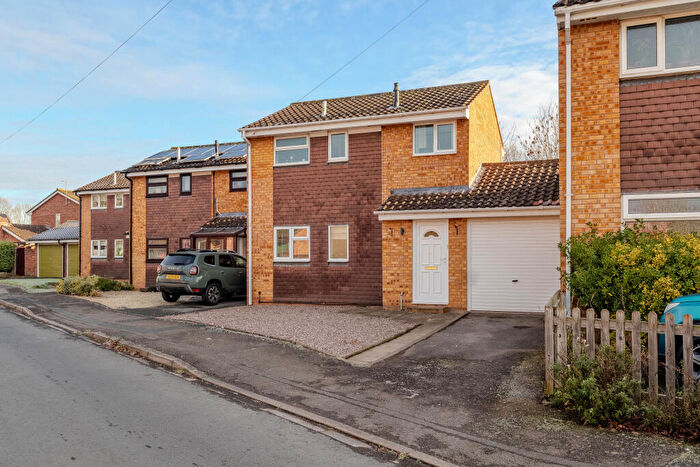
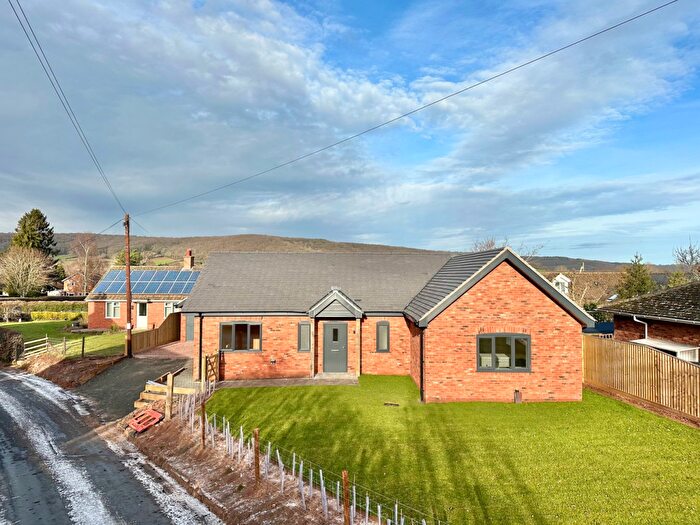
Houses for sale & to rent in Burghill, Holmer And Lyde, Hereford
House Prices in Burghill, Holmer And Lyde
Properties in Burghill, Holmer And Lyde have an average house price of £411,568.00 and had 157 Property Transactions within the last 3 years¹.
Burghill, Holmer And Lyde is an area in Hereford, County of Herefordshire with 1,285 households², where the most expensive property was sold for £1,550,000.00.
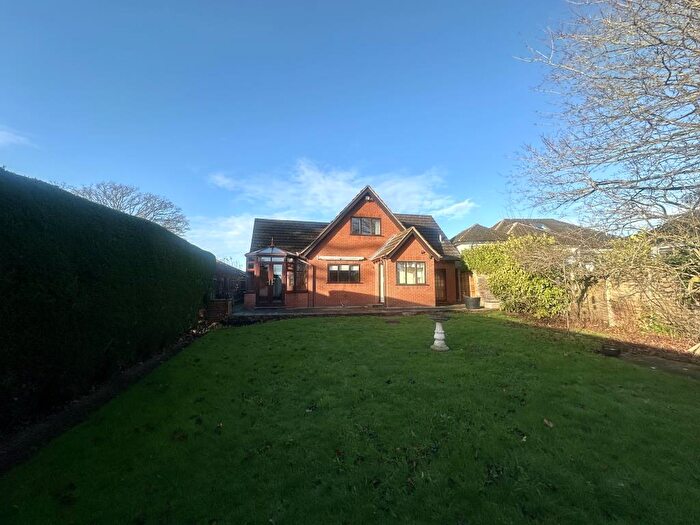
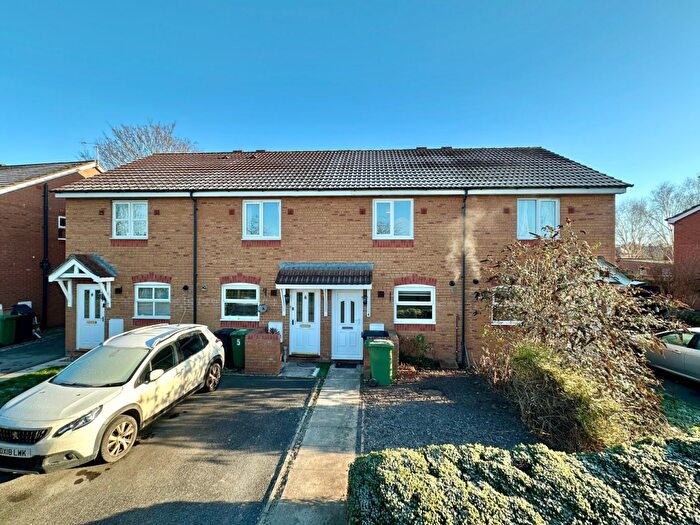
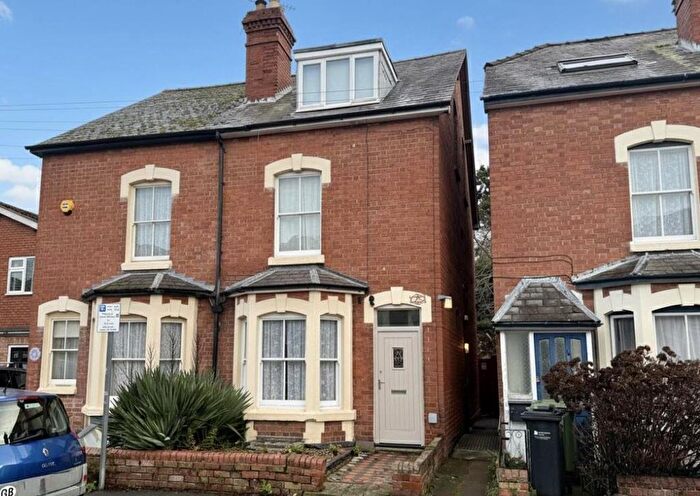
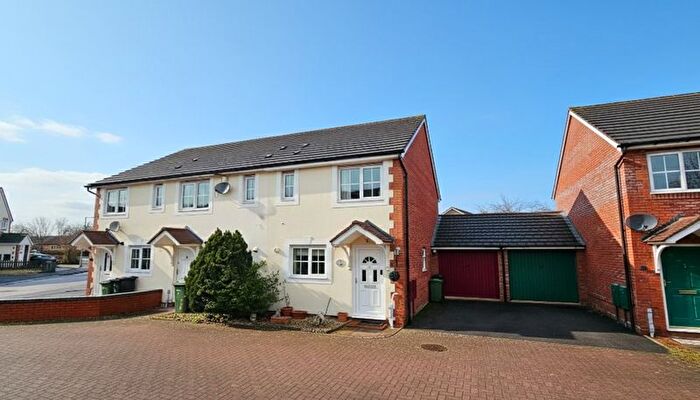
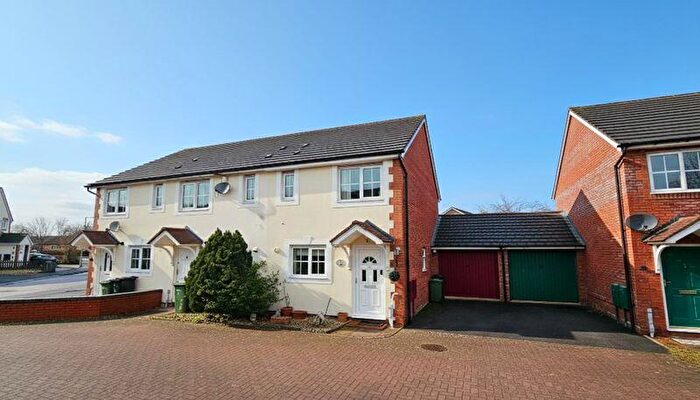
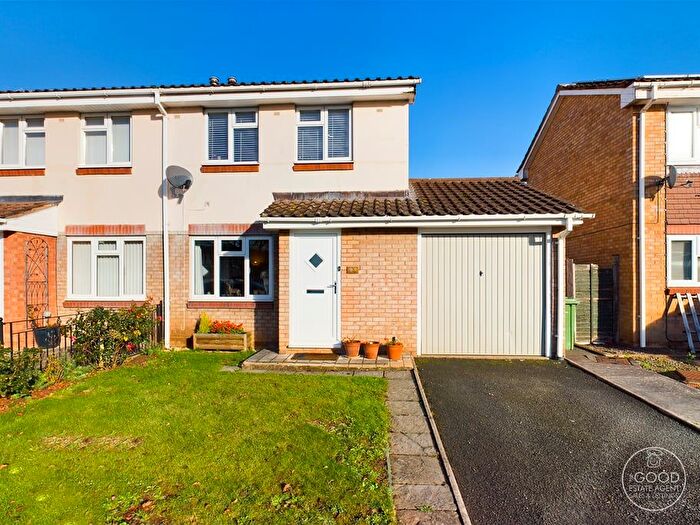
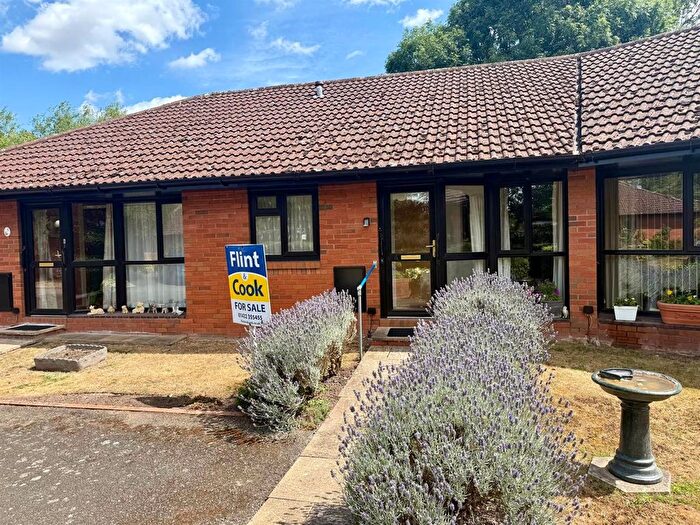
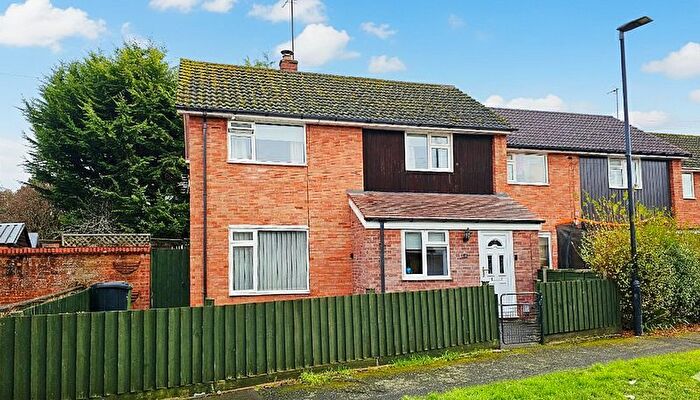
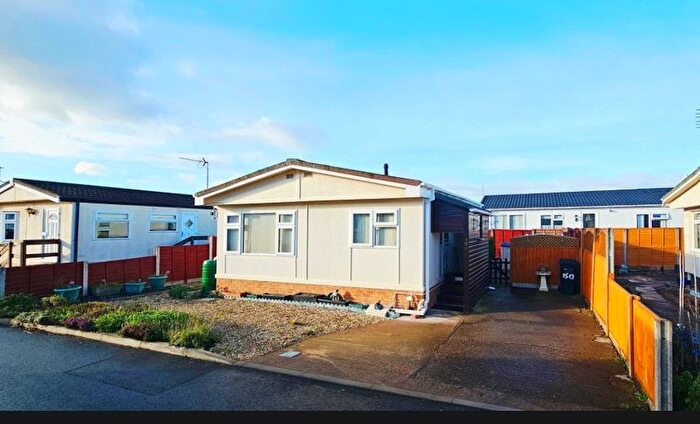
Properties for sale in Burghill, Holmer And Lyde
Roads and Postcodes in Burghill, Holmer And Lyde
Navigate through our locations to find the location of your next house in Burghill, Holmer And Lyde, Hereford for sale or to rent.
| Streets | Postcodes |
|---|---|
| Attwood Lane | HR1 1LJ |
| Bakers Furlong | HR4 7SB |
| Belfry Close | HR1 1QA |
| Belle Bank Avenue | HR4 9RL |
| Bewdley Bank | HR4 7SH HR4 7SQ |
| Burghill | HR4 7RE HR4 7RG HR4 7RH HR4 7RJ HR4 7RL HR4 7RN HR4 7RP HR4 7RQ HR4 7RW HR4 7RX HR4 7SE HR4 7SF HR4 7SG |
| Canon Pyon Road | HR4 7RB |
| Cedar Lane | HR4 7QQ |
| Cherry Orchard | HR4 8LE |
| Chestnut Lane | HR4 7QN |
| Church Road | HR1 3AB |
| Churchway Cottages | HR1 1LL |
| Cleeve Orchard | HR1 1LF |
| Coldwells Road | HR1 1LH |
| Crossway Terrace | HR1 1JW |
| Crowmoor Lane | HR4 8LD |
| Dale Drive | HR4 9RF |
| Dymock Red Walk | HR1 1GN |
| Eggleton Lane | HR1 1GJ |
| Eltons Marsh | HR4 7SJ |
| Gleneagles Road | HR1 1JZ |
| Grange Cottages | HR4 7RY |
| Green Wilding Road | HR1 1GB |
| Haymeadow Lane | HR4 7RZ |
| Hither Bush | HR4 8EF |
| Holmer Manor Close | HR4 9QZ |
| Holmer Park | HR1 1JY |
| Holmer Terrace | HR4 9RH |
| Hospital Houses | HR4 7RD |
| Jasmine Lane | HR4 7QS HR4 7QT |
| Leasown | HR4 7SA |
| Lower Orchards | HR4 7SD |
| Lower Portway | HR4 8NH |
| Lyde Cross | HR1 3AE |
| Lytham Drive | HR1 1PZ |
| Manor Fields | HR4 7RR |
| Muirfield Close | HR1 1QB |
| Munstone Garden Cottages | HR1 3AH |
| Munstone Road | HR1 1LG |
| New Cottages | HR1 3AG |
| Oak Lane | HR4 7QP |
| Old Bromley Lane | HR1 1GE |
| Orchard Close | HR4 9QY |
| Park Close | HR1 1LB |
| Pearmain Drive | HR1 1GD |
| Portway | HR4 8NF HR4 8NG |
| Red Norman Rise | HR1 1GP HR1 1GQ |
| Redstone | HR4 7RT |
| Roman Road | HR1 1LA HR1 1JN HR1 1JP HR1 1JX HR1 1LD HR1 1LE HR4 7AN HR4 9QN HR4 9QP HR4 9QR HR4 9QW |
| Round Oak View | HR4 8EQ |
| St Marys Lane | HR4 7QL HR4 7QZ |
| Sunningdale | HR1 1EA |
| Sycamore Lane | HR4 7QR |
| Tanners Red Walk | HR1 1GL |
| The Crescent | HR4 9QX |
| Towtree Lane | HR4 7AW |
| Turnberry Drive | HR1 1LP |
| Wayland Cottages | HR1 3AR |
| Wellington Lane | HR4 8NL |
| Wentworth Road | HR1 1PY |
| Yew Tree Cottages | HR4 8NJ |
| HR1 3AA HR1 3AD HR1 3AJ HR1 3AL HR1 3AS HR1 3AW HR4 8AA HR4 8AD HR4 8AE HR4 8AG HR4 8AH HR4 8LF HR4 8LG HR4 8LL HR4 8LN HR4 8LP HR4 8LQ HR4 8LR HR4 8LW HR4 8LX HR4 8NN HR4 8NP HR4 8NR HR4 8NW HR4 9RJ |
Transport near Burghill, Holmer And Lyde
- FAQ
- Price Paid By Year
- Property Type Price
Frequently asked questions about Burghill, Holmer And Lyde
What is the average price for a property for sale in Burghill, Holmer And Lyde?
The average price for a property for sale in Burghill, Holmer And Lyde is £411,568. This amount is 32% higher than the average price in Hereford. There are 5,154 property listings for sale in Burghill, Holmer And Lyde.
What streets have the most expensive properties for sale in Burghill, Holmer And Lyde?
The streets with the most expensive properties for sale in Burghill, Holmer And Lyde are St Marys Lane at an average of £878,750, Cedar Lane at an average of £730,000 and Jasmine Lane at an average of £677,500.
What streets have the most affordable properties for sale in Burghill, Holmer And Lyde?
The streets with the most affordable properties for sale in Burghill, Holmer And Lyde are Manor Fields at an average of £193,142, Eltons Marsh at an average of £220,000 and Red Norman Rise at an average of £256,777.
Which train stations are available in or near Burghill, Holmer And Lyde?
Some of the train stations available in or near Burghill, Holmer And Lyde are Hereford, Leominster and Ledbury.
Property Price Paid in Burghill, Holmer And Lyde by Year
The average sold property price by year was:
| Year | Average Sold Price | Price Change |
Sold Properties
|
|---|---|---|---|
| 2025 | £350,687 | -30% |
24 Properties |
| 2024 | £456,486 | 9% |
55 Properties |
| 2023 | £413,157 | 6% |
35 Properties |
| 2022 | £386,802 | 0,3% |
43 Properties |
| 2021 | £385,518 | 11% |
84 Properties |
| 2020 | £343,722 | 10% |
47 Properties |
| 2019 | £308,388 | 11% |
72 Properties |
| 2018 | £274,245 | -11% |
69 Properties |
| 2017 | £305,233 | 7% |
65 Properties |
| 2016 | £283,614 | 13% |
61 Properties |
| 2015 | £247,879 | 1% |
55 Properties |
| 2014 | £245,387 | -4% |
81 Properties |
| 2013 | £256,245 | 10% |
93 Properties |
| 2012 | £230,138 | -14% |
63 Properties |
| 2011 | £261,622 | -24% |
64 Properties |
| 2010 | £324,605 | 25% |
28 Properties |
| 2009 | £244,395 | -36% |
36 Properties |
| 2008 | £333,033 | 7% |
28 Properties |
| 2007 | £311,333 | 14% |
71 Properties |
| 2006 | £267,715 | -2% |
69 Properties |
| 2005 | £273,006 | -3% |
56 Properties |
| 2004 | £280,324 | 26% |
50 Properties |
| 2003 | £206,457 | 7% |
53 Properties |
| 2002 | £191,373 | 4% |
75 Properties |
| 2001 | £182,910 | 13% |
91 Properties |
| 2000 | £159,219 | 28% |
72 Properties |
| 1999 | £115,406 | 15% |
64 Properties |
| 1998 | £97,838 | -15% |
62 Properties |
| 1997 | £112,068 | 31% |
36 Properties |
| 1996 | £77,312 | -13% |
77 Properties |
| 1995 | £87,094 | - |
53 Properties |
Property Price per Property Type in Burghill, Holmer And Lyde
Here you can find historic sold price data in order to help with your property search.
The average Property Paid Price for specific property types in the last three years are:
| Property Type | Average Sold Price | Sold Properties |
|---|---|---|
| Semi Detached House | £307,671.00 | 32 Semi Detached Houses |
| Detached House | £499,831.00 | 87 Detached Houses |
| Terraced House | £305,775.00 | 36 Terraced Houses |
| Flat | £138,750.00 | 2 Flats |


