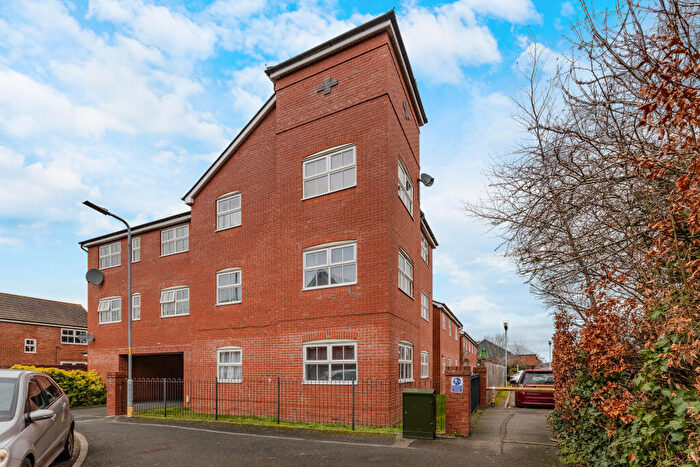
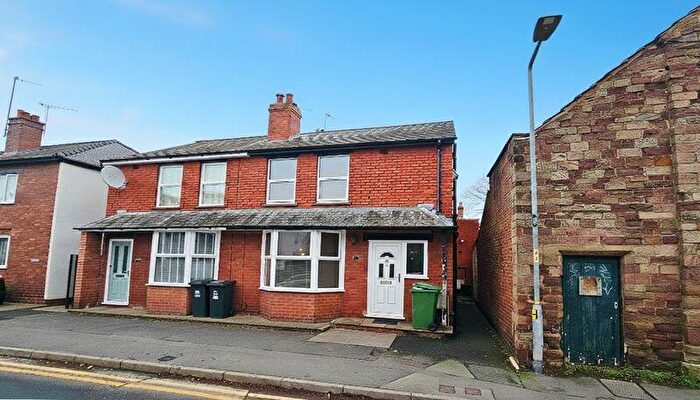
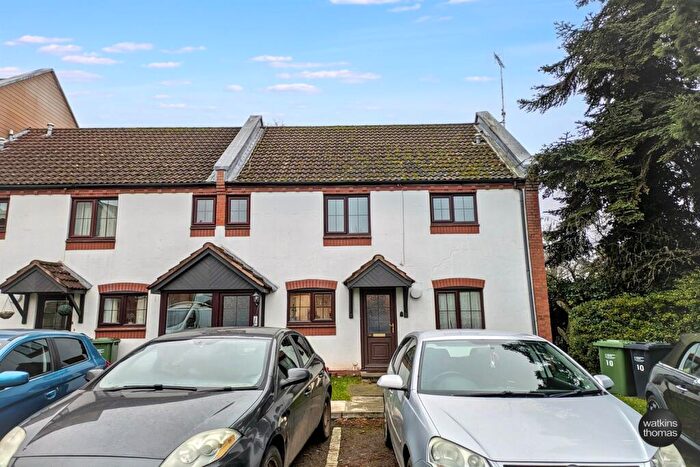
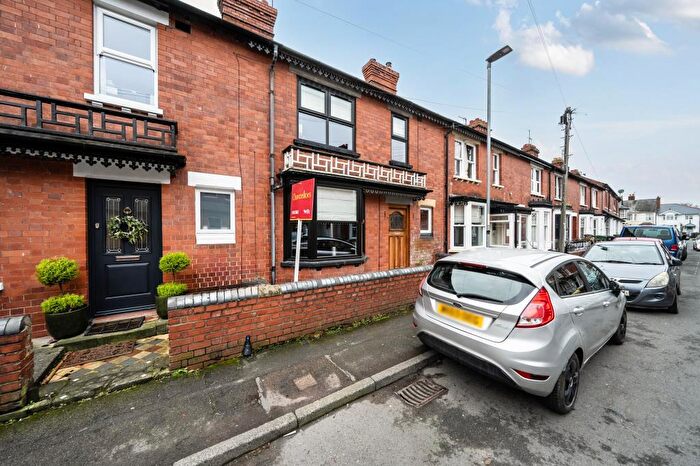
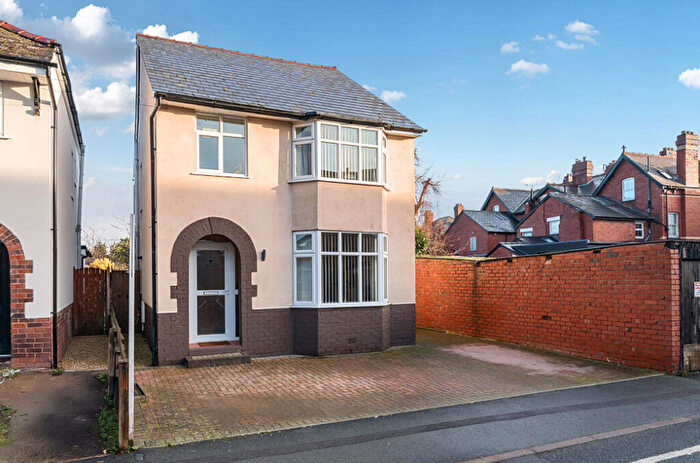
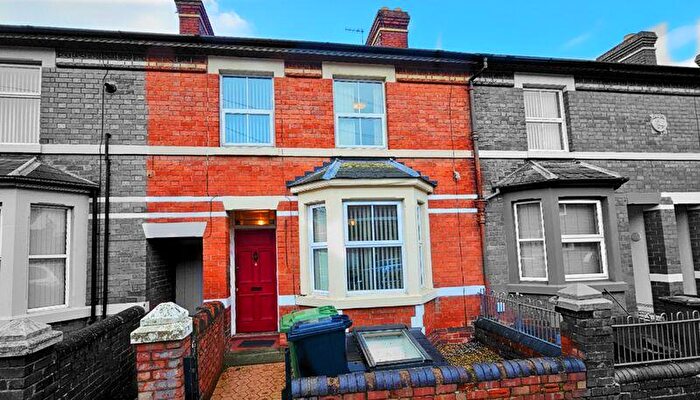
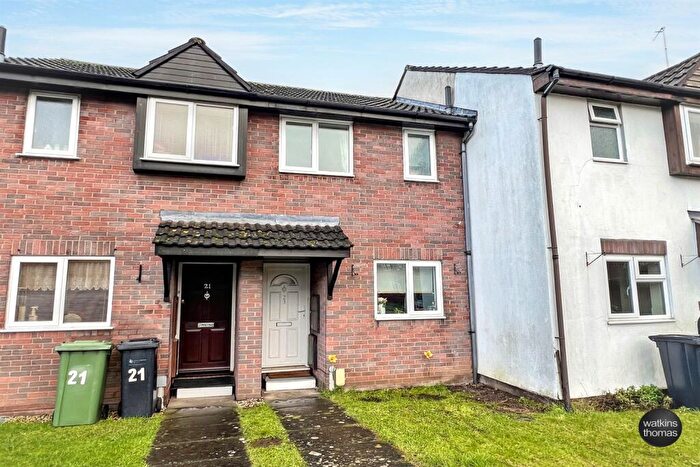
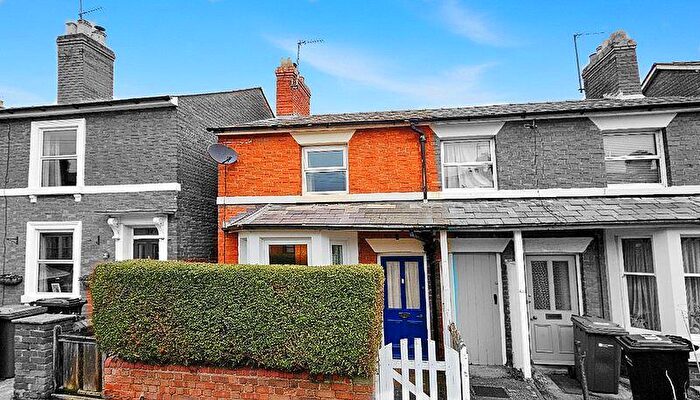
Houses for sale & to rent in St Nicholas, Hereford
House Prices in St Nicholas
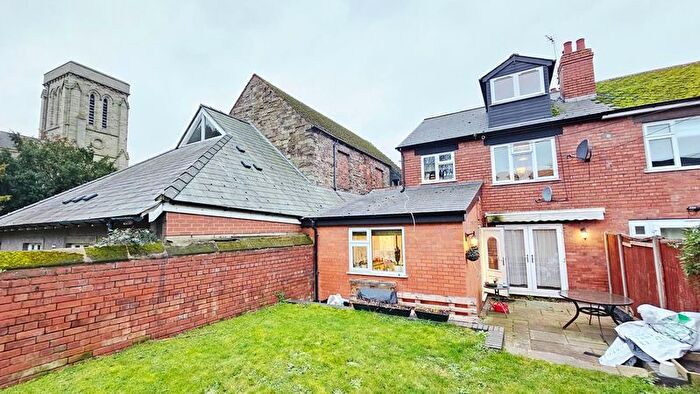
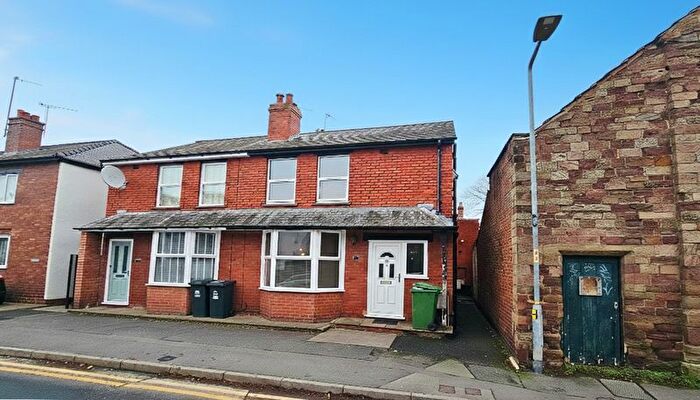
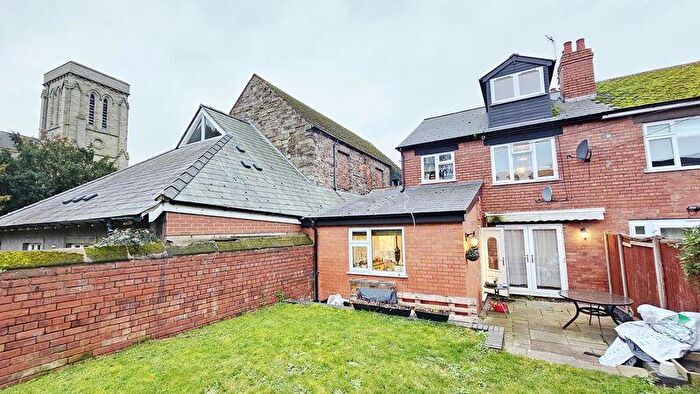
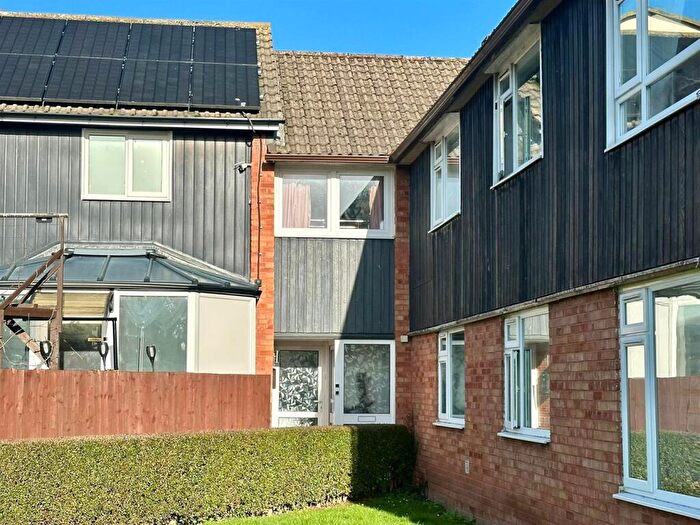
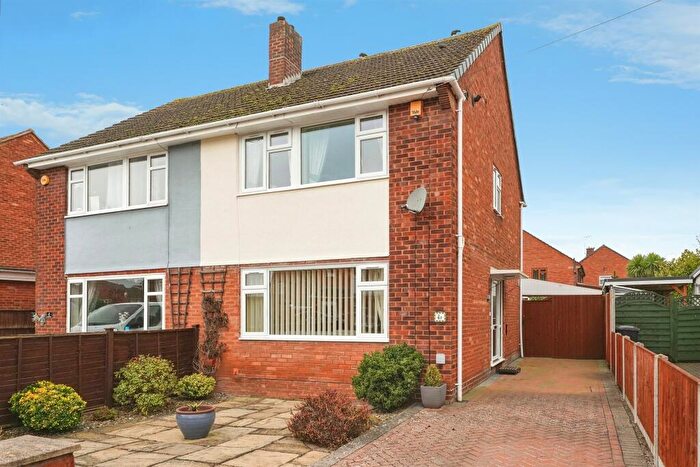
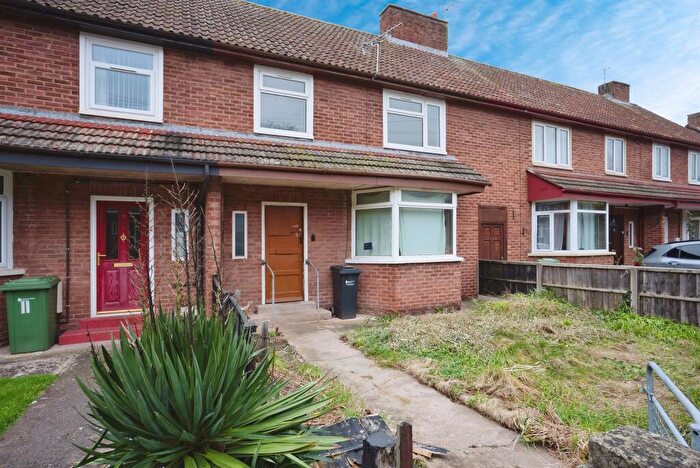
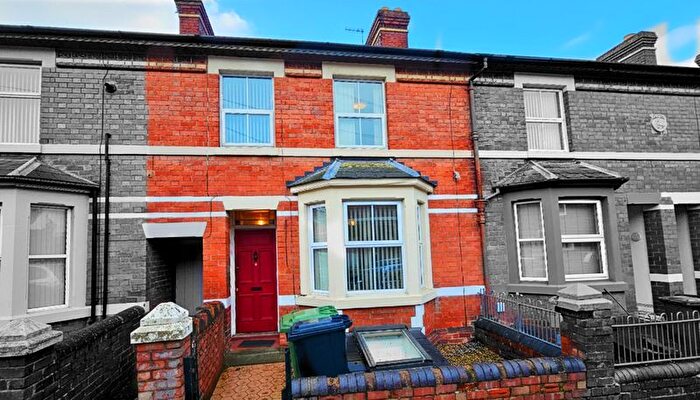
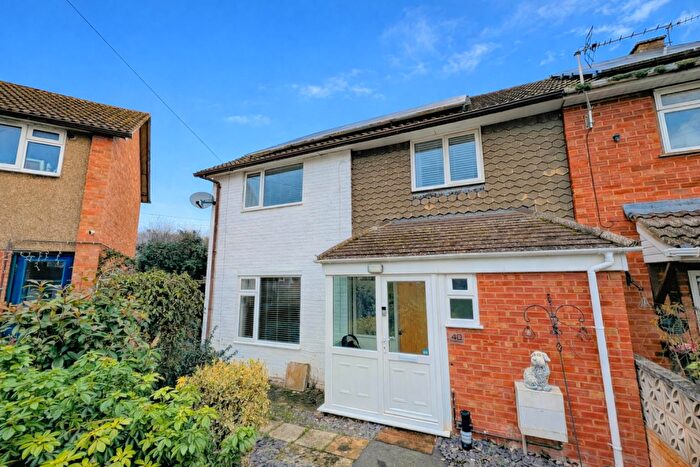
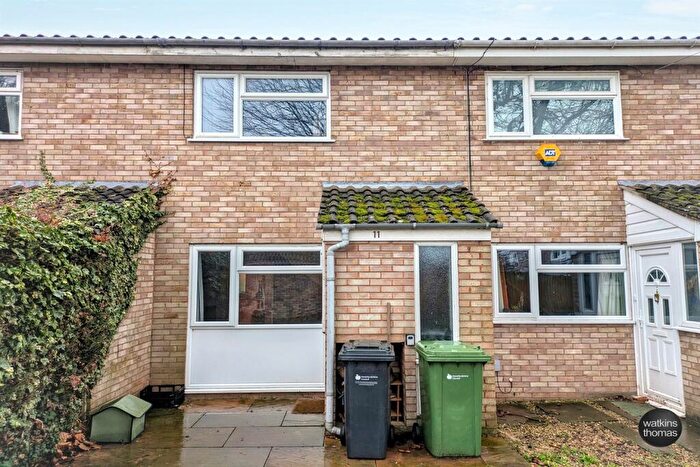
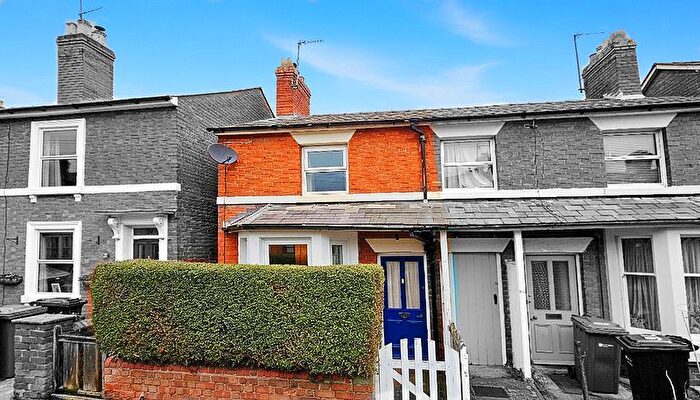
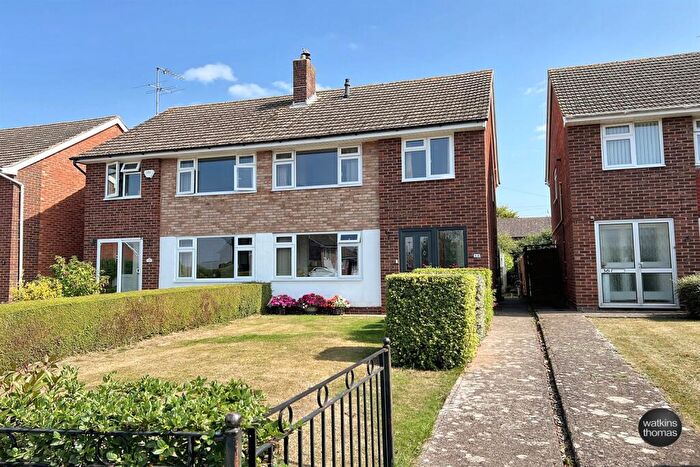
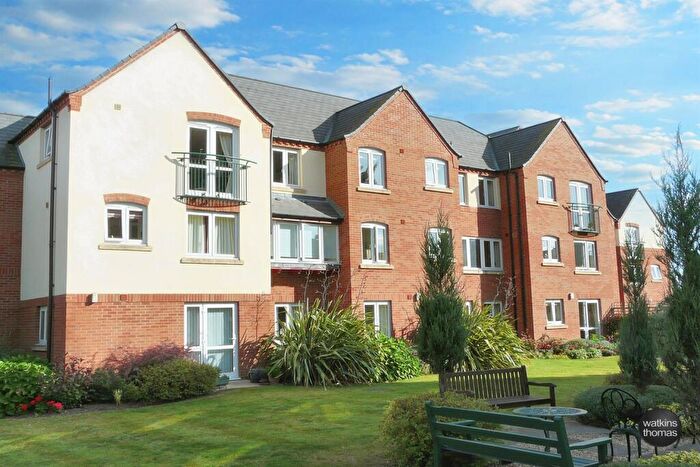
Properties in St Nicholas have an average house price of £255,261.00 and had 297 Property Transactions within the last 3 years¹.
St Nicholas is an area in Hereford, County of Herefordshire with 2,873 households², where the most expensive property was sold for £757,500.00.
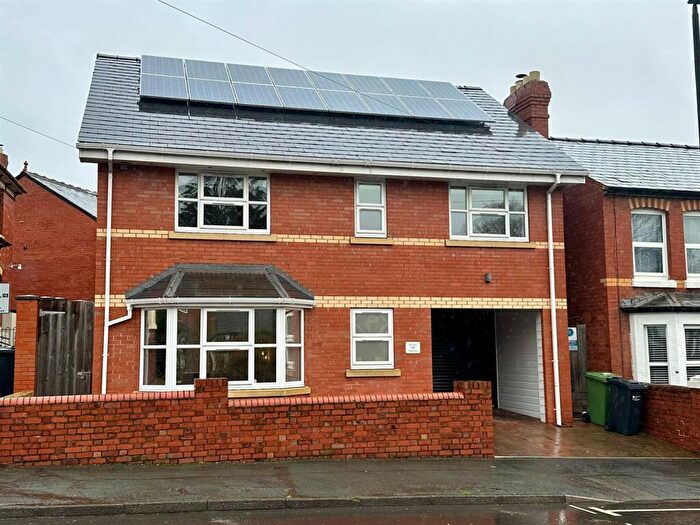
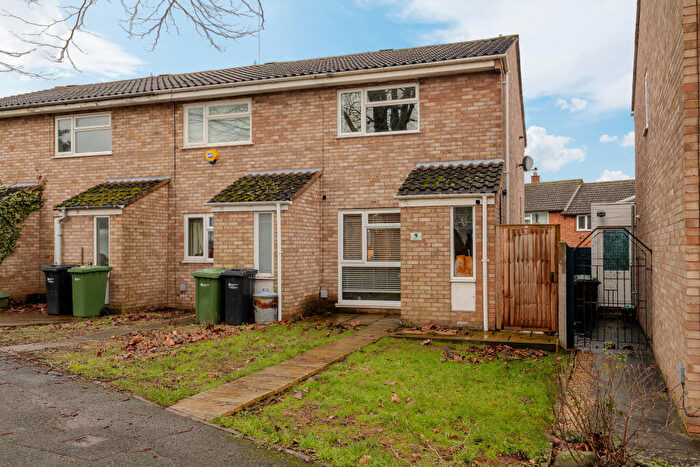
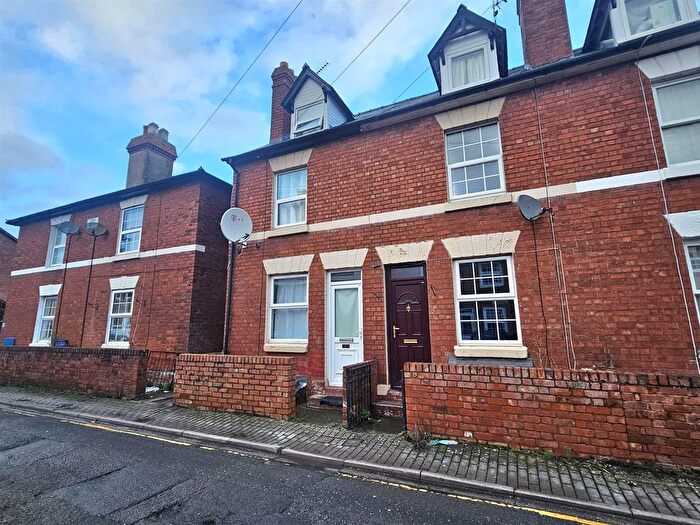
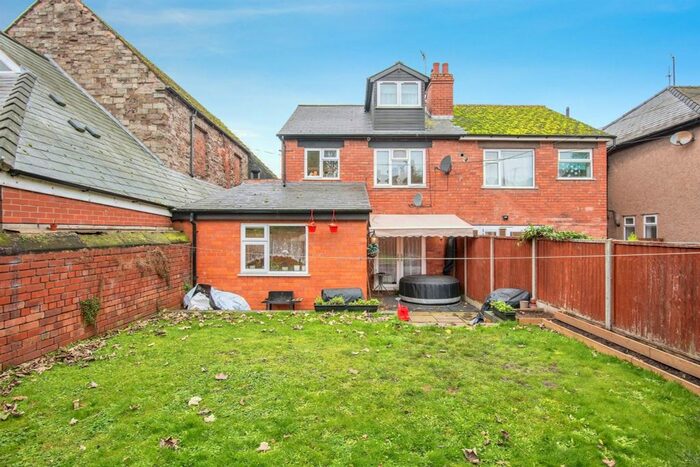
Properties for sale in St Nicholas
Roads and Postcodes in St Nicholas
Navigate through our locations to find the location of your next house in St Nicholas, Hereford for sale or to rent.
| Streets | Postcodes |
|---|---|
| Amyand Drive | HR4 0LU |
| Arkwright Close | HR4 0QE |
| Barrie Road | HR4 0QQ |
| Barton Place | HR4 0AT |
| Barton Road | HR4 0AU HR4 0AY |
| Baysham Street | HR4 0ET HR4 0EU |
| Bedford Street | HR4 0DR |
| Breinton Avenue | HR4 0JZ |
| Breinton Road | HR4 0GH HR4 0JU HR4 0JX HR4 0JY |
| Bridgeford Close | HR4 0QX |
| Bridle Road | HR4 0PP HR4 0PW |
| Broomy Hill | HR4 0LH HR4 0LJ HR4 0LQ |
| Camperdown Lane | HR4 0LL |
| Carroll Avenue | HR4 0QW |
| Chandos Street | HR4 0EX HR4 0EY |
| Clifford Street | HR4 0HG |
| Coleridge Crescent | HR4 0QH |
| Cornewall Street | HR4 0HE HR4 0HF |
| Cotterell Street | HR4 0HH HR4 0HJ HR4 0HQ |
| Crossfields | HR4 0HP HR4 0HR |
| Eden Court | HR4 0JR |
| Eign Street | HR4 0AJ |
| Emlyn Avenue | HR4 0JH |
| Fayre Oaks Drive | HR4 0QS |
| Fayre Oaks Green | HR4 0QT |
| Foxwhelp Close | HR4 0PL |
| Franklin Walk | HR4 0HX |
| Friars Street | HR4 0AS HR4 0BP |
| Greyfriars Avenue | HR4 0BE |
| Guildford Street | HR4 0DS |
| Hewitt Avenue | HR4 0QP HR4 0QR |
| Holmer Street | HR4 0HS HR4 0JA |
| Huntsmans Drive | HR4 0PN |
| Jamieson Court | HR4 0EJ |
| Kernal Road | HR4 0PR |
| Kings Acre Road | HR4 0QJ HR4 0QL HR4 0RQ |
| Kingstone Walk | HR4 0PJ |
| Langland Drive | HR4 0QG |
| Macaulay Avenue | HR4 0JJ |
| Marlowe Drive | HR4 0JL |
| Marshall Close | HR4 0QF |
| Melrose Place | HR4 0DN |
| Old Mill Close | HR4 0AL HR4 0AQ HR4 0AR |
| Oxford Street | HR4 0DP |
| Pomona Place | HR4 0EF |
| Prince Edward Road | HR4 0LG |
| Queens Hill Gardens | HR4 0EZ |
| Rankin Road | HR4 0QD |
| Ryelands Street | HR4 0LA HR4 0LB HR4 0LD HR4 0LN HR4 0NZ |
| Scudamore Street | HR4 0HN |
| Shakespeare Road | HR4 0JN |
| Sollars Close | HR4 0LX |
| Stanhope Street | HR4 0HA HR4 0HB |
| Station Road | HR4 0BD |
| Stephens Close | HR4 0HU |
| Stretton Close | HR4 0QN |
| Tennyson Close | HR4 0JW |
| The Dingle | HR4 0QU |
| Thompson Place | HR4 0JP |
| Tower Road | HR4 0LF |
| Victoria Court | HR4 0AW |
| Victoria Street | HR4 0AA HR4 0BZ |
| Westfaling Street | HR4 0HT HR4 0JB HR4 0JD HR4 0JE HR4 0JF HR4 0JG HR4 0JQ |
| White Horse Square | HR4 0HD |
| White Horse Street | HR4 0EP HR4 0ER |
| Whitecross Road | HR4 0DE HR4 0DQ HR4 0LS HR4 0LT |
| Windsor Street | HR4 0HW |
| Wordsworth Road | HR4 0QA HR4 0QB |
Transport near St Nicholas
- FAQ
- Price Paid By Year
- Property Type Price
Frequently asked questions about St Nicholas
What is the average price for a property for sale in St Nicholas?
The average price for a property for sale in St Nicholas is £255,261. This amount is 19% lower than the average price in Hereford. There are 1,249 property listings for sale in St Nicholas.
What streets have the most expensive properties for sale in St Nicholas?
The streets with the most expensive properties for sale in St Nicholas are Scudamore Street at an average of £456,666, Prince Edward Road at an average of £425,000 and Broomy Hill at an average of £382,079.
What streets have the most affordable properties for sale in St Nicholas?
The streets with the most affordable properties for sale in St Nicholas are Jamieson Court at an average of £110,750, Victoria Street at an average of £118,054 and Old Mill Close at an average of £149,687.
Which train stations are available in or near St Nicholas?
Some of the train stations available in or near St Nicholas are Hereford, Leominster and Ledbury.
Property Price Paid in St Nicholas by Year
The average sold property price by year was:
| Year | Average Sold Price | Price Change |
Sold Properties
|
|---|---|---|---|
| 2025 | £258,180 | 1% |
91 Properties |
| 2024 | £256,706 | 3% |
121 Properties |
| 2023 | £250,078 | 3% |
85 Properties |
| 2022 | £241,848 | 5% |
131 Properties |
| 2021 | £230,360 | 9% |
162 Properties |
| 2020 | £208,977 | 1% |
134 Properties |
| 2019 | £206,283 | -0,1% |
133 Properties |
| 2018 | £206,474 | 3% |
113 Properties |
| 2017 | £199,612 | 5% |
165 Properties |
| 2016 | £189,339 | -0,3% |
139 Properties |
| 2015 | £189,819 | 4% |
130 Properties |
| 2014 | £182,080 | 7% |
160 Properties |
| 2013 | £168,612 | 1% |
117 Properties |
| 2012 | £166,254 | 7% |
118 Properties |
| 2011 | £154,731 | -12% |
96 Properties |
| 2010 | £174,013 | 7% |
122 Properties |
| 2009 | £162,164 | -13% |
105 Properties |
| 2008 | £184,025 | 6% |
84 Properties |
| 2007 | £172,297 | 1% |
215 Properties |
| 2006 | £169,885 | 11% |
206 Properties |
| 2005 | £151,242 | 2% |
160 Properties |
| 2004 | £148,028 | 17% |
199 Properties |
| 2003 | £123,345 | 12% |
275 Properties |
| 2002 | £108,320 | 19% |
210 Properties |
| 2001 | £87,232 | 7% |
196 Properties |
| 2000 | £81,554 | 17% |
155 Properties |
| 1999 | £67,975 | 9% |
171 Properties |
| 1998 | £61,832 | 8% |
164 Properties |
| 1997 | £56,714 | 6% |
159 Properties |
| 1996 | £53,135 | 4% |
133 Properties |
| 1995 | £50,859 | - |
117 Properties |
Property Price per Property Type in St Nicholas
Here you can find historic sold price data in order to help with your property search.
The average Property Paid Price for specific property types in the last three years are:
| Property Type | Average Sold Price | Sold Properties |
|---|---|---|
| Semi Detached House | £281,279.00 | 109 Semi Detached Houses |
| Detached House | £368,845.00 | 36 Detached Houses |
| Terraced House | £234,006.00 | 108 Terraced Houses |
| Flat | £150,045.00 | 44 Flats |

