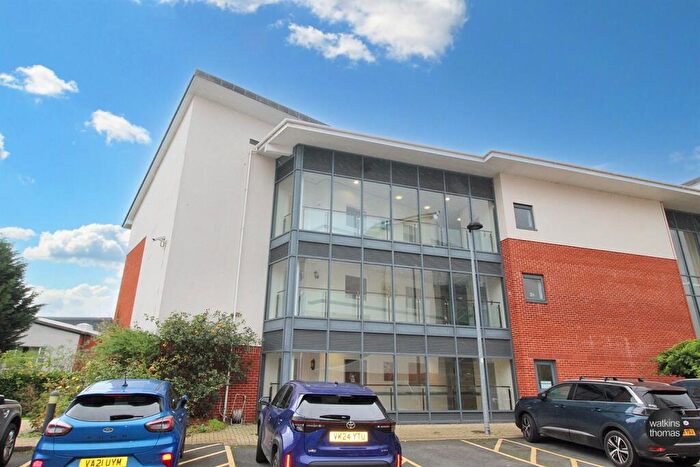
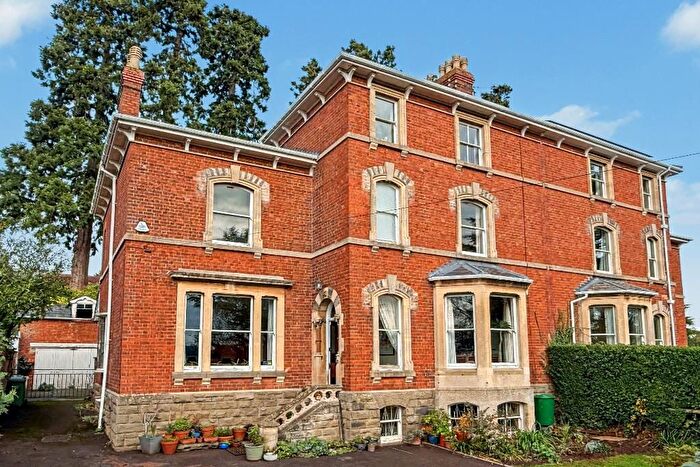
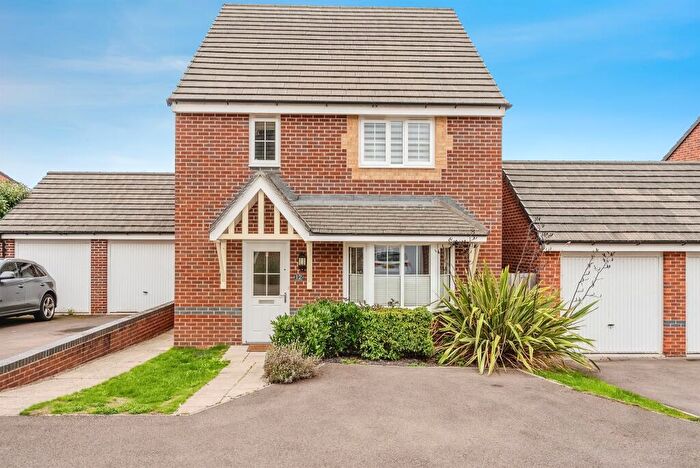
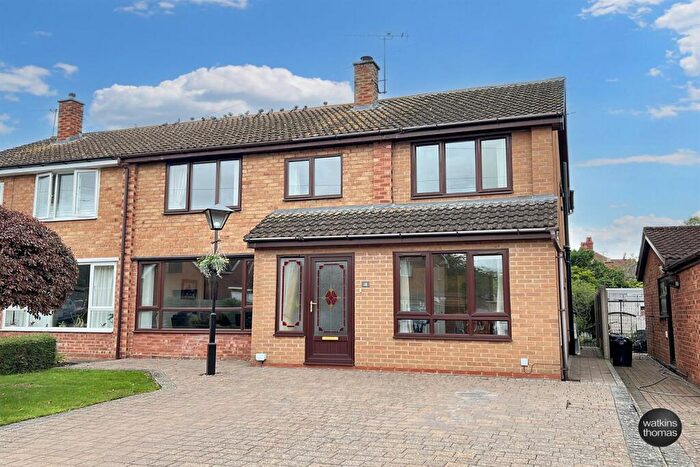
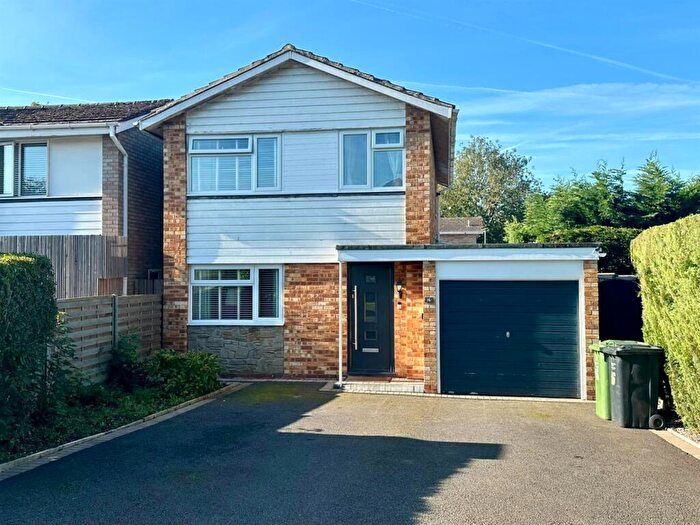
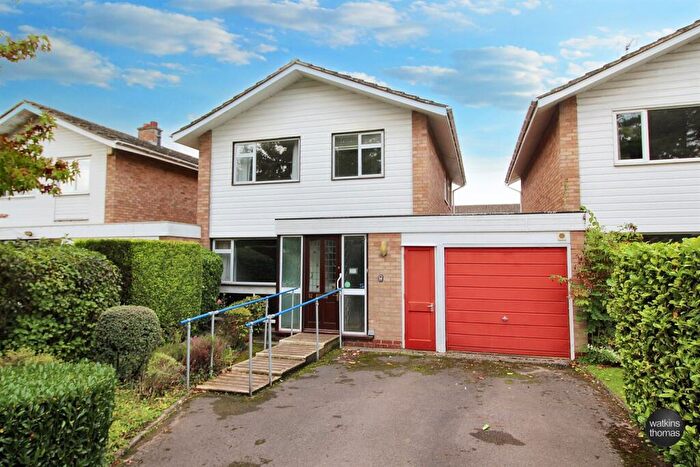
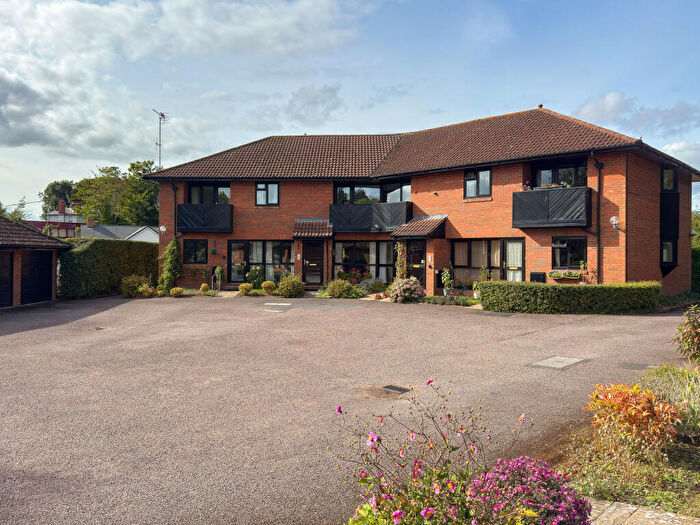
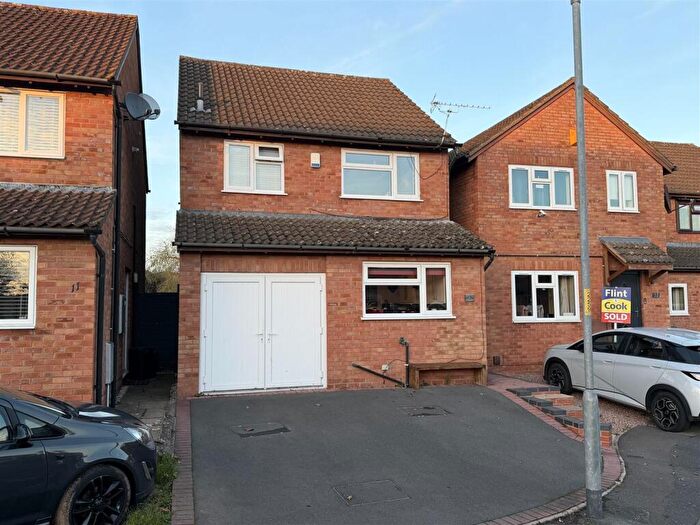
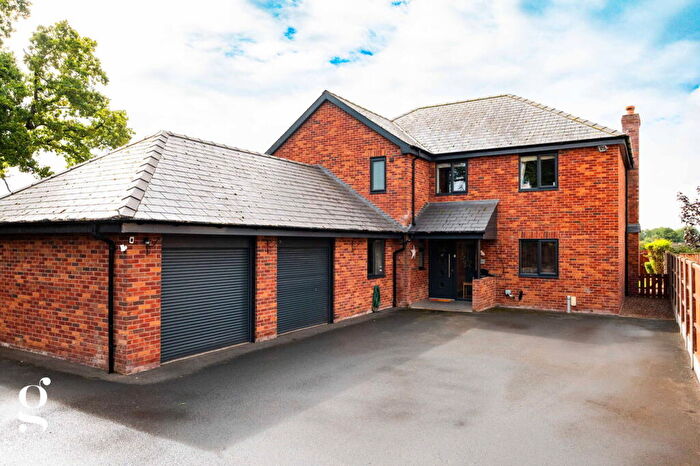
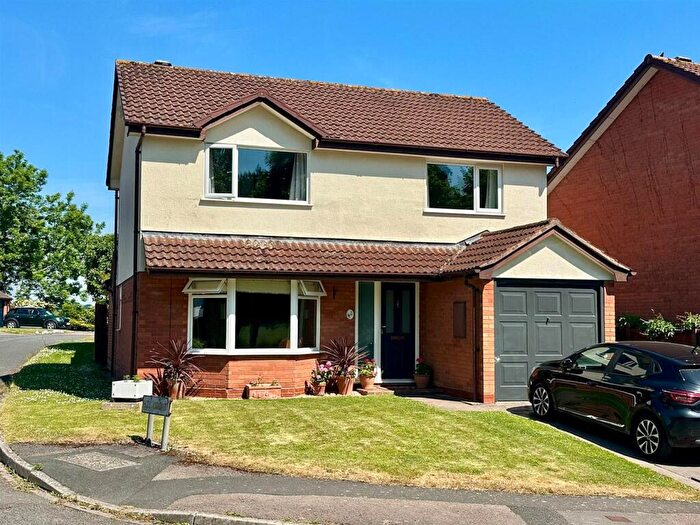
Houses for sale & to rent in Tupsley, Hereford
House Prices in Tupsley
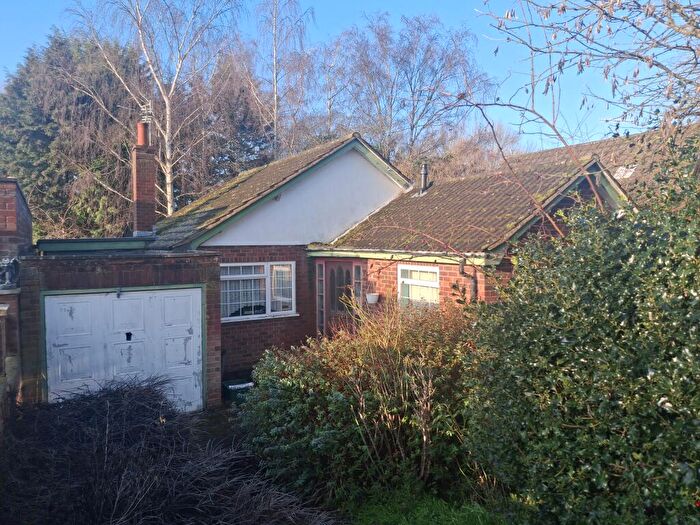
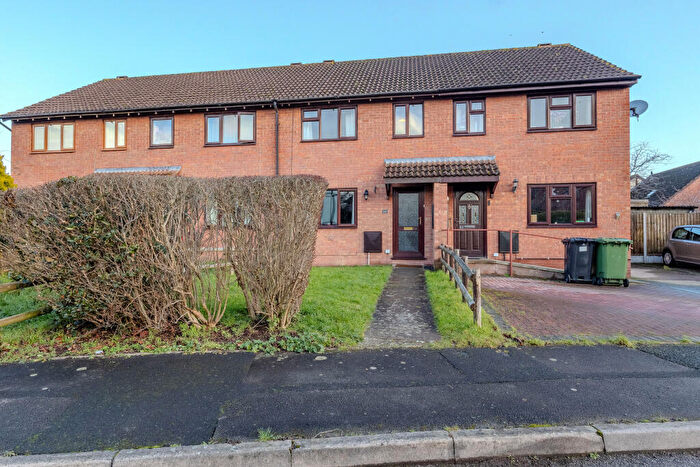
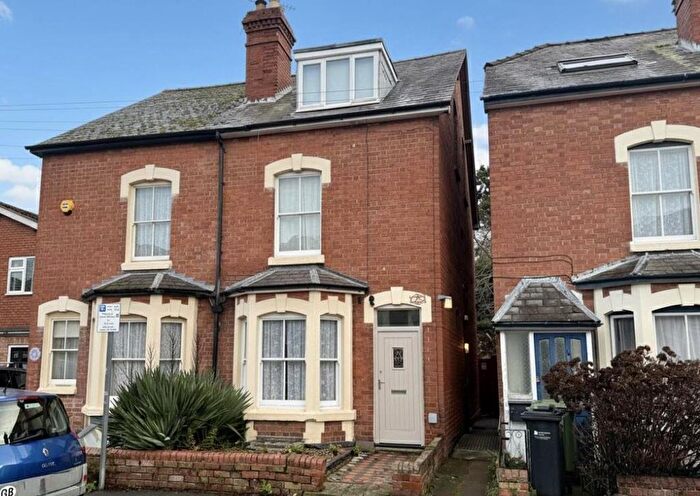
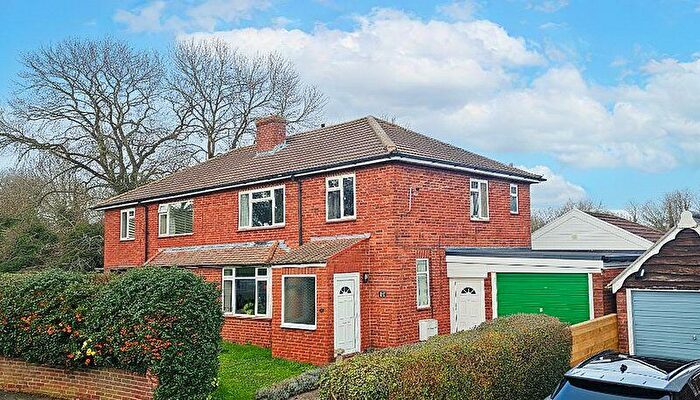
Properties in Tupsley have an average house price of £315,822.00 and had 382 Property Transactions within the last 3 years¹.
Tupsley is an area in Hereford, County of Herefordshire with 3,839 households², where the most expensive property was sold for £1,820,000.00.
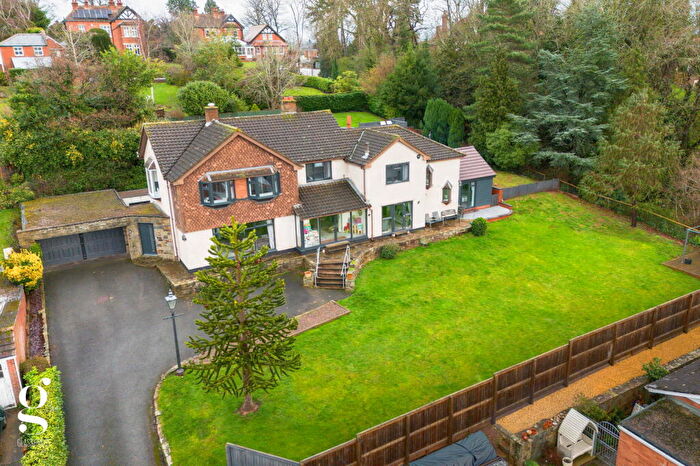
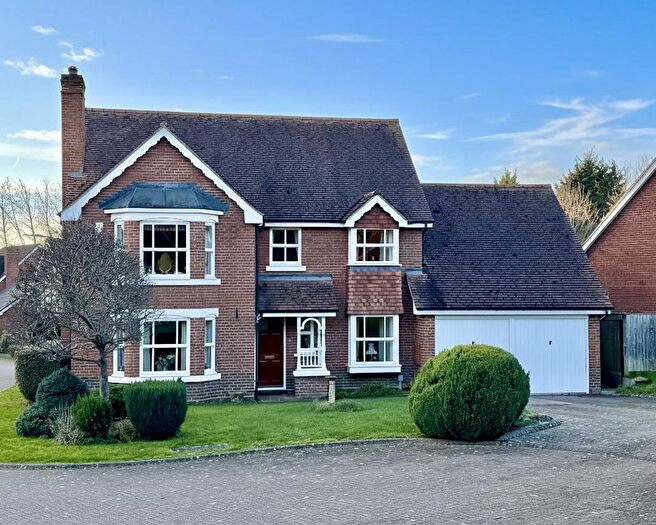
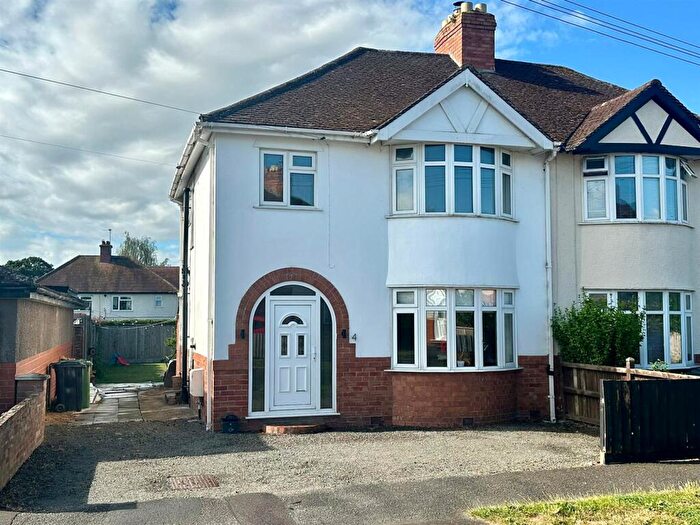
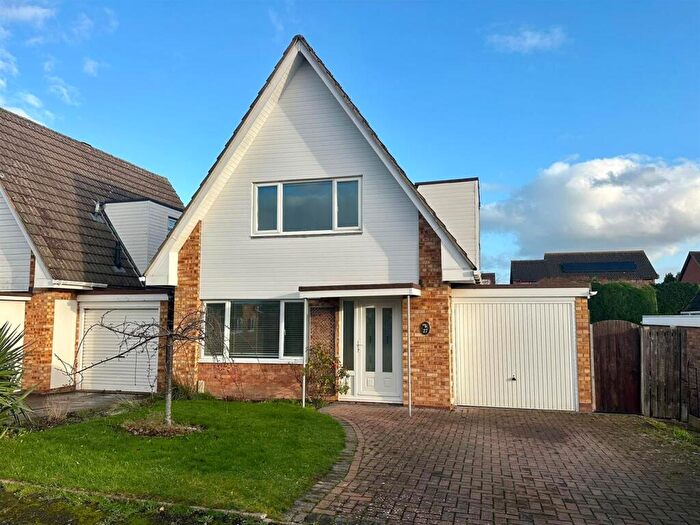
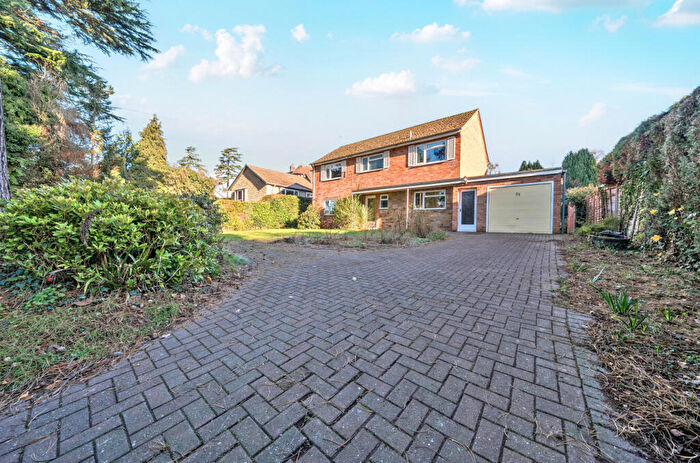
Properties for sale in Tupsley
Roads and Postcodes in Tupsley
Navigate through our locations to find the location of your next house in Tupsley, Hereford for sale or to rent.
| Streets | Postcodes |
|---|---|
| Alice Close | HR1 1XQ |
| Angela Close | HR1 1TZ |
| Aramstone Rise | HR1 1PN |
| Auckland Close | HR1 1YF |
| Backbury Road | HR1 1SD |
| Bartonsham Road | HR1 2SA |
| Biddulph Rise | HR1 1RA |
| Braemar Gardens | HR1 1SJ |
| Brockington Drive | HR1 1TA |
| Brookside | HR1 2RN HR1 2RW |
| Bullrush Close | HR1 2SU |
| Burden Road | HR1 1NW |
| Burrows Court | HR1 2SN |
| Canterbury Avenue | HR1 1QQ |
| Chilton Square | HR1 1PS |
| Church Road | HR1 1RP HR1 1RR HR1 1RS HR1 1RT |
| Cilcennin Close | HR1 1PU |
| Clive Street | HR1 2RG HR1 2SB |
| Clyst Lane | HR1 1TD |
| Collingwood Court | HR1 1PH |
| Croome Close | HR1 1UY |
| Crozens Lane | HR1 1XY |
| Dartmouth Court | HR1 1PJ |
| Deacons Field | HR1 1XH |
| Devereux Close | HR1 1QR |
| Dormington Drive | HR1 1SA |
| Dymond Close | HR1 2RP |
| Eastnor Drive | HR1 1PL |
| Eign Mill Road | HR1 2RS |
| Eign Road | HR1 2RU HR1 2RX HR1 2RY |
| Eleanor Avenue | HR1 1YE |
| Elgar Avenue | HR1 1TY |
| Farr Close | HR1 1QF |
| Florence Gardens | HR1 2NF |
| Foley Street | HR1 2SG HR1 2SQ |
| Folly Drive | HR1 1NE |
| Folly Lane | HR1 1LX HR1 1LY |
| Foxglove Court | HR1 2SW |
| Gaisford Close | HR1 1YG |
| Garnstone Rise | HR1 1PW |
| Goldsmith Close | HR1 1XE |
| Gorsty Lane | HR1 1UL HR1 1UN |
| Grandison Rise | HR1 1PP HR1 1PR |
| Green Street | HR1 2QW |
| Gurney Avenue | HR1 1XN HR1 1XW |
| Hafod Road | HR1 1SG HR1 1SQ |
| Hampton Dene Road | HR1 1UJ HR1 1UX HR1 1UU |
| Hampton Manor Close | HR1 1TG |
| Hampton Park Road | HR1 1TH HR1 1TJ HR1 1TL HR1 1TQ HR1 1US |
| Hampton Rise | HR1 1XJ |
| Hampton Street | HR1 2RA |
| Harold Street | HR1 2QU HR1 2QX |
| Harvey Road | HR1 1XB |
| Haycroft | HR1 1AU |
| Heywood Avenue | HR1 1QT |
| Holbrook Close | HR1 1TR |
| Holywell Gutter Lane | HR1 1XA |
| Honeysuckle Close | HR1 1XL |
| Johns Croft | HR1 1TE |
| Kentchurch Close | HR1 1QS |
| Kirkland Close | HR1 1XP |
| Knightswood | HR1 1UZ |
| Ledbury Court | HR1 2SH |
| Ledbury Road | HR1 1QD HR1 1QE HR1 1QL HR1 1QN HR1 1QW HR1 1RG HR1 1RH HR1 2SY HR1 2SZ HR1 2TB |
| Lichfield Avenue | HR1 2RH HR1 2RJ HR1 2RL |
| Lighton Close | HR1 1UH |
| Lincoln Close | HR1 1RX |
| Litley Close | HR1 1TN |
| Litley Court | HR1 1TP |
| Llanwye Close | HR1 1XX |
| Longworth Road | HR1 1SP |
| Lyall Close | HR1 1XG |
| Lyndhurst Avenue | HR1 1NL |
| Meadow Bank Road | HR1 2ST |
| Mount Crescent | HR1 1NF HR1 1NJ HR1 1NQ |
| Nevinson Place | HR1 1UF |
| Nightingale Way | HR1 2NQ |
| Nimrod Drive | HR1 1UG HR1 1UQ |
| Norbury Place | HR1 1UD |
| Old Eign Hill | HR1 1TU HR1 1TX HR1 1UA HR1 1UB |
| Parish Mews | HR1 2RF |
| Park Street | HR1 2RB HR1 2RD HR1 2RE |
| Perrystone Lane | HR1 1QY HR1 1QZ |
| Pigott Close | HR1 1PQ |
| Portfield Street | HR1 2SD HR1 2SE |
| Prospect Walk | HR1 1NX HR1 1NY HR1 1NZ HR1 1PA HR1 1PB HR1 1PD |
| Quarry Road | HR1 1SL HR1 1SS HR1 1ST HR1 1SU HR1 1SX |
| Quay Close | HR1 2RQ |
| Queens Wood Drive | HR1 1AT |
| Radcliffe Court | HR1 1PT |
| River Meadows | HR1 1TB |
| Rosemary Gardens | HR1 1UP HR1 1UR HR1 1UW |
| Rowland Close | HR1 1XF |
| Ryder Close | HR1 1XR |
| Salisbury Avenue | HR1 1QG |
| Sandys Close | HR1 1YQ |
| Scots Close | HR1 2RT |
| Seaton Avenue | HR1 1NN HR1 1NP HR1 1NR |
| Sedgefield Road | HR1 2RR |
| Siddons Road | HR1 1XD |
| Sinclair Drive | HR1 1UE |
| Somers Walk | HR1 1QX |
| Spinney Grove | HR1 1AY |
| St Margarets Road | HR1 1TS |
| St Paul Road | HR1 1SR |
| Stopford Close | HR1 1TW |
| Sudbury Avenue | HR1 1XS HR1 1XT HR1 1XU HR1 1YA HR1 1YB HR1 1YD HR1 1XZ |
| Talbot Terrace | HR1 2QT |
| The Knoll | HR1 1RU |
| The Nook | HR1 1NH |
| The Park | HR1 1TF |
| Thistledown Grove | HR1 1AZ |
| Traherne Place | HR1 1QU |
| Tristram Court | HR1 1RZ |
| Underhill Road | HR1 1SY HR1 1SZ |
| Vineyard Road | HR1 1TT |
| Welbeck Avenue | HR1 1NG |
| Wellington Place | HR1 1SN HR1 1SW |
| Westminster Avenue | HR1 1QH |
| Weston Close | HR1 1SB |
| Whitehouse Way | HR1 1PX |
| Whittern Way | HR1 1PE HR1 1PF HR1 1PG HR1 1QP |
| Winchester Avenue | HR1 1QJ |
| Wye Way | HR1 2NP |
Transport near Tupsley
- FAQ
- Price Paid By Year
- Property Type Price
Frequently asked questions about Tupsley
What is the average price for a property for sale in Tupsley?
The average price for a property for sale in Tupsley is £315,822. This amount is 0.74% higher than the average price in Hereford. There are 1,011 property listings for sale in Tupsley.
What streets have the most expensive properties for sale in Tupsley?
The streets with the most expensive properties for sale in Tupsley are Hampton Park Road at an average of £860,500, Vineyard Road at an average of £685,000 and The Park at an average of £662,333.
What streets have the most affordable properties for sale in Tupsley?
The streets with the most affordable properties for sale in Tupsley are Chilton Square at an average of £82,500, Radcliffe Court at an average of £152,500 and Eastnor Drive at an average of £152,900.
Which train stations are available in or near Tupsley?
Some of the train stations available in or near Tupsley are Hereford, Ledbury and Leominster.
Property Price Paid in Tupsley by Year
The average sold property price by year was:
| Year | Average Sold Price | Price Change |
Sold Properties
|
|---|---|---|---|
| 2025 | £309,566 | -3% |
95 Properties |
| 2024 | £318,134 | 0,2% |
145 Properties |
| 2023 | £317,646 | 3% |
142 Properties |
| 2022 | £307,547 | 10% |
147 Properties |
| 2021 | £278,306 | 5% |
203 Properties |
| 2020 | £264,653 | 8% |
143 Properties |
| 2019 | £242,515 | 1% |
121 Properties |
| 2018 | £241,104 | 6% |
161 Properties |
| 2017 | £225,462 | -3% |
145 Properties |
| 2016 | £231,691 | 4% |
169 Properties |
| 2015 | £222,513 | 13% |
158 Properties |
| 2014 | £194,620 | -2% |
155 Properties |
| 2013 | £198,990 | -1% |
142 Properties |
| 2012 | £200,924 | 5% |
147 Properties |
| 2011 | £191,457 | -8% |
109 Properties |
| 2010 | £205,859 | 13% |
95 Properties |
| 2009 | £178,620 | -15% |
129 Properties |
| 2008 | £204,637 | -4% |
100 Properties |
| 2007 | £213,670 | 6% |
184 Properties |
| 2006 | £201,290 | 5% |
220 Properties |
| 2005 | £190,868 | 8% |
163 Properties |
| 2004 | £175,215 | 16% |
220 Properties |
| 2003 | £147,820 | 16% |
188 Properties |
| 2002 | £124,680 | 10% |
197 Properties |
| 2001 | £111,794 | 14% |
216 Properties |
| 2000 | £95,844 | 7% |
149 Properties |
| 1999 | £88,756 | -2% |
191 Properties |
| 1998 | £90,344 | 20% |
226 Properties |
| 1997 | £72,279 | 19% |
180 Properties |
| 1996 | £58,320 | -5% |
162 Properties |
| 1995 | £61,335 | - |
153 Properties |
Property Price per Property Type in Tupsley
Here you can find historic sold price data in order to help with your property search.
The average Property Paid Price for specific property types in the last three years are:
| Property Type | Average Sold Price | Sold Properties |
|---|---|---|
| Flat | £185,277.00 | 36 Flats |
| Semi Detached House | £316,187.00 | 144 Semi Detached Houses |
| Detached House | £433,962.00 | 109 Detached Houses |
| Terraced House | £227,324.00 | 93 Terraced Houses |

