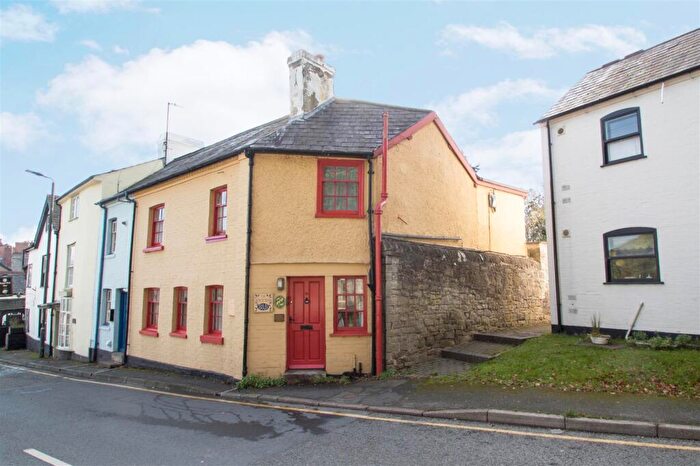
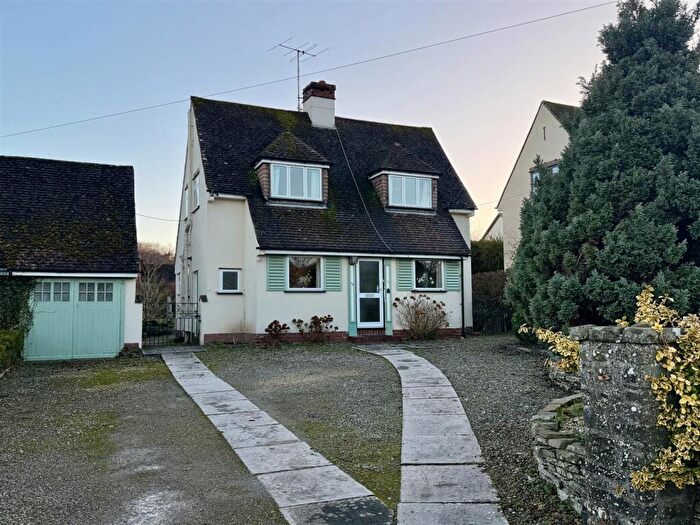
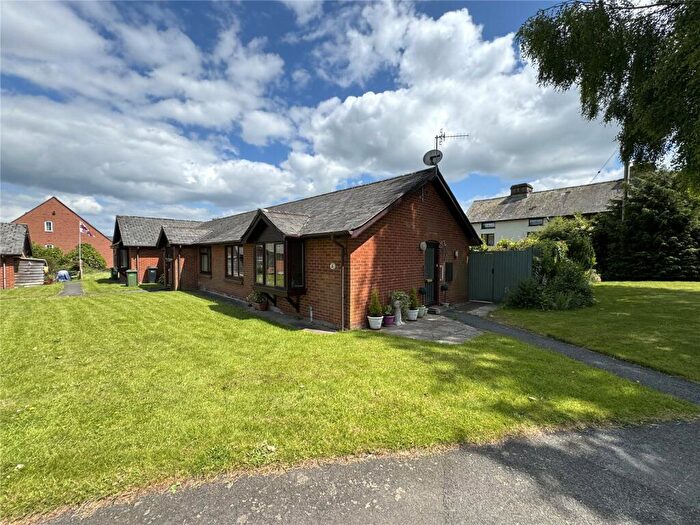
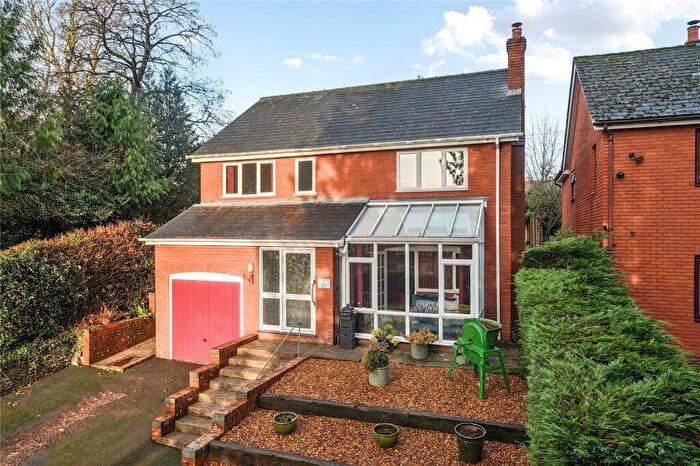
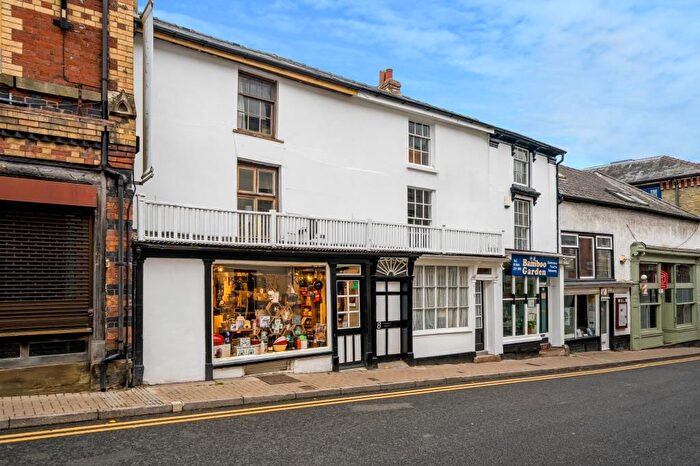
Houses for sale & to rent in Kington Town, Kington
House Prices in Kington Town
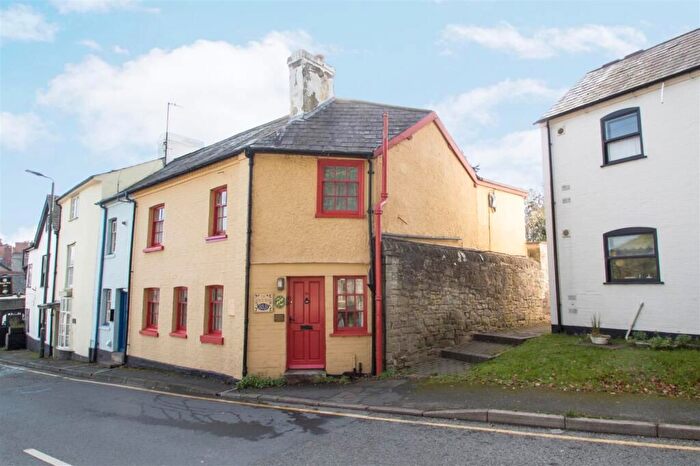
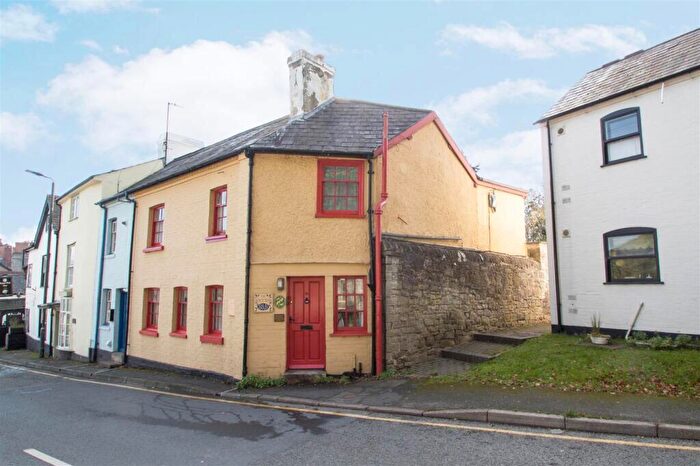
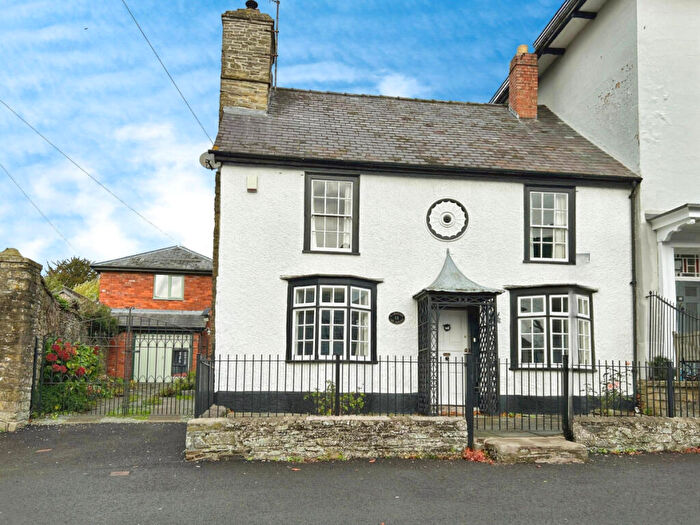
Properties in Kington Town have an average house price of £262,004.00 and had 159 Property Transactions within the last 3 years¹.
Kington Town is an area in Kington, County of Herefordshire with 1,356 households², where the most expensive property was sold for £1,107,500.00.
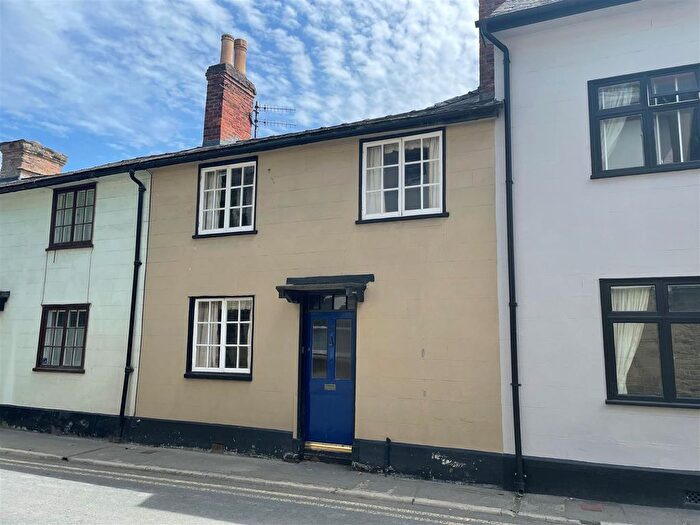
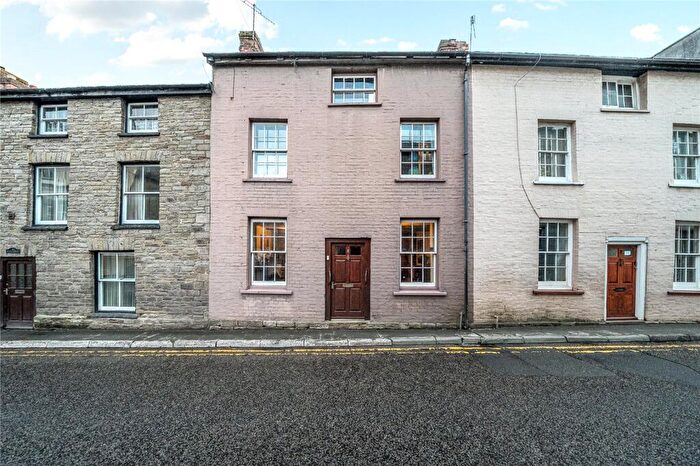
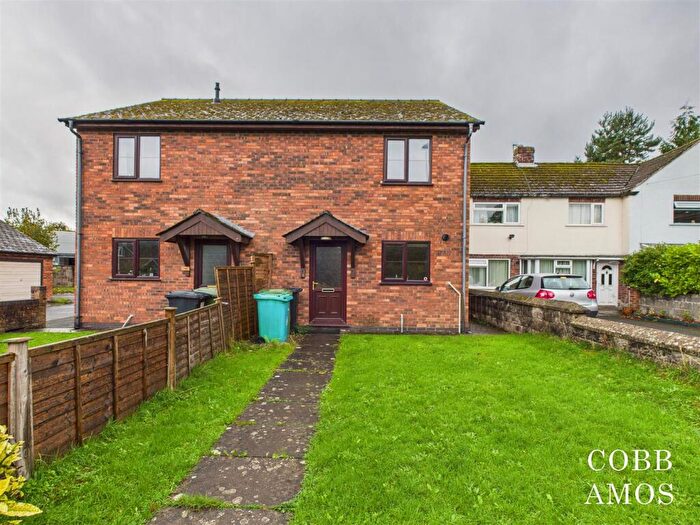
Properties for sale in Kington Town
Roads and Postcodes in Kington Town
Navigate through our locations to find the location of your next house in Kington Town, Kington for sale or to rent.
| Streets | Postcodes |
|---|---|
| Aconbury Leigh | HR5 3GB |
| Ashmoor Place | HR5 3EB |
| Banley Drive | HR5 3FD |
| Beechgrove | HR5 3RH |
| Black Barn Close | HR5 3FB |
| Bradnor View Close | HR5 3UA |
| Bridge Street | HR5 3DJ HR5 3DL HR5 3DW HR5 3DX |
| Campion Lane | HR5 3UB |
| Castle Hill | HR5 3AH |
| Church Road | HR5 3AG |
| Church Street | HR5 3AZ HR5 3BE |
| Churchill Road | HR5 3AJ |
| Coronation Road | HR5 3BU |
| Crooked Well | HR5 3AF |
| Cutterbach Lane | HR5 3EH |
| Doctors Lane | HR5 3BB |
| Duke Street | HR5 3BL HR5 3DR |
| Eardisley Road | HR5 3EA HR5 3FA |
| Elizabeth Road | HR5 3DB |
| Foundry Bungalows | HR5 3DA |
| Garden Close | HR5 3FJ |
| Gravel Hill | HR5 3BS |
| Gravel Hill Drive | HR5 3AE |
| Greenfield Drive | HR5 3AD |
| Greenfields | HR5 3AA |
| Hatton Gardens | HR5 3DD |
| Hatton Gardens Industrial Estate | HR5 3RB |
| Headbrook | HR5 3DY HR5 3DZ |
| Hergest Road | HR5 3EL HR5 3EQ |
| High Street | HR5 3AX HR5 3BJ HR5 3TA |
| Island Terrace | HR5 3DT |
| Kingswood Road | HR5 3HE |
| Llewellin Road | HR5 3AB |
| Lower Cross | HR5 3BG |
| Market Hall Street | HR5 3DP |
| Meads Close | HR5 3TB |
| Mill Street | HR5 3AL |
| Montfort Fields | HR5 3AT |
| Newton Row | HR5 3NG |
| Oak Plock | HR5 3TF |
| Orchard Rise | HR5 3FH |
| Oxford Lane | HR5 3ED |
| Park Avenue | HR5 3AN |
| Park Green | HR5 3AP |
| Park Road | HR5 3AW |
| Park View | HR5 3AR |
| Perseverance Close | HR5 3DS |
| Prospect Place | HR5 3AY |
| Rushock Bank | HR5 3RY |
| School Close | HR5 3HN |
| Sunset Row | HR5 3DF |
| Sunset Yard | HR5 3SG |
| Sutton Walls Grove | HR5 3GH |
| Tan House Meadows | HR5 3TD |
| The Crescent | HR5 3AS |
| The Meads | HR5 3DQ |
| The Square | HR5 3BA |
| The Wych | HR5 3AQ |
| Victoria Road | HR5 3BX HR5 3FG |
| Wall Hills Close | HR5 3GA |
| Walnut Gardens | HR5 3DN |
| Waterloo Road | HR5 3DE |
| Wishlades Row | HR5 3BN |
| HR5 3EF HR5 3EN HR5 3ER HR5 3ET HR5 3EW HR5 3EZ HR5 3HB HR5 3HD HR5 3HH HR5 3HJ HR5 3HL HR5 3HP HR5 3HQ HR5 3NE HR5 3NF HR5 3NH HR5 3NL HR5 3NN HR5 3NQ HR5 3RE HR5 3RF HR5 3RZ HR5 3SB |
Transport near Kington Town
-
Knighton Station
-
Knucklas Station
-
Bucknell Station
-
Llangynllo Station
-
Dolau Station
-
Llanbister Road Station
-
Leominster Station
-
Pen-Y-Bont Station
-
Hopton Heath Station
-
Llandrindod Station
- FAQ
- Price Paid By Year
- Property Type Price
Frequently asked questions about Kington Town
What is the average price for a property for sale in Kington Town?
The average price for a property for sale in Kington Town is £262,004. This amount is 7% lower than the average price in Kington. There are 306 property listings for sale in Kington Town.
What streets have the most expensive properties for sale in Kington Town?
The streets with the most expensive properties for sale in Kington Town are The Wych at an average of £560,000, Oxford Lane at an average of £425,000 and Hergest Road at an average of £422,333.
What streets have the most affordable properties for sale in Kington Town?
The streets with the most affordable properties for sale in Kington Town are Lower Cross at an average of £83,500, Sunset Row at an average of £110,000 and Walnut Gardens at an average of £125,600.
Which train stations are available in or near Kington Town?
Some of the train stations available in or near Kington Town are Knighton, Knucklas and Bucknell.
Property Price Paid in Kington Town by Year
The average sold property price by year was:
| Year | Average Sold Price | Price Change |
Sold Properties
|
|---|---|---|---|
| 2025 | £286,248 | 17% |
36 Properties |
| 2024 | £236,488 | -10% |
45 Properties |
| 2023 | £260,258 | -3% |
29 Properties |
| 2022 | £268,658 | 22% |
49 Properties |
| 2021 | £208,507 | -3% |
67 Properties |
| 2020 | £214,983 | 22% |
30 Properties |
| 2019 | £167,196 | -18% |
48 Properties |
| 2018 | £196,571 | 0,3% |
45 Properties |
| 2017 | £195,945 | 4% |
47 Properties |
| 2016 | £187,814 | 1% |
54 Properties |
| 2015 | £185,348 | -5% |
53 Properties |
| 2014 | £195,147 | 19% |
35 Properties |
| 2013 | £158,728 | -2% |
35 Properties |
| 2012 | £162,555 | -21% |
36 Properties |
| 2011 | £197,099 | 8% |
45 Properties |
| 2010 | £180,779 | 14% |
61 Properties |
| 2009 | £155,485 | -22% |
41 Properties |
| 2008 | £189,498 | -13% |
28 Properties |
| 2007 | £213,343 | 3% |
53 Properties |
| 2006 | £207,944 | 20% |
51 Properties |
| 2005 | £166,126 | 1% |
32 Properties |
| 2004 | £164,727 | 10% |
66 Properties |
| 2003 | £148,356 | 29% |
47 Properties |
| 2002 | £105,674 | 13% |
58 Properties |
| 2001 | £92,368 | 10% |
69 Properties |
| 2000 | £83,077 | 25% |
52 Properties |
| 1999 | £62,039 | -24% |
55 Properties |
| 1998 | £77,179 | 13% |
39 Properties |
| 1997 | £67,263 | 22% |
41 Properties |
| 1996 | £52,698 | -23% |
37 Properties |
| 1995 | £64,660 | - |
29 Properties |
Property Price per Property Type in Kington Town
Here you can find historic sold price data in order to help with your property search.
The average Property Paid Price for specific property types in the last three years are:
| Property Type | Average Sold Price | Sold Properties |
|---|---|---|
| Semi Detached House | £233,538.00 | 40 Semi Detached Houses |
| Detached House | £342,672.00 | 64 Detached Houses |
| Terraced House | £202,752.00 | 46 Terraced Houses |
| Flat | £117,722.00 | 9 Flats |

