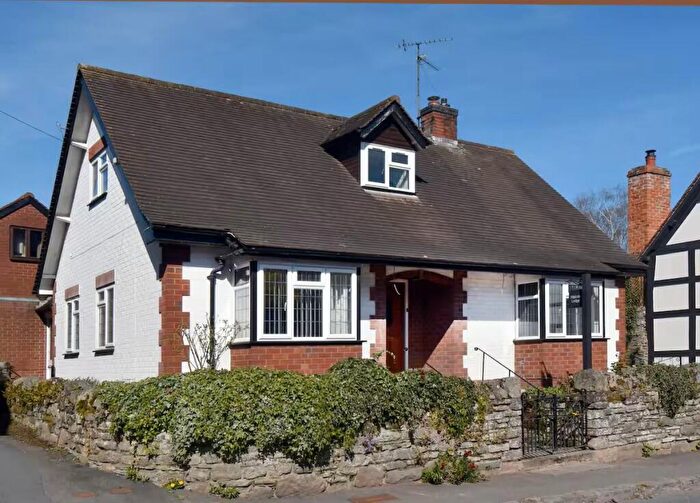
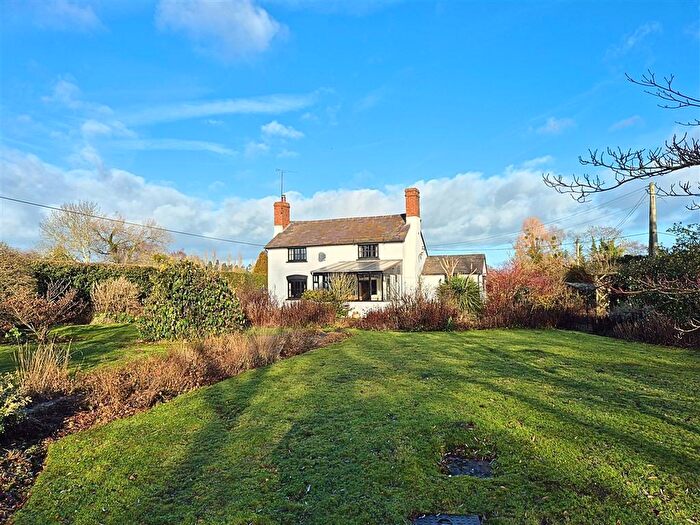
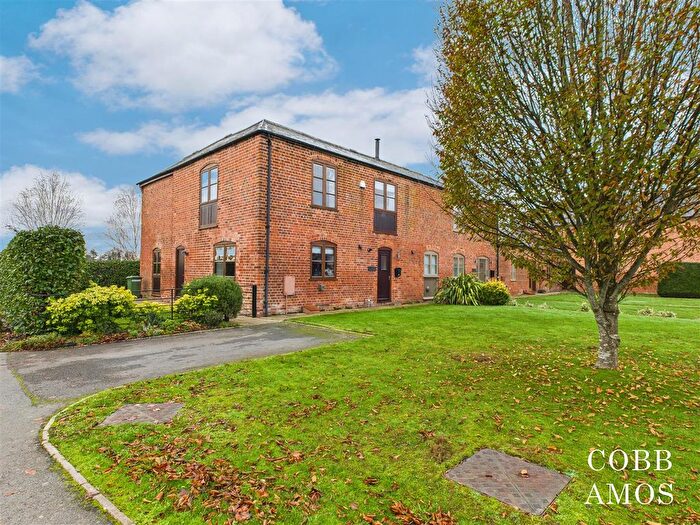
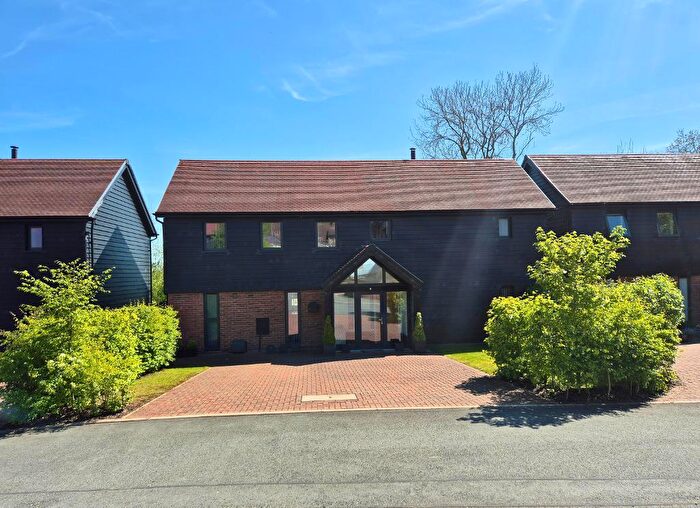
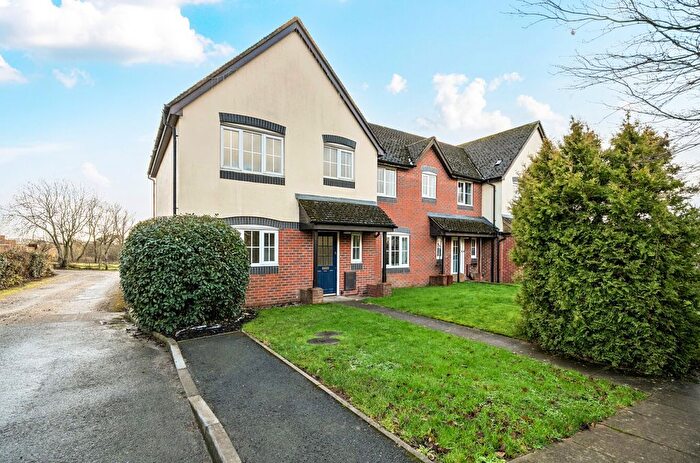
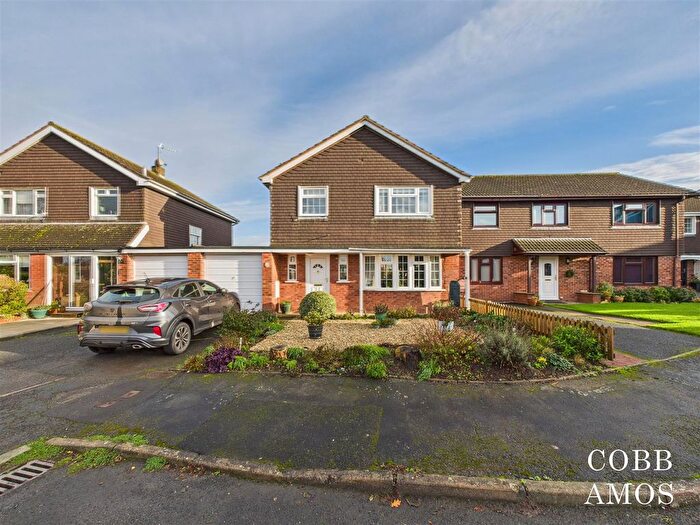
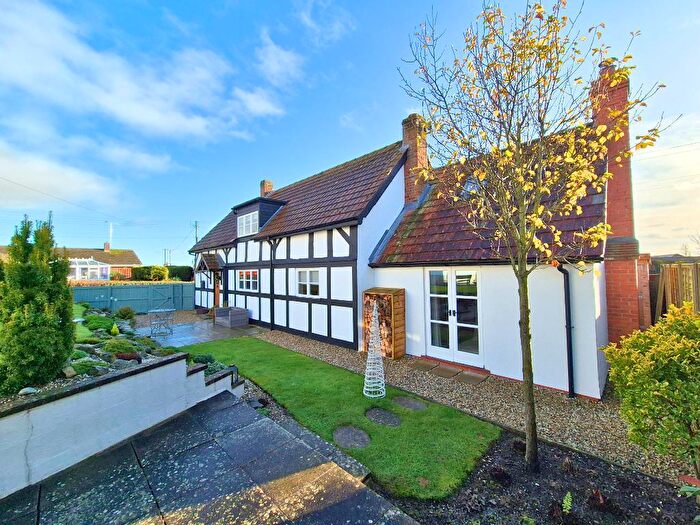
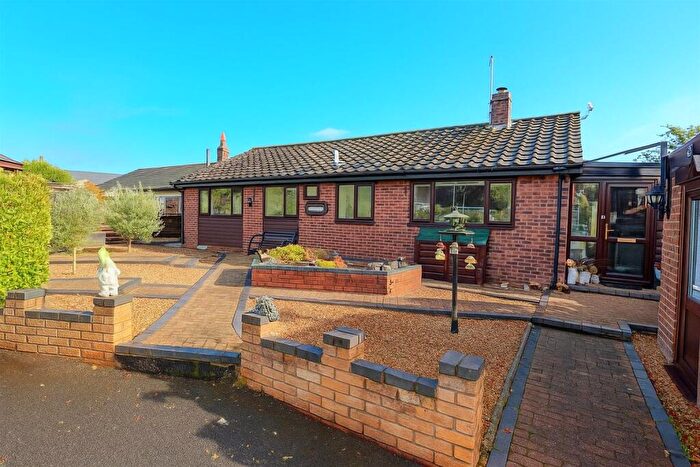
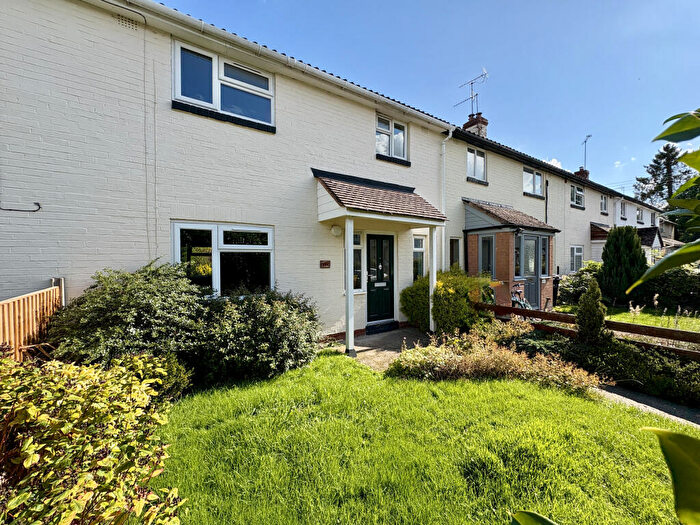
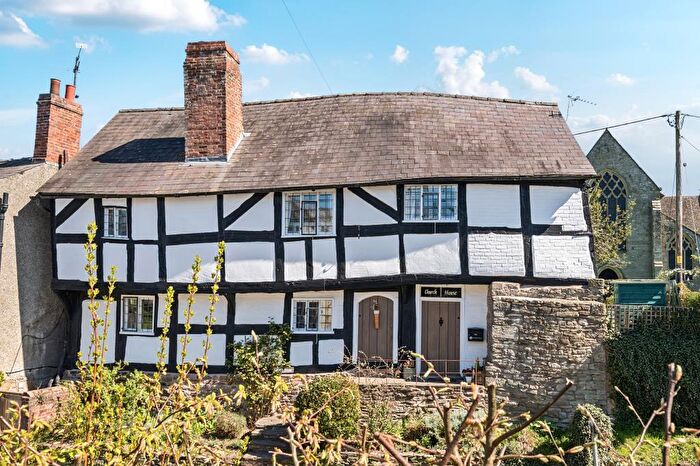
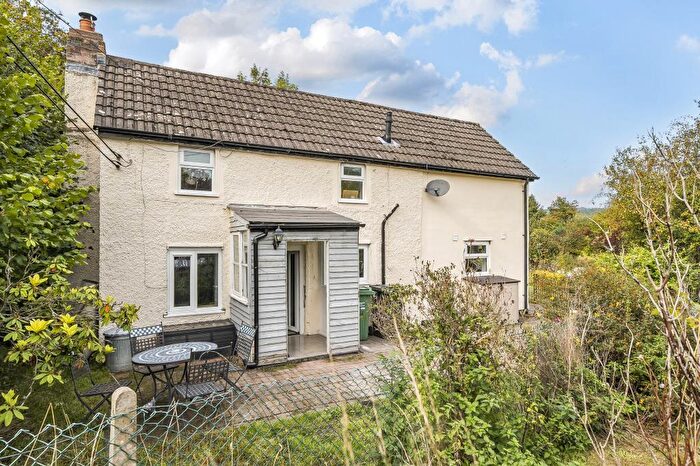
Houses for sale & to rent in Pembridge And Lyonshall With Titley, Leominster
House Prices in Pembridge And Lyonshall With Titley
Properties in Pembridge And Lyonshall With Titley have an average house price of £403,811.00 and had 93 Property Transactions within the last 3 years¹.
Pembridge And Lyonshall With Titley is an area in Leominster, County of Herefordshire with 761 households², where the most expensive property was sold for £2,125,000.00.
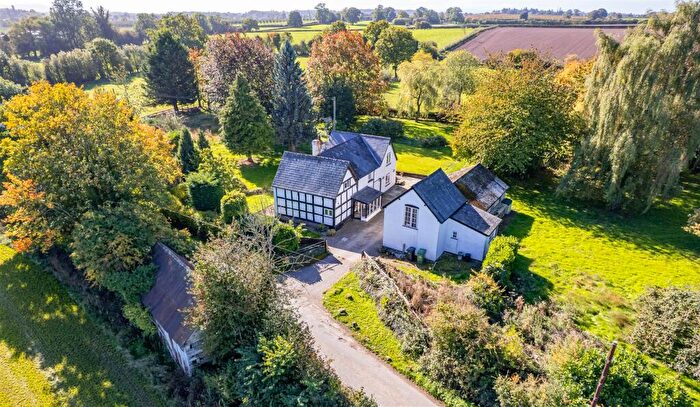
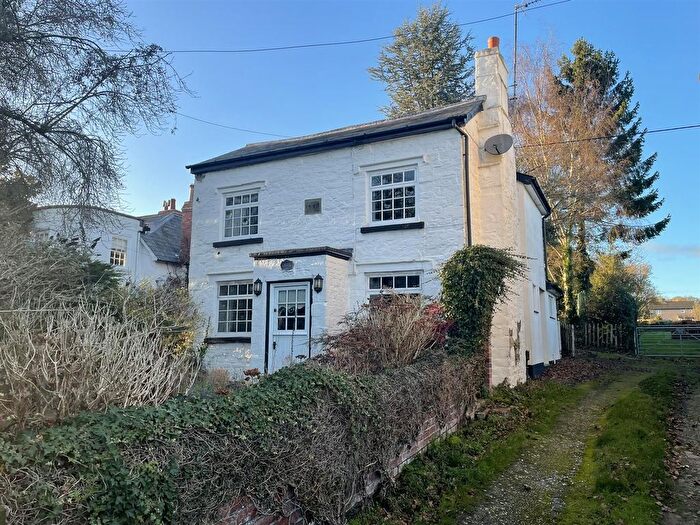
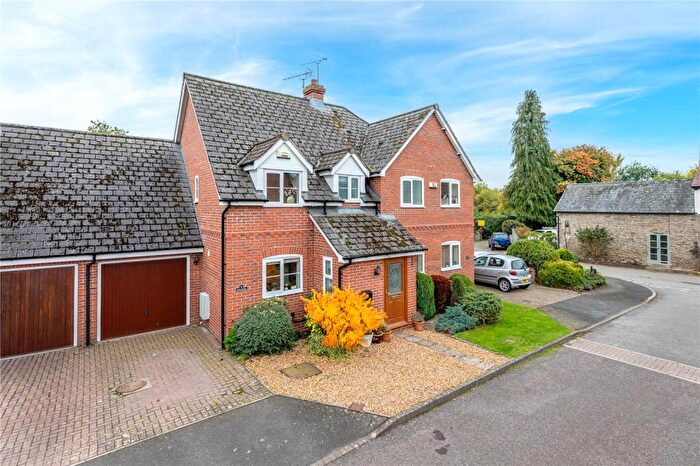
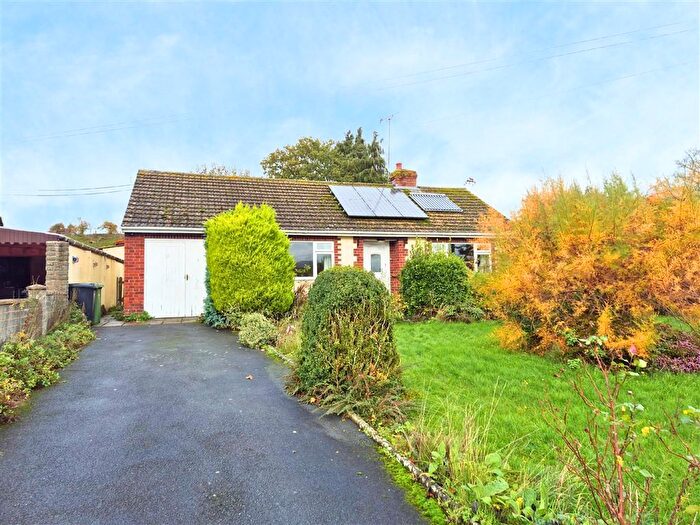
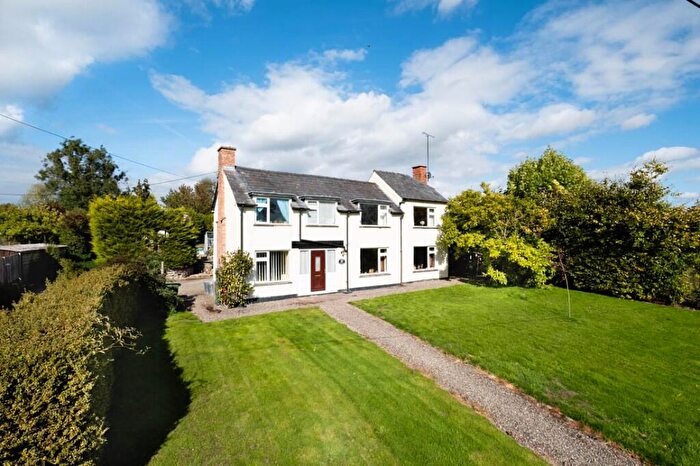
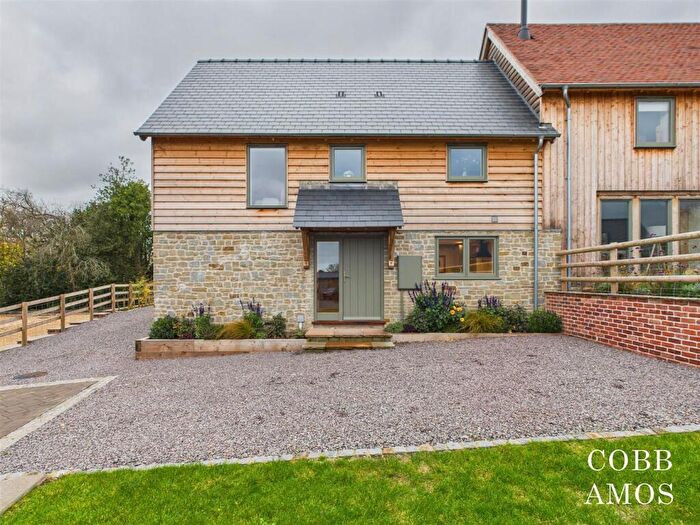
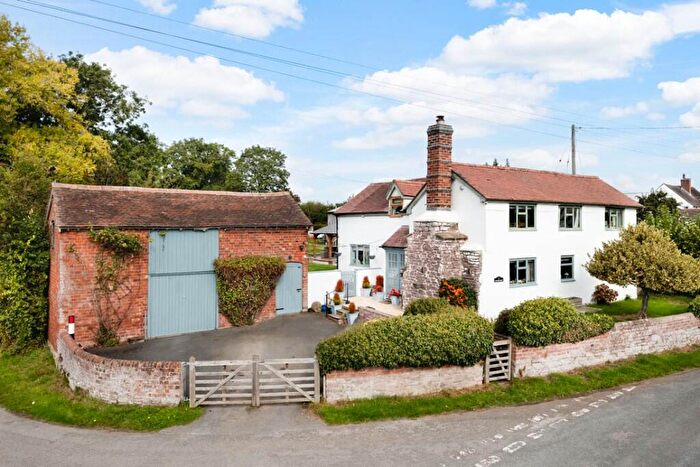
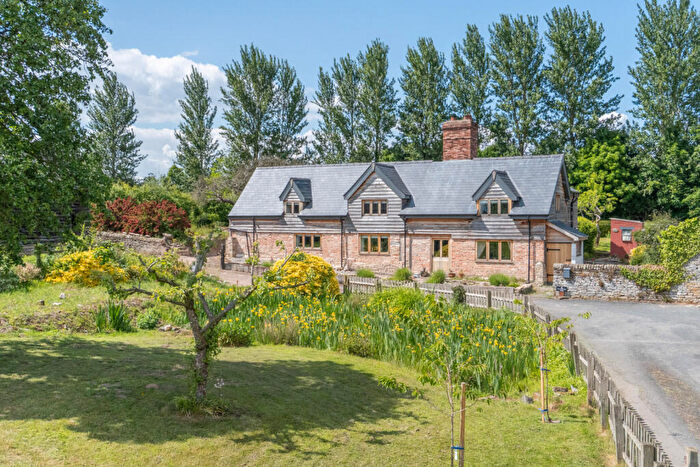
Properties for sale in Pembridge And Lyonshall With Titley
Roads and Postcodes in Pembridge And Lyonshall With Titley
Navigate through our locations to find the location of your next house in Pembridge And Lyonshall With Titley, Leominster for sale or to rent.
| Streets | Postcodes |
|---|---|
| Bateman Close | HR6 9NW |
| Bearwood Lane | HR6 9EA |
| Bridge Street | HR6 9ES HR6 9EU HR6 9EX HR6 9EY |
| Church Crescent | HR6 9HH |
| Court Meadow | HR6 9EW |
| Curl View Crescent | HR6 9HQ |
| East Street | HR6 9HA HR6 9HB |
| Easthampton | HR6 9NZ |
| Gorsty | HR6 9JF |
| Hanbury Green | HR6 9NS |
| High Street | HR6 9DS HR6 9DT |
| Manley Crescent | HR6 9EB |
| Manley Lane | HR6 9DR |
| Market Square | HR6 9DZ |
| Marston | HR6 9JA HR6 9JB |
| Moor Meadow | HR6 9NT |
| Noke Lane | HR6 9HP |
| Parsons Walk | HR6 9EP |
| Pembridge | HR6 9HL HR6 9HN HR6 9HW HR6 9HY HR6 9HZ HR6 9JZ |
| Roseville Terrace | HR6 9LR |
| Staunton-on-arrow | HR6 9HR HR6 9HS HR6 9LD HR6 9LE HR6 9LF |
| Suckley Lane | HR6 9DW |
| The Birches | HR6 9NG |
| The Grove | HR6 9NF |
| Uphampton | HR6 9PA HR6 9PB |
| West Street | HR6 9DU HR6 9DX HR6 9DY |
| Weston | HR6 9JE |
| Yew Tree Close | HR6 9LU |
| HR6 9ED HR6 9EE HR6 9EF HR6 9EQ HR6 9JH HR6 9JJ HR6 9JQ HR6 9JR HR6 9LG HR6 9LL HR6 9LT HR6 9LW HR6 9LX HR6 9LY HR6 9NB HR6 9ND HR6 9NE HR6 9NH HR6 9NJ HR6 9NL HR6 9NN HR6 9NQ HR6 9NX HR6 9NY |
Transport near Pembridge And Lyonshall With Titley
- FAQ
- Price Paid By Year
- Property Type Price
Frequently asked questions about Pembridge And Lyonshall With Titley
What is the average price for a property for sale in Pembridge And Lyonshall With Titley?
The average price for a property for sale in Pembridge And Lyonshall With Titley is £403,811. This amount is 30% higher than the average price in Leominster. There are 352 property listings for sale in Pembridge And Lyonshall With Titley.
What streets have the most expensive properties for sale in Pembridge And Lyonshall With Titley?
The streets with the most expensive properties for sale in Pembridge And Lyonshall With Titley are Weston at an average of £630,000, Staunton-on-arrow at an average of £554,333 and Parsons Walk at an average of £431,250.
What streets have the most affordable properties for sale in Pembridge And Lyonshall With Titley?
The streets with the most affordable properties for sale in Pembridge And Lyonshall With Titley are Moor Meadow at an average of £155,833, Church Crescent at an average of £207,000 and The Birches at an average of £217,000.
Which train stations are available in or near Pembridge And Lyonshall With Titley?
Some of the train stations available in or near Pembridge And Lyonshall With Titley are Leominster, Bucknell and Knighton.
Property Price Paid in Pembridge And Lyonshall With Titley by Year
The average sold property price by year was:
| Year | Average Sold Price | Price Change |
Sold Properties
|
|---|---|---|---|
| 2025 | £326,615 | -62% |
13 Properties |
| 2024 | £529,800 | 32% |
25 Properties |
| 2023 | £357,814 | -4% |
27 Properties |
| 2022 | £371,517 | -4% |
28 Properties |
| 2021 | £387,204 | -10% |
44 Properties |
| 2020 | £426,923 | 26% |
23 Properties |
| 2019 | £314,907 | 1% |
27 Properties |
| 2018 | £311,208 | 13% |
31 Properties |
| 2017 | £271,028 | 2% |
35 Properties |
| 2016 | £266,624 | 8% |
33 Properties |
| 2015 | £245,984 | -8% |
35 Properties |
| 2014 | £264,958 | 18% |
30 Properties |
| 2013 | £217,607 | -49% |
14 Properties |
| 2012 | £323,549 | 18% |
15 Properties |
| 2011 | £266,154 | 13% |
34 Properties |
| 2010 | £231,121 | -2% |
16 Properties |
| 2009 | £235,026 | -27% |
19 Properties |
| 2008 | £299,454 | -7% |
22 Properties |
| 2007 | £319,583 | 20% |
36 Properties |
| 2006 | £257,030 | 9% |
38 Properties |
| 2005 | £234,892 | 10% |
26 Properties |
| 2004 | £211,645 | 13% |
34 Properties |
| 2003 | £183,156 | 22% |
43 Properties |
| 2002 | £142,391 | 8% |
48 Properties |
| 2001 | £131,513 | 16% |
29 Properties |
| 2000 | £110,711 | -1% |
45 Properties |
| 1999 | £111,658 | -2% |
37 Properties |
| 1998 | £113,975 | 29% |
38 Properties |
| 1997 | £80,389 | 3% |
19 Properties |
| 1996 | £77,835 | 2% |
20 Properties |
| 1995 | £76,111 | - |
19 Properties |
Property Price per Property Type in Pembridge And Lyonshall With Titley
Here you can find historic sold price data in order to help with your property search.
The average Property Paid Price for specific property types in the last three years are:
| Property Type | Average Sold Price | Sold Properties |
|---|---|---|
| Semi Detached House | £314,593.00 | 16 Semi Detached Houses |
| Detached House | £504,320.00 | 53 Detached Houses |
| Terraced House | £241,333.00 | 24 Terraced Houses |

