
Houses for sale & to rent in Coulsdon, Croydon London Borough
House Prices in Coulsdon
Properties in this part of Coulsdon within the Croydon London Borough have an average house price of £548k and had 902 Property Transactions within the last 3 years.¹ This area has 8,398 households² , where the most expensive property was sold for £2.2M.
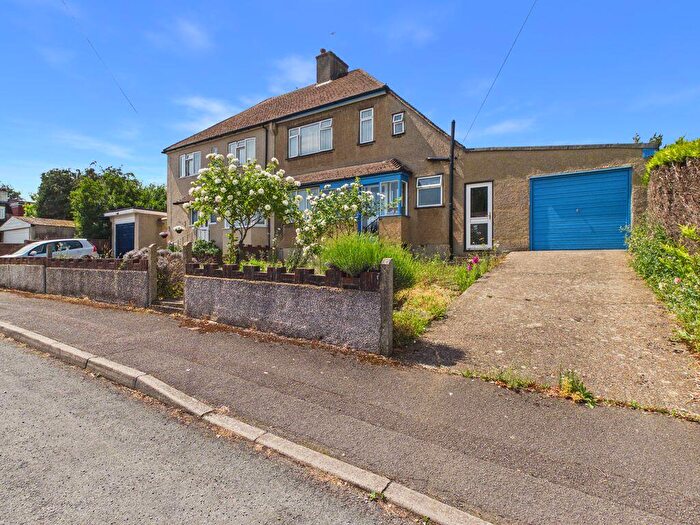
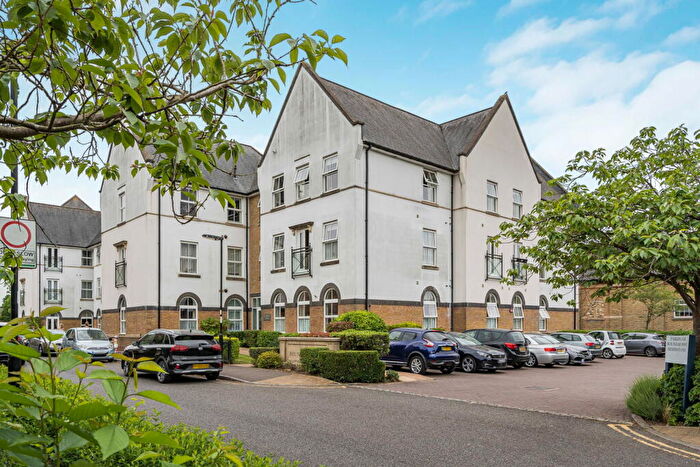
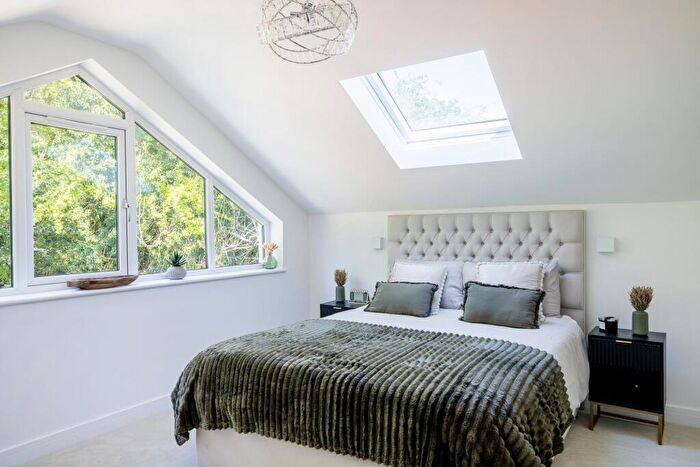
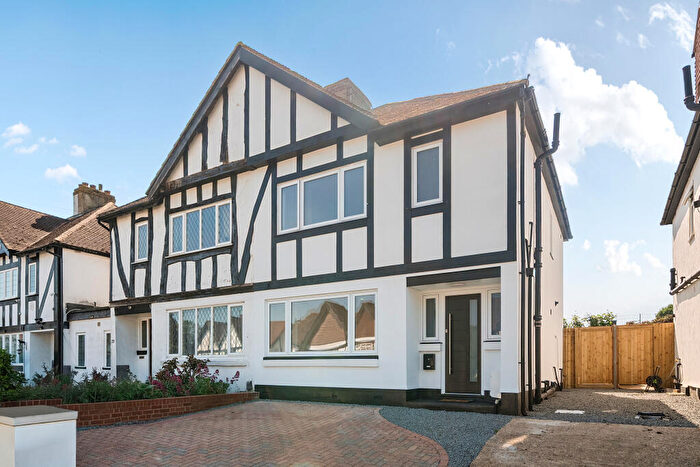
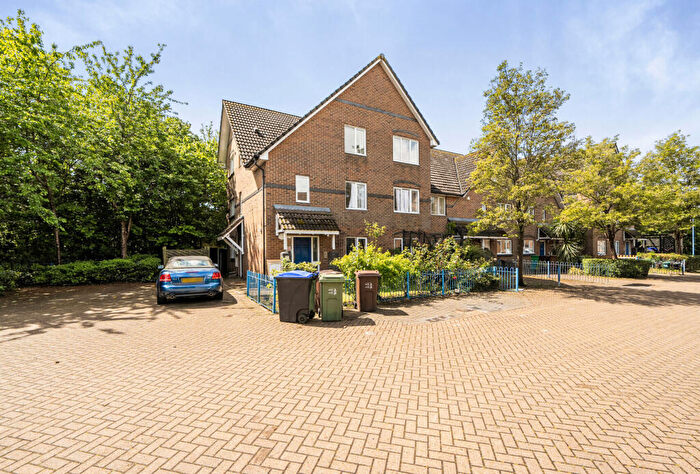
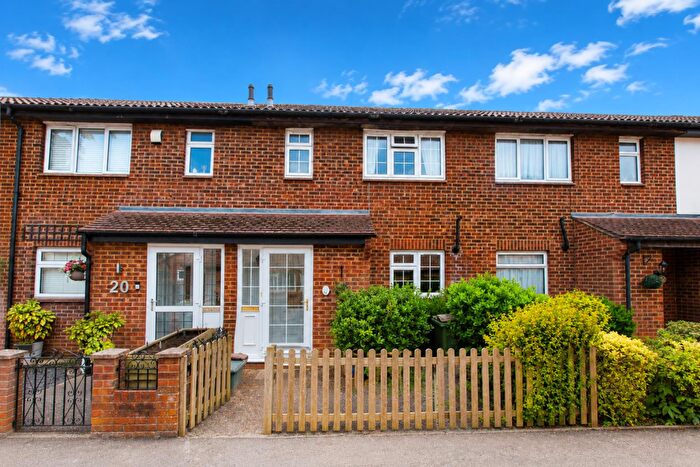
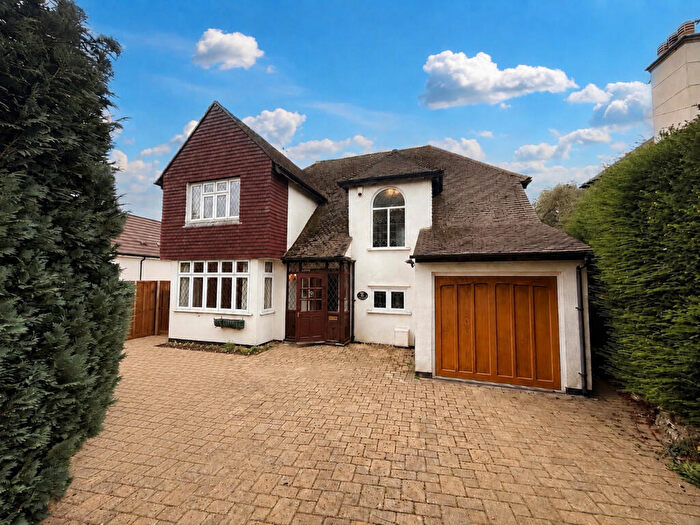
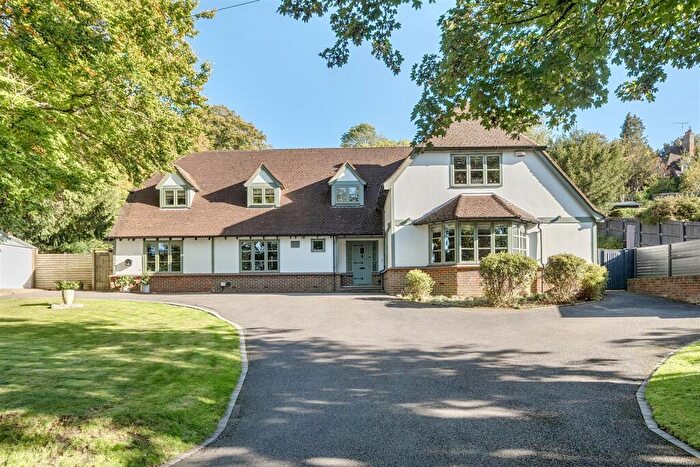
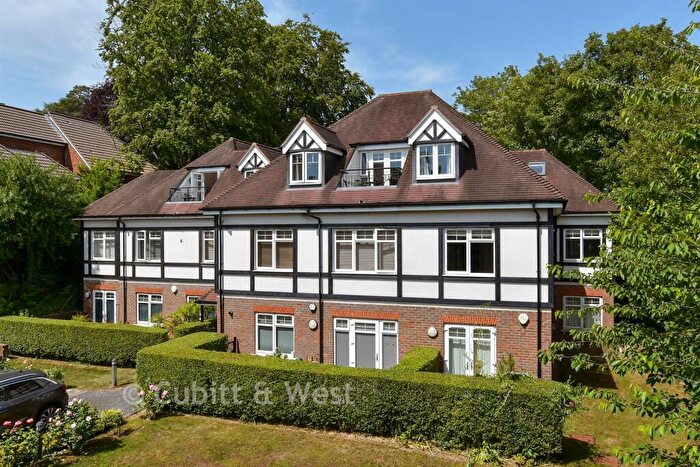
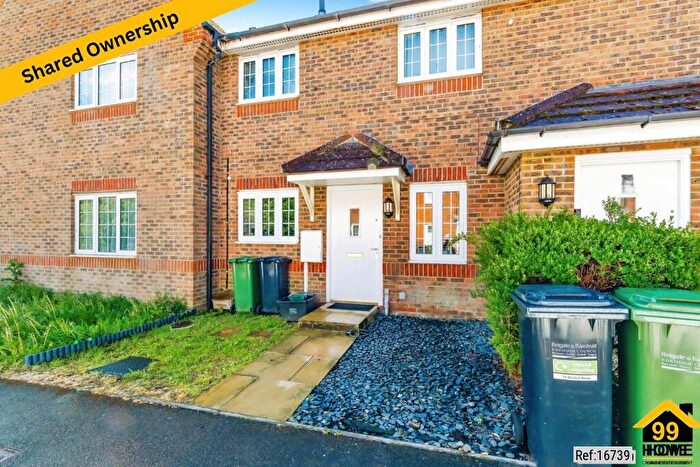
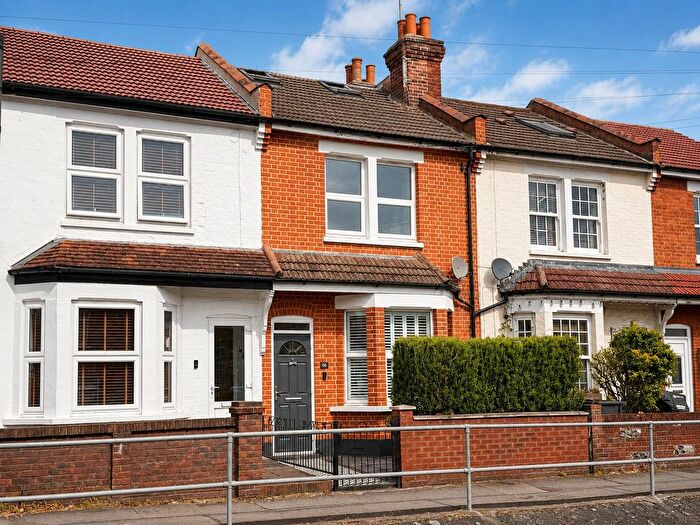
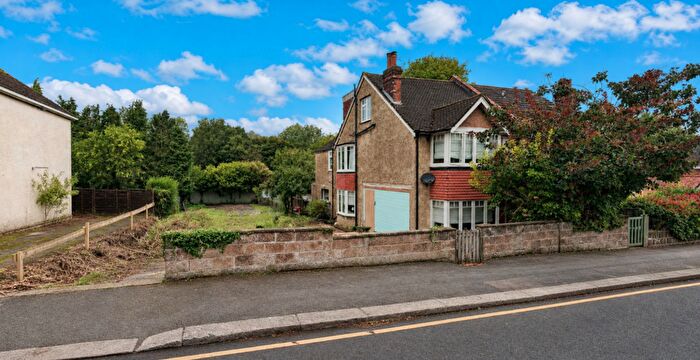
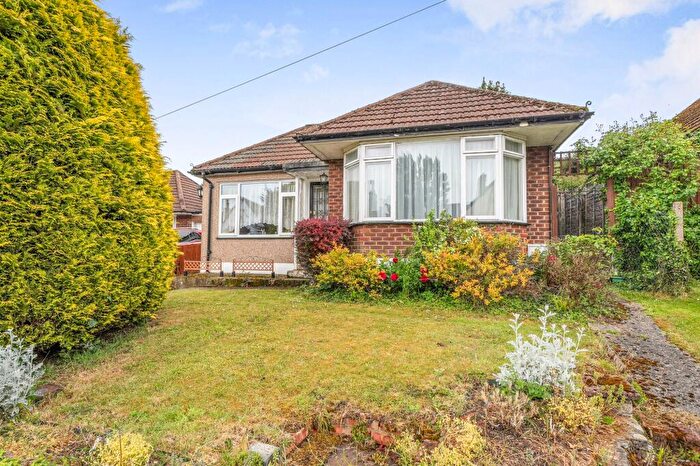
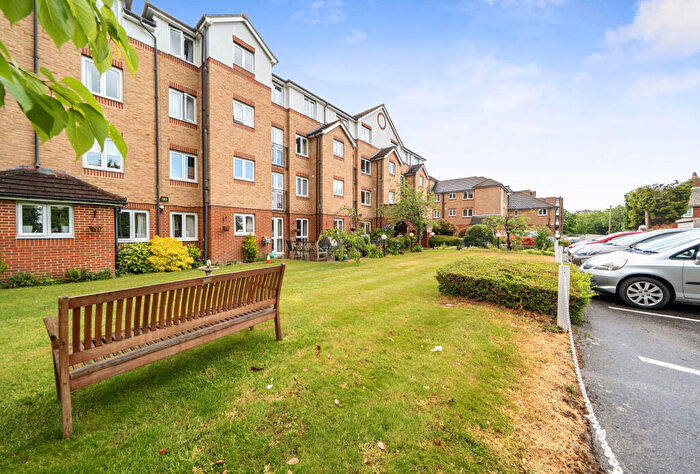
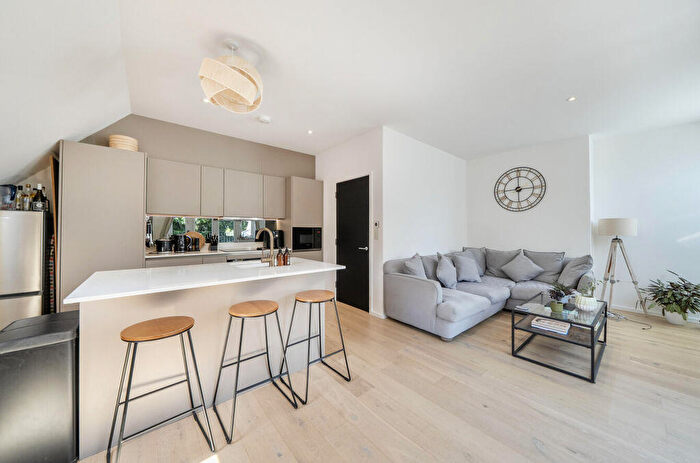
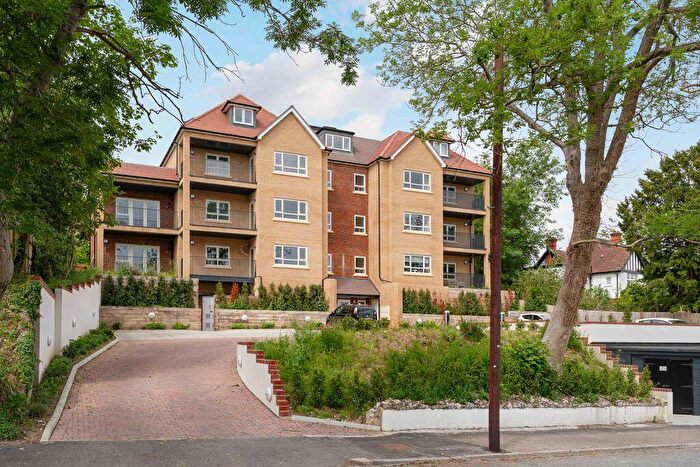
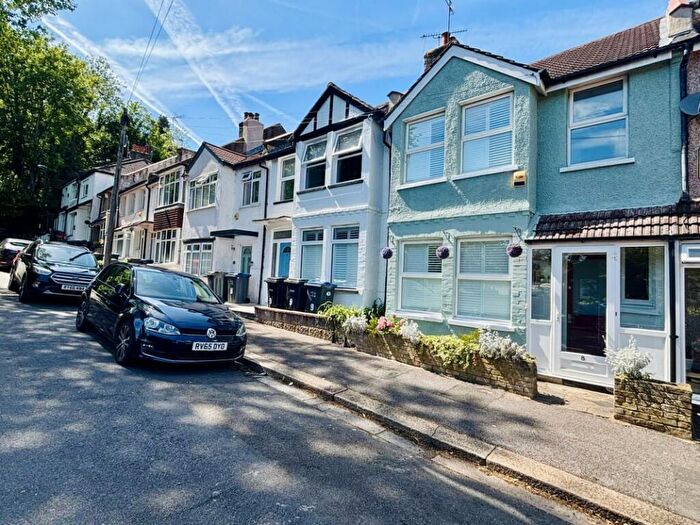
Properties for sale in Coulsdon
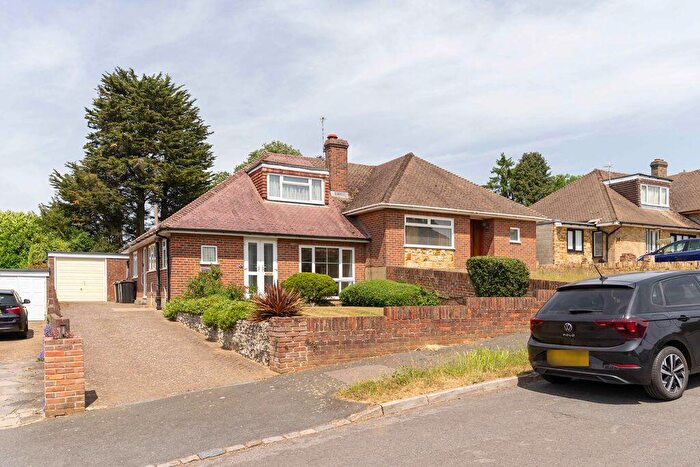

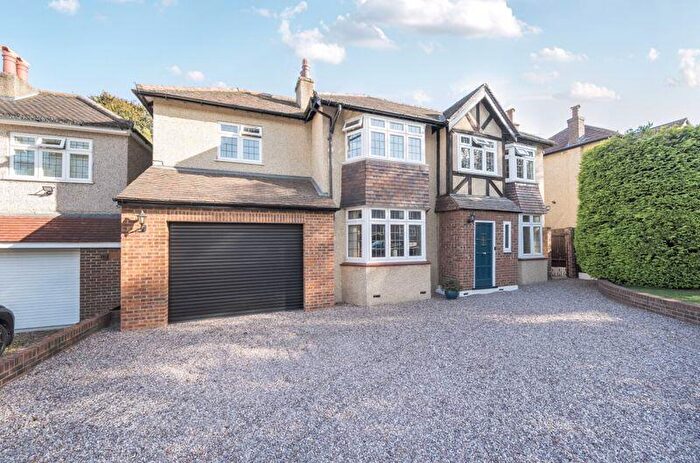
![]()
If you are looking to sell your house, let it out, or receive a property valuation, an expert can help you.
Click the button below to get started.

Neighbourhoods in Coulsdon
Navigate through our locations to find the location of your next house in Coulsdon, Croydon London Borough for sale or to rent.
Transport in Coulsdon
Please see below transportation links in this area:
-
 Coulsdon South Station
 -
Coulsdon Town Station
-
Woodmansterne Station
-
Reedham Station
-
Chipstead Station
-
Kenley Station
-
Purley Station
-
Riddlesdown Station
-
Whyteleafe Station
-
Upper Warlingham Station
- FAQ
- Price Paid By Year
- Property Type Price
Frequently asked questions about Coulsdon
What is the average price for a property for sale in Coulsdon?
The average price for a property for sale in Coulsdon is £548,381. This amount is 25% higher than the average price in Croydon London Borough. There are 8,337 property listings for sale in Coulsdon.
What locations have the most expensive properties for sale in Coulsdon?
The locations with the most expensive properties for sale in Coulsdon are Coulsdon East at an average of £558,485, Coulsdon West at an average of £544,151 and Coulsdon Town at an average of £521,930.
What locations have the most affordable properties for sale in Coulsdon?
The locations with the most affordable properties for sale in Coulsdon are Kenley at an average of £365,333 and Old Coulsdon at an average of £437,000.
Which train stations are available in or near Coulsdon?
Some of the train stations available in or near Coulsdon are Coulsdon South, Coulsdon Town and Woodmansterne.
Property Price Paid in Coulsdon by Year
The average sold property price by year was:
| Year | Average Sold Price | Price Change |
Sold Properties
|
|---|---|---|---|
| 2026 | £581,363 | 8% |
26 Properties |
| 2025 | £533,063 | -4% |
270 Properties |
| 2024 | £553,532 | -0,1% |
329 Properties |
| 2023 | £554,098 | -1% |
277 Properties |
| 2022 | £558,377 | 10% |
369 Properties |
| 2021 | £504,236 | 2% |
558 Properties |
| 2020 | £496,650 | -4% |
432 Properties |
| 2019 | £514,062 | 4% |
503 Properties |
| 2018 | £494,821 | 2% |
484 Properties |
| 2017 | £483,481 | 4% |
413 Properties |
| 2016 | £464,340 | 10% |
374 Properties |
| 2015 | £417,074 | 14% |
410 Properties |
| 2014 | £357,825 | 6% |
354 Properties |
| 2013 | £336,063 | 3% |
273 Properties |
| 2012 | £327,317 | 6% |
268 Properties |
| 2011 | £308,147 | -1% |
258 Properties |
| 2010 | £312,699 | 10% |
259 Properties |
| 2009 | £282,572 | -9% |
197 Properties |
| 2008 | £308,180 | -6% |
234 Properties |
| 2007 | £325,234 | 13% |
434 Properties |
| 2006 | £282,889 | 9% |
523 Properties |
| 2005 | £257,985 | -4% |
317 Properties |
| 2004 | £268,934 | 9% |
409 Properties |
| 2003 | £244,181 | 10% |
361 Properties |
| 2002 | £220,440 | 13% |
489 Properties |
| 2001 | £191,549 | 8% |
446 Properties |
| 2000 | £175,845 | 16% |
296 Properties |
| 1999 | £148,332 | 10% |
444 Properties |
| 1998 | £132,808 | 16% |
355 Properties |
| 1997 | £111,785 | 8% |
461 Properties |
| 1996 | £102,858 | 6% |
388 Properties |
| 1995 | £96,296 | - |
303 Properties |
Property Price per Property Type in Coulsdon
Here you can find historic sold price data in order to help with your property search.
The average Property Paid Price for specific property types in the last three years are:
| Property Type | Average Sold Price | Sold Properties |
|---|---|---|
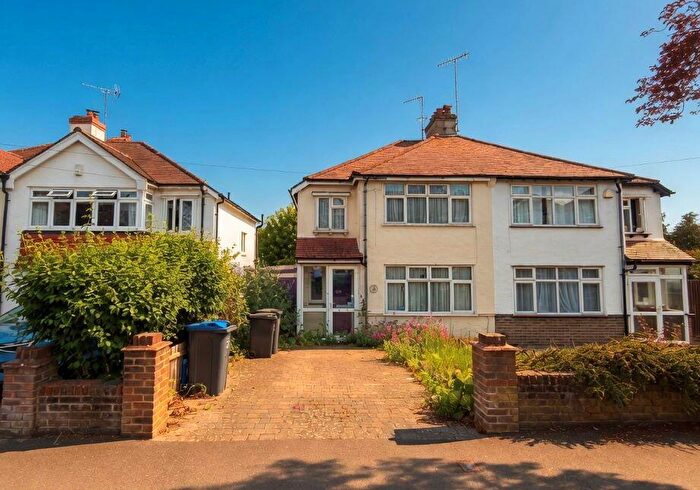
| Semi Detached House | £573,599.00 | 312 Semi Detached Houses |
| Detached House | £730,140.00 | 263 Detached Houses |
| Terraced House | £464,045.00 | 183 Terraced Houses |
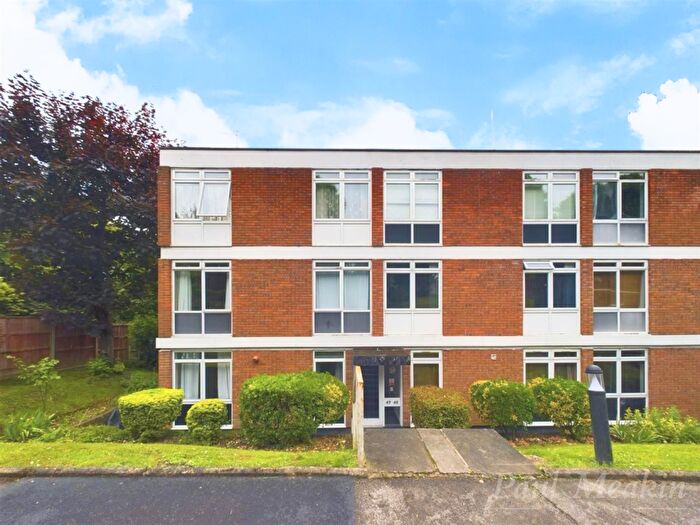
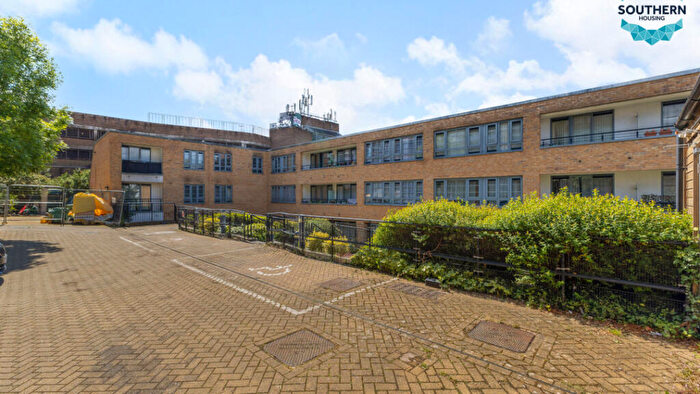
| Flat | £268,955.00 | 144 Flats |