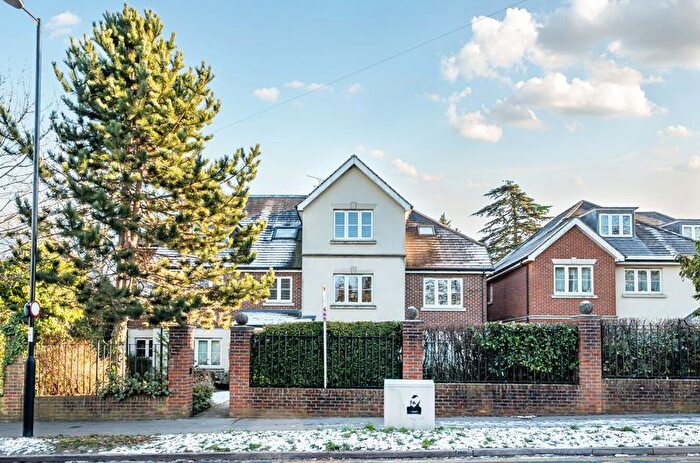
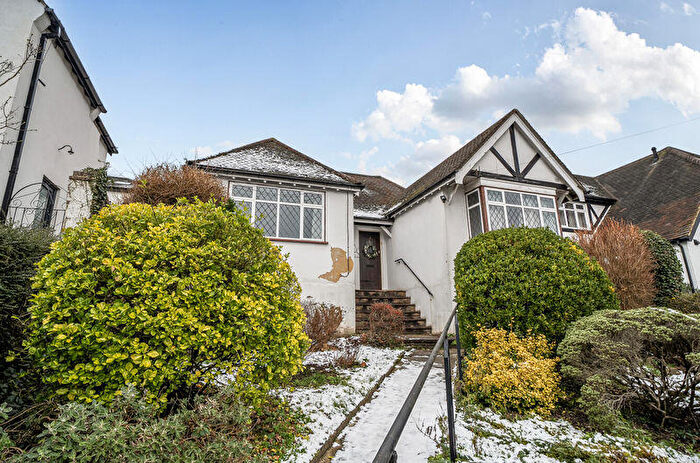
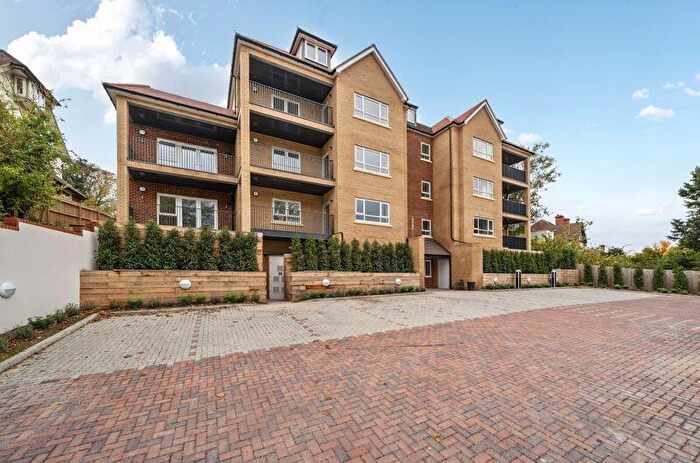
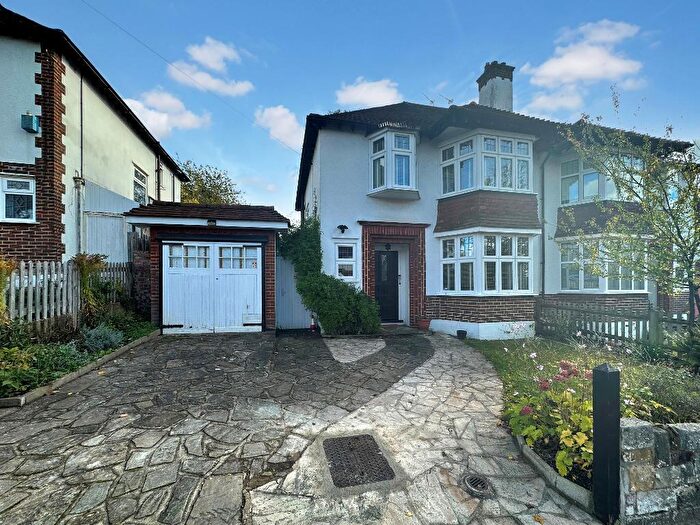
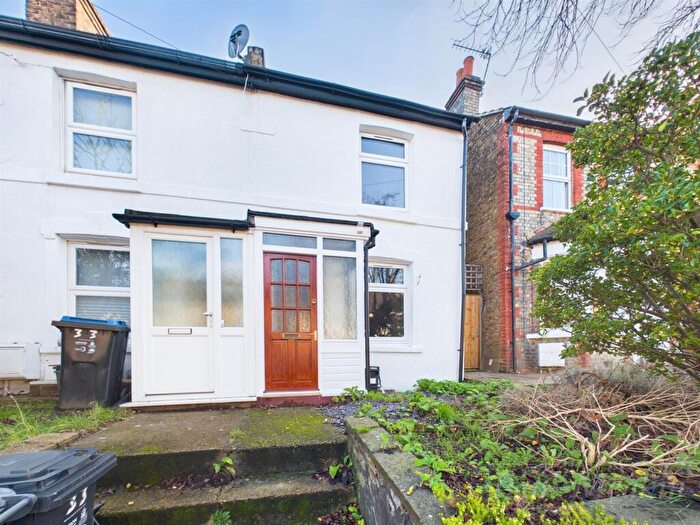
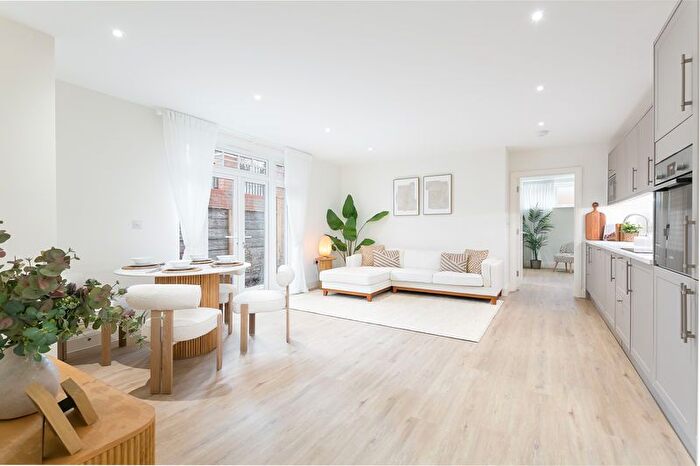
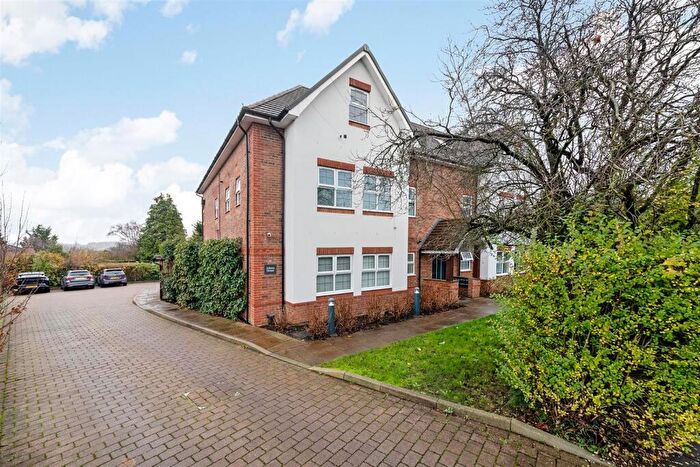
Houses for sale & to rent in Purley, South Croydon
House Prices in Purley
Properties in this part of Purley within South Croydon have an average house price of £485,312.00 and had 170 Property Transactions within the last 3 years¹. This area has 1,275 households² , where the most expensive property was sold for £1,515,000.00.
Properties for sale in Purley
Roads and Postcodes in Purley
Navigate through our locations to find the location of your next house in Purley, South Croydon for sale or to rent.
| Streets | Postcodes |
|---|---|
| Allenby Avenue | CR2 0RY |
| Barnards Place | CR2 6DZ |
| Biddulph Road | CR2 6QA CR2 6QB |
| Braemar Avenue | CR2 0QA CR2 0QB |
| Brantwood Road | CR2 0ND |
| Brighton Road | CR2 6AQ CR2 6AW CR2 6EU CR2 6EW |
| Coningsby Road | CR2 6QP |
| Copperfield Close | CR2 0RX |
| Derrick Avenue | CR2 0QL |
| Edgar Road | CR2 0NG CR2 0NJ |
| Florence Road | CR2 0PP CR2 0PQ |
| Gordon Avenue | CR2 0QN |
| Grange Road | CR2 0NA CR2 0NB CR2 0NE CR2 0NF |
| Haling Down Passage | CR2 6FA |
| Hillground Gardens | CR2 6FE |
| Kendall Avenue | CR2 0NH |
| Kendall Avenue South | CR2 0QQ CR2 0QR |
| Kingsdown Avenue | CR2 6QH CR2 6QL CR2 6QN CR2 6QR CR2 6QS |
| Lynscott Way | CR2 6BU CR2 6BW |
| Mount Park Avenue | CR2 6DJ CR2 6DW |
| Norman Avenue | CR2 0QE CR2 0QF CR2 0QH |
| Pampisford Road | CR2 6DA CR2 6DH |
| Parrs Close | CR2 0QX |
| Penwortham Road | CR2 0QS CR2 0QU |
| Purley Downs Road | CR2 0RA CR2 0RB CR2 0RD CR2 0RG CR2 0RJ |
| Purley Oaks Road | CR2 0NP CR2 0NQ CR2 0NU CR2 0NW CR2 0NX |
| Sanderstead Road | CR2 0LY CR2 0PB |
| Station Approach | CR2 0QD |
| Victoria Avenue | CR2 0QP |
Transport near Purley
-
Purley Oaks Station
-
Sanderstead Station
-
Purley Station
-
Riddlesdown Station
-
South Croydon Station
-
Reedham Station
-
Kenley Station
-
Lloyd Park Station
-
Waddon Station
-
Church Street Station
- FAQ
- Price Paid By Year
- Property Type Price
Frequently asked questions about Purley
What is the average price for a property for sale in Purley?
The average price for a property for sale in Purley is £485,312. This amount is 0.88% higher than the average price in South Croydon. There are 2,278 property listings for sale in Purley.
What streets have the most expensive properties for sale in Purley?
The streets with the most expensive properties for sale in Purley are Purley Downs Road at an average of £935,345, Kendall Avenue South at an average of £703,666 and Mount Park Avenue at an average of £668,222.
What streets have the most affordable properties for sale in Purley?
The streets with the most affordable properties for sale in Purley are Brighton Road at an average of £248,366, Parrs Close at an average of £278,892 and Biddulph Road at an average of £285,900.
Which train stations are available in or near Purley?
Some of the train stations available in or near Purley are Purley Oaks, Sanderstead and Purley.
Property Price Paid in Purley by Year
The average sold property price by year was:
| Year | Average Sold Price | Price Change |
Sold Properties
|
|---|---|---|---|
| 2025 | £511,586 | 11% |
31 Properties |
| 2024 | £454,937 | -11% |
40 Properties |
| 2023 | £506,373 | 6% |
41 Properties |
| 2022 | £477,329 | -3% |
58 Properties |
| 2021 | £493,024 | 5% |
60 Properties |
| 2020 | £469,474 | 8% |
41 Properties |
| 2019 | £430,215 | -0,3% |
44 Properties |
| 2018 | £431,548 | 1% |
47 Properties |
| 2017 | £428,586 | 9% |
42 Properties |
| 2016 | £390,721 | -1% |
47 Properties |
| 2015 | £394,336 | 20% |
54 Properties |
| 2014 | £317,286 | 5% |
61 Properties |
| 2013 | £300,519 | 9% |
34 Properties |
| 2012 | £274,583 | 2% |
36 Properties |
| 2011 | £267,919 | -1% |
36 Properties |
| 2010 | £271,912 | 6% |
41 Properties |
| 2009 | £255,107 | -12% |
35 Properties |
| 2008 | £286,601 | 14% |
32 Properties |
| 2007 | £247,442 | -10% |
81 Properties |
| 2006 | £272,199 | 15% |
72 Properties |
| 2005 | £231,535 | -2% |
66 Properties |
| 2004 | £235,267 | 8% |
72 Properties |
| 2003 | £216,066 | 8% |
75 Properties |
| 2002 | £198,633 | 21% |
71 Properties |
| 2001 | £157,279 | 6% |
71 Properties |
| 2000 | £147,159 | 17% |
65 Properties |
| 1999 | £121,784 | 14% |
87 Properties |
| 1998 | £104,918 | 13% |
75 Properties |
| 1997 | £90,934 | - |
70 Properties |
| 1996 | £90,915 | 11% |
62 Properties |
| 1995 | £81,234 | - |
44 Properties |
Property Price per Property Type in Purley
Here you can find historic sold price data in order to help with your property search.
The average Property Paid Price for specific property types in the last three years are:
| Property Type | Average Sold Price | Sold Properties |
|---|---|---|
| Semi Detached House | £623,486.00 | 36 Semi Detached Houses |
| Detached House | £796,191.00 | 27 Detached Houses |
| Terraced House | £494,350.00 | 36 Terraced Houses |
| Flat | £292,448.00 | 71 Flats |

