
Houses for sale in EX13 7DY, Newbridges, Axminster
House Prices in EX13 7DY, Newbridges
Properties in EX13 7DY have an average house price of £568k and had 2 Property Transactions within the last 3 years.¹ EX13 7DY is a postcode in Newbridges, an area in Axminster, Devon, with 15 households², where the most expensive property was sold for £575k.
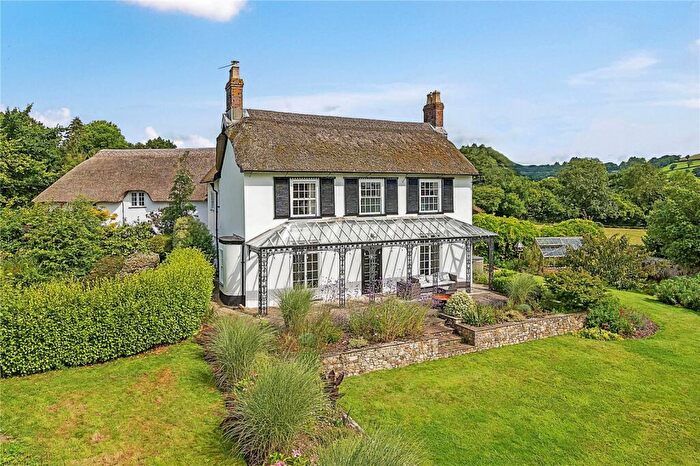
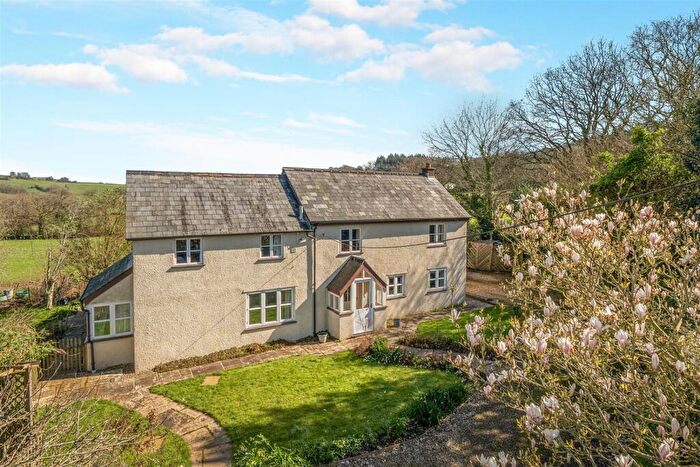
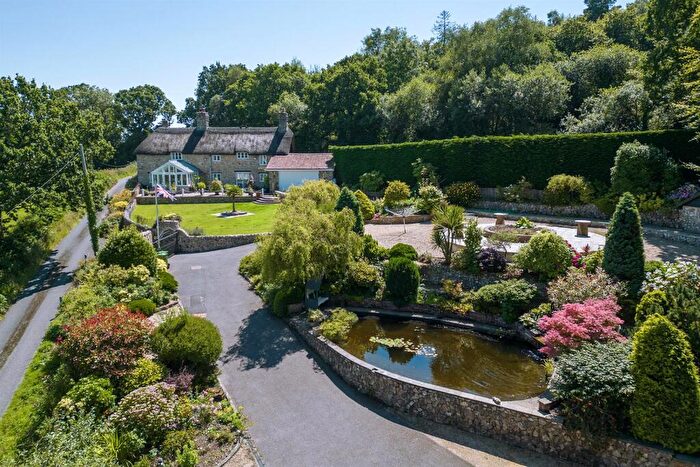
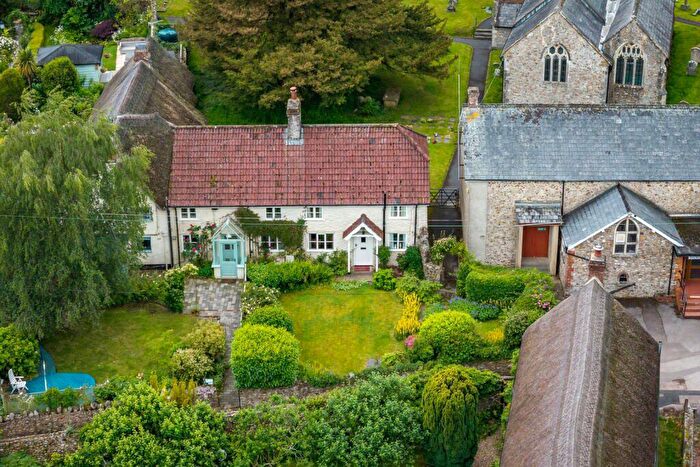
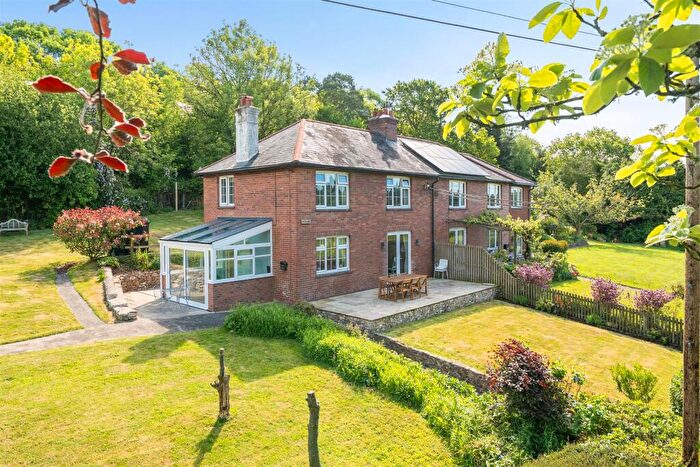
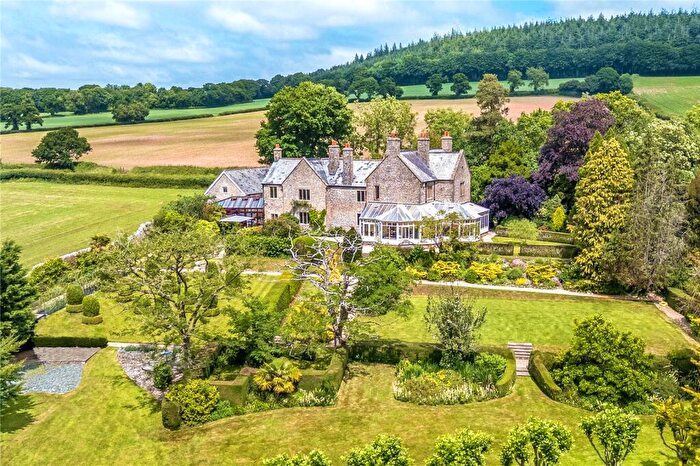
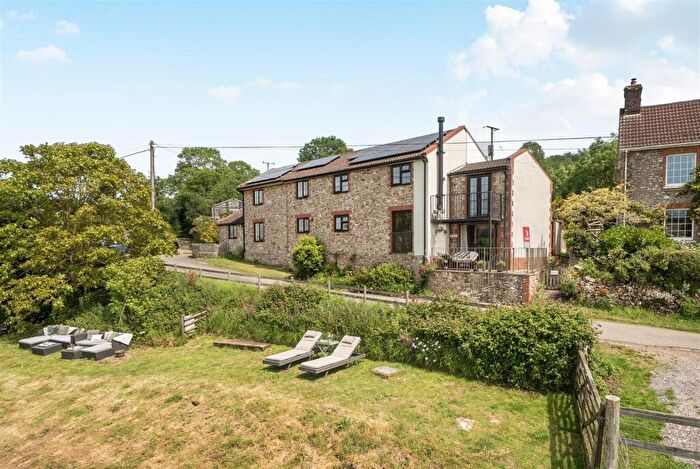
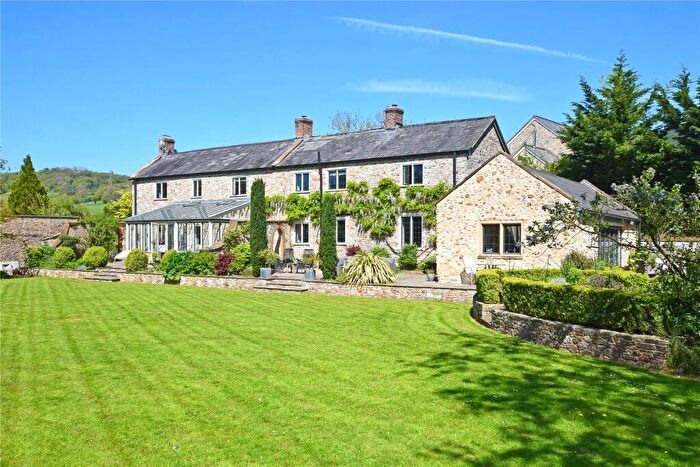
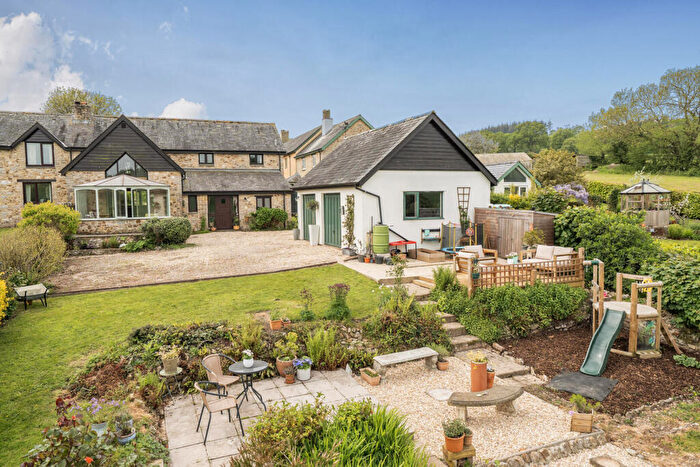
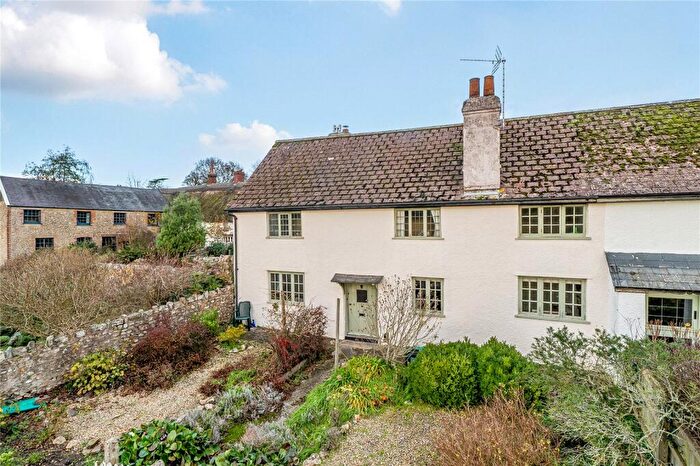
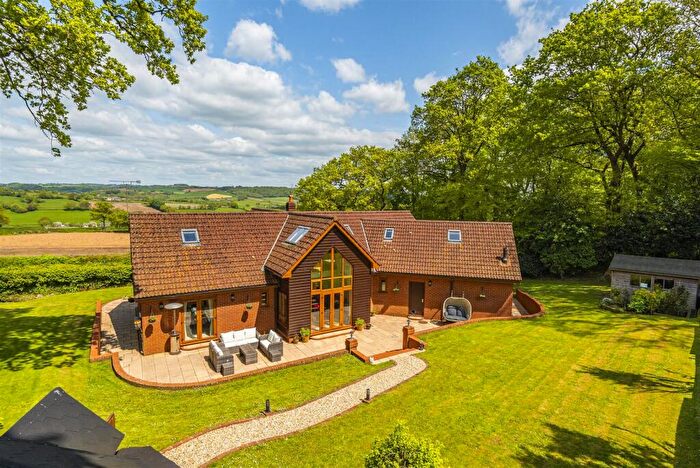
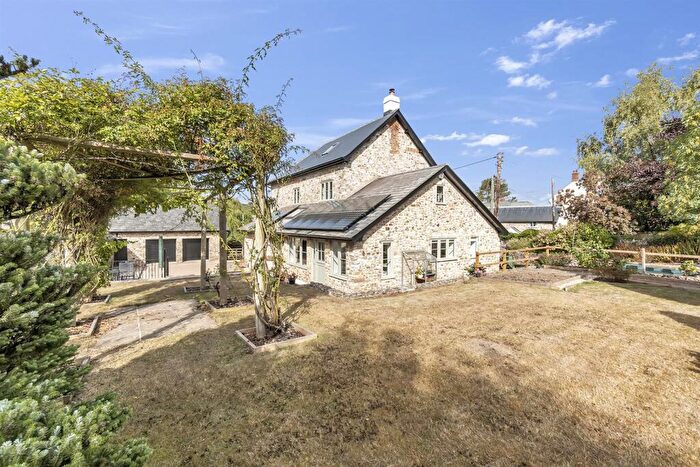
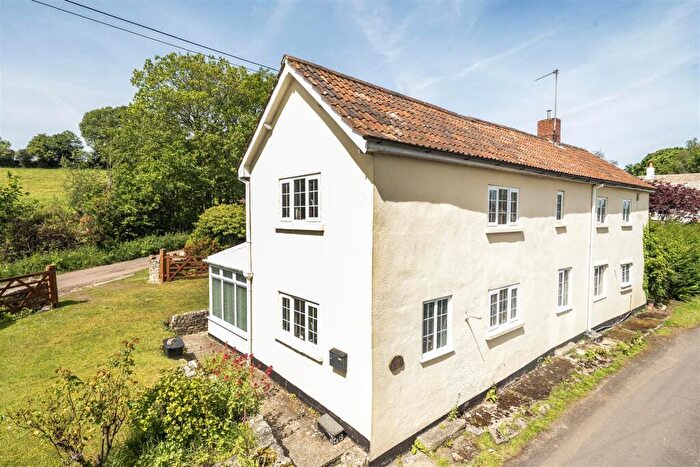
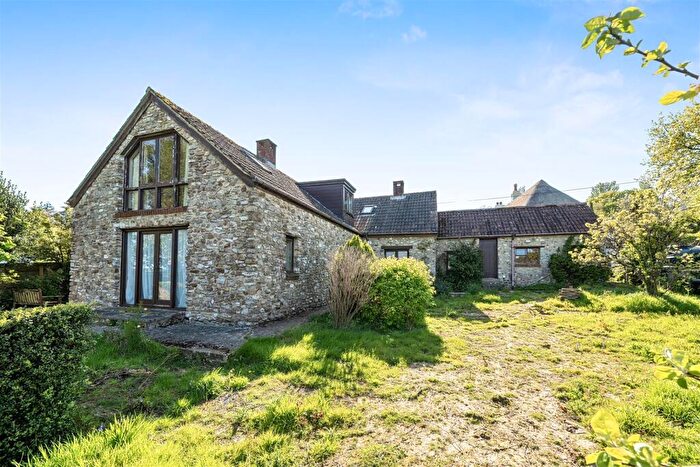
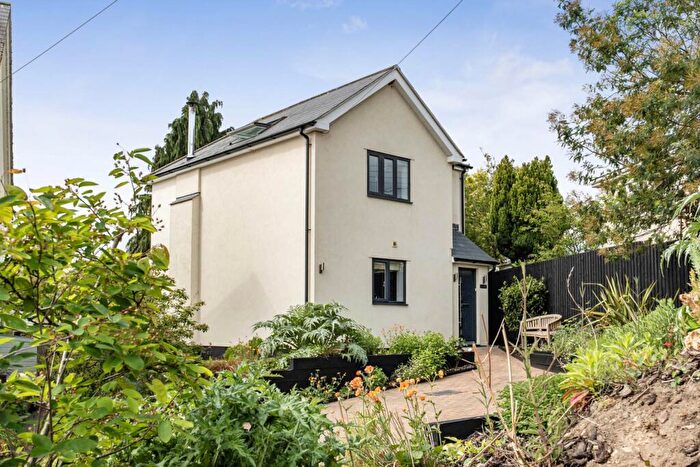
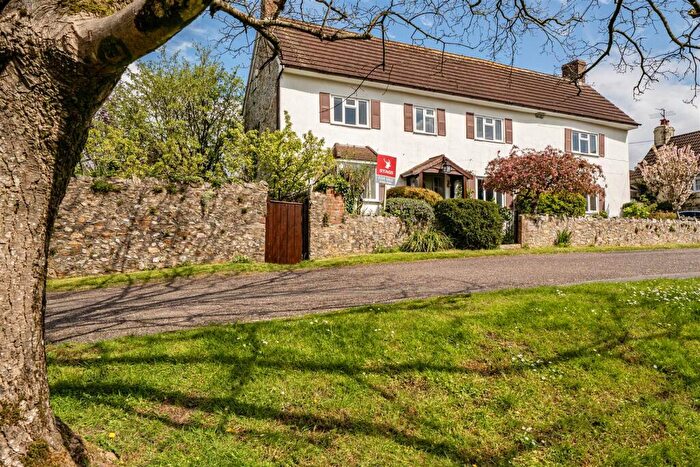
Properties for sale near EX13 7DY

![]()
If you are looking to sell your house, let it out, or receive a property valuation, an expert can help you.
Click the button below to get started.

Price Paid in EX13 7DY, Newbridges
DICKENS MARSH COTTAGE EX13 7DY, Newbridges Axminster
Property DICKENS MARSH COTTAGE has been sold 4 times. The last time it was sold was in 14/02/2025 and the sold price was £575,000.00.
This detached house, sold as a freehold on 14/02/2025, is a 154 sqm detached house with an EPC rating of E.
| Date | Price | Property Type | Tenure | Classification |
|---|---|---|---|---|
| 14/02/2025 | £575,000.00 | Detached House | freehold | Established Building |
| 05/09/2023 | £560,000.00 | Detached House | freehold | Established Building |
| 10/07/2009 | £388,000.00 | Detached House | freehold | Established Building |
| 31/08/2001 | £166,000.00 | Detached House | freehold | Established Building |
THE SOAP HOUSE EX13 7DY, Newbridges Axminster
Property THE SOAP HOUSE has been sold 2 times. The last time it was sold was in 30/09/2004 and the sold price was £475,000.00.
This detached house, sold as a freehold on 30/09/2004, is a 206 sqm detached house with an EPC rating of E.
| Date | Price | Property Type | Tenure | Classification |
|---|---|---|---|---|
| 30/09/2004 | £475,000.00 | Detached House | freehold | Established Building |
| 14/05/1998 | £185,000.00 | Detached House | freehold | Established Building |
Property price trends in EX13 7DY
According to the latest Land Registry data, the average home in EX13 7DY sold for £575,000 in 2025. That figure comes from 6 sales logged over the past 27 years.
Prices have moved up over the last three years. Compared with 2023, when the typical sale came in around £560,000, that's a rise of roughly 2.7%.
Property Price Paid in EX13 7DY by Year
The average sold property price by year was:
| Year | Average Sold Price | Price Change |
Sold Properties
|
|---|---|---|---|
| 2025 | £575,000 | 3% |
1 Property |
| 2023 | £560,000 | 31% |
1 Property |
| 2009 | £388,000 | -22% |
1 Property |
| 2004 | £475,000 | 65% |
1 Property |
| 2001 | £166,000 | -11% |
1 Property |
| 1998 | £185,000 | - |
1 Property |
Property Price per Property Type in EX13 7DY
Here you can find historic sold price data in order to help with your property search.
The average Property Paid Price for specific property types in the last three years are:
| Property Type | Average Sold Price | Sold Properties |
|---|---|---|
| Detached House | £567,500.00 | 2 Detached Houses |
