
Houses for sale in Chittlehampton, Barnstaple
House Prices in Chittlehampton
Properties in Chittlehampton have an average house price of £338k and had 2 Property Transactions within the last 3 years¹.
Chittlehampton is an area in Barnstaple, Devon with 105 households², where the most expensive property was sold for £380k.
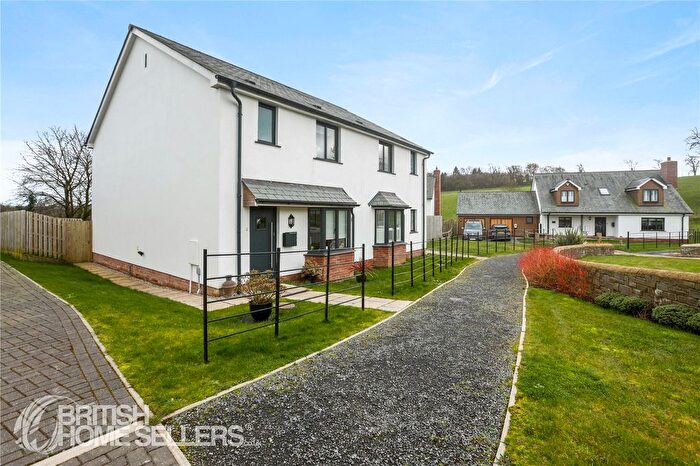
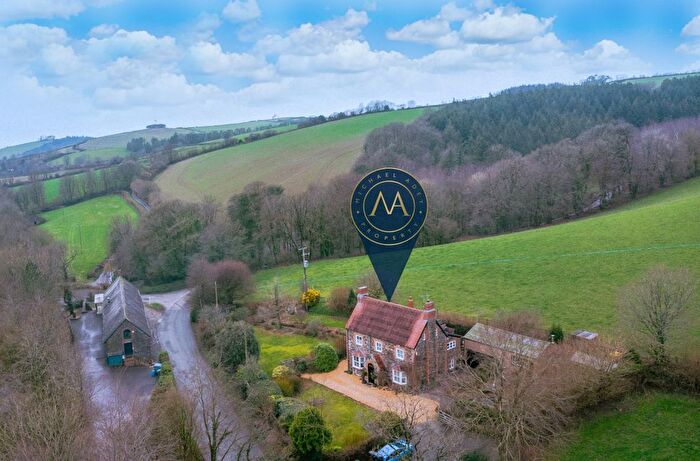
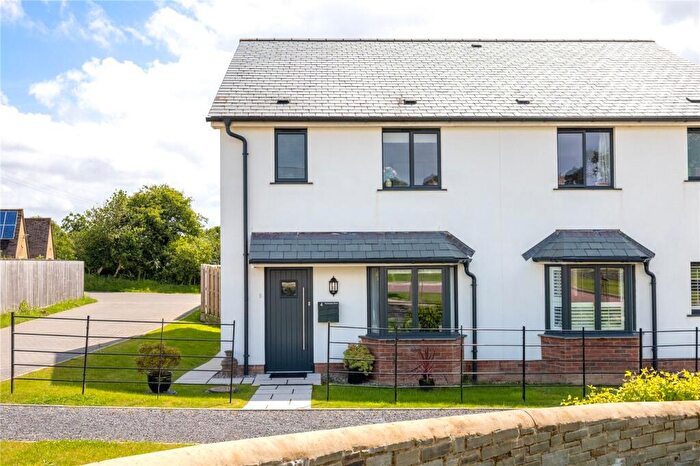
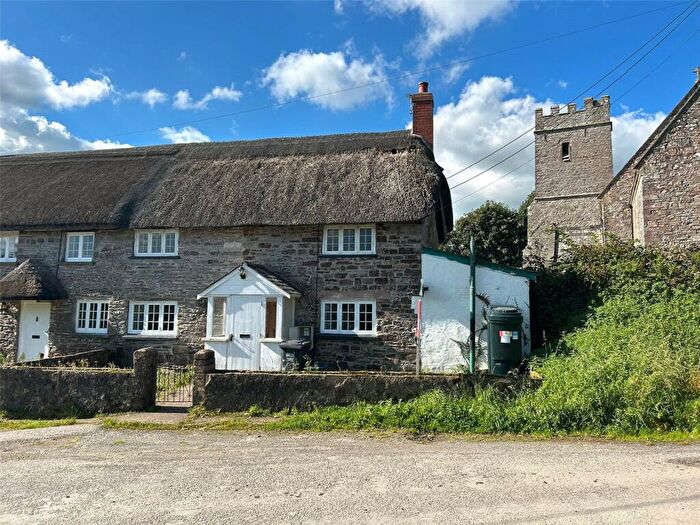
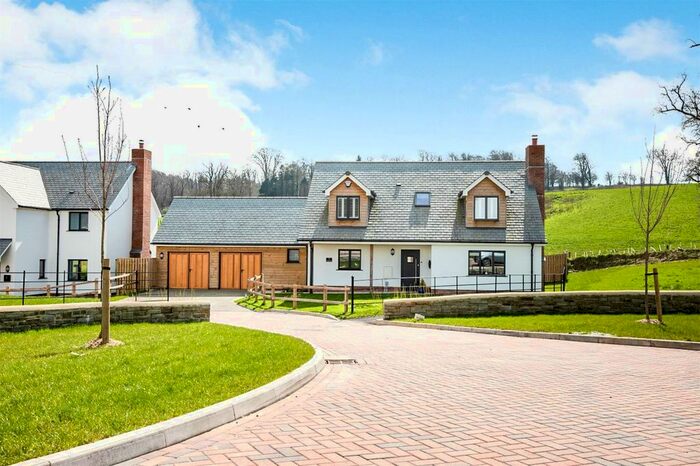
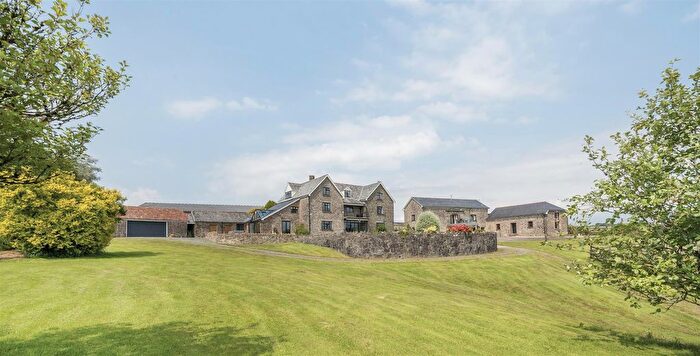
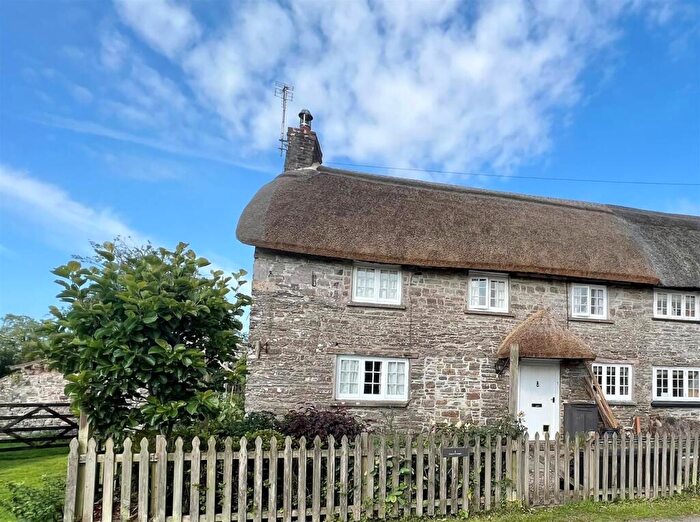
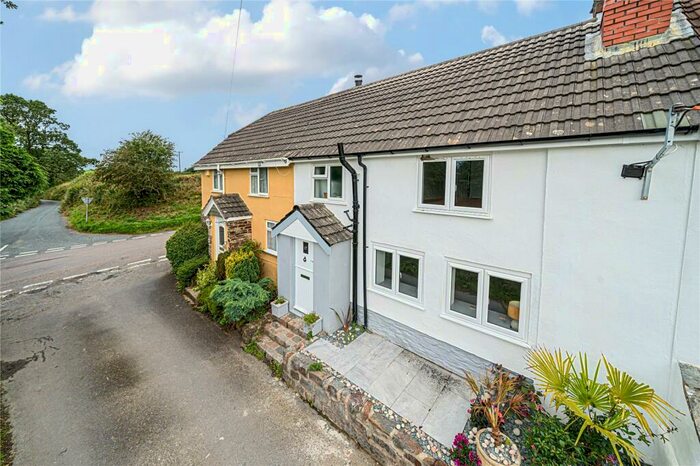
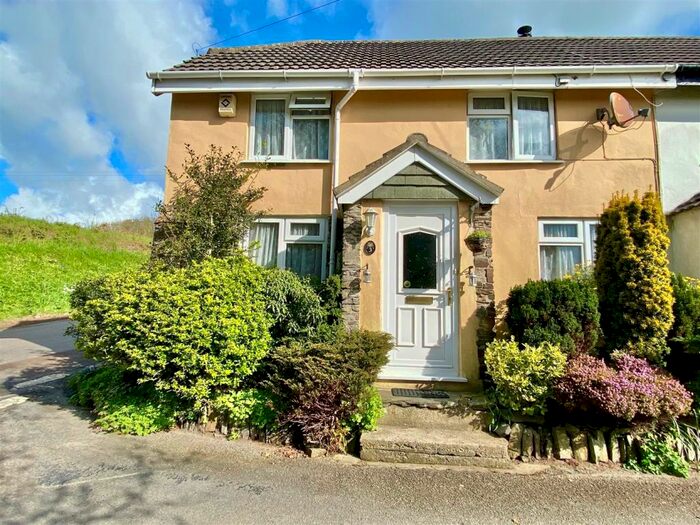
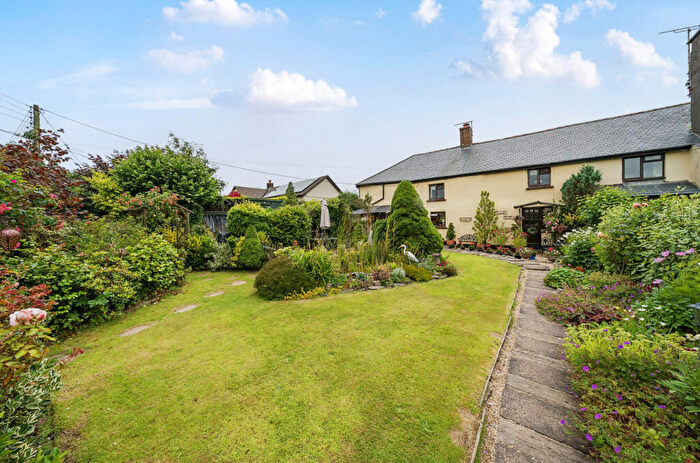
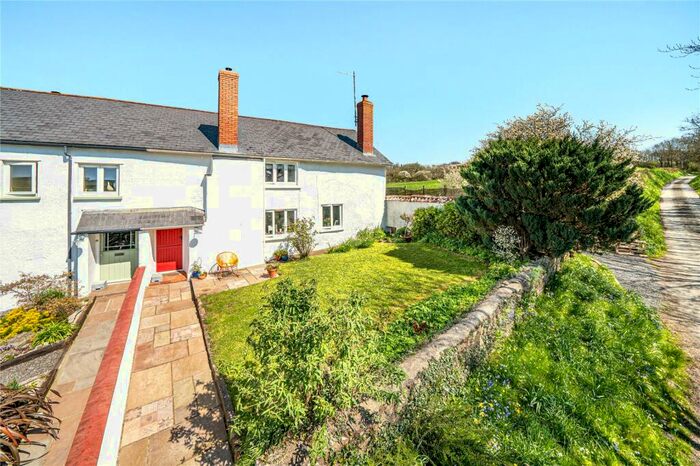
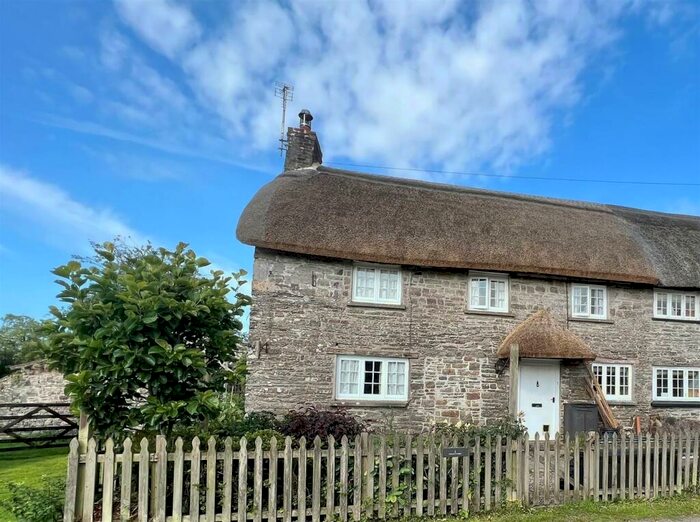
Properties for sale in Chittlehampton
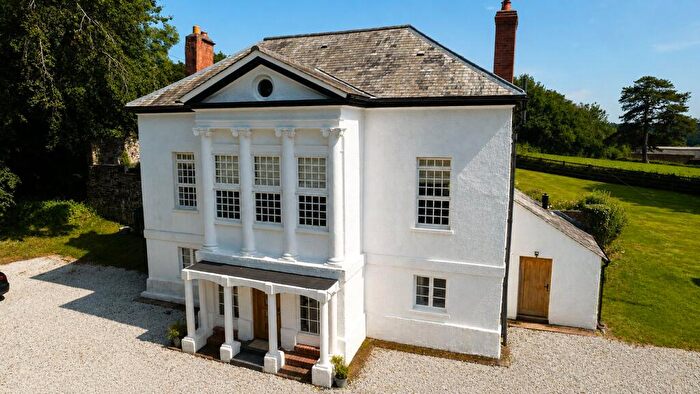
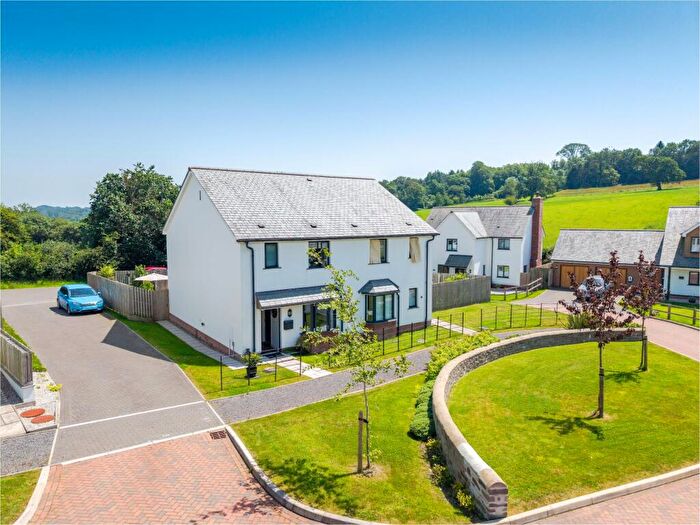
Previously listed properties in Chittlehampton

![]()
If you are looking to sell your house, let it out, or receive a property valuation, an expert can help you.
Click the button below to get started.


Roads and Postcodes in Chittlehampton
Navigate through our locations to find the location of your next house in Chittlehampton, Barnstaple for sale or to rent.
| Streets | Postcodes |
|---|---|
| Barton Close | EX32 0RT |
| Castle Hill | EX32 0RH |
| Fortescue Drive | EX32 0FH |
| Park Lane | EX32 0RF |
| Rectory Close | EX32 0SD |
| EX32 0RE EX32 0RG EX32 0RJ EX32 0RL EX32 0RN EX32 0RP EX32 0RQ EX32 0RR EX32 0RS EX32 0RU EX32 0RW EX32 0RX EX32 0RY EX32 0RZ EX32 0SZ EX32 0TH EX32 0TJ EX32 0TQ |
Property price trends in Chittlehampton
According to the latest Land Registry data, the average home in Chittlehampton sold for £380,000 in 2025. That figure comes from 44 sales logged over the past 29 years.
Prices have fallen back over the last three years. Compared with 2022, when the typical sale came in around £408,900, that's a fall of roughly 7.1%.
Looking back five years, average prices are up about 16% since 2020, a gain of around £52,500 in cash terms.
Zoom out to the past decade for the fuller picture. Back in 2014, homes here averaged £163,500, so the typical sold price has climbed about 132.4% since then, roughly 8% a year. Stretch the view to fifteen years and that annual pace eases back to about 0.5%.
Frequently asked questions about Chittlehampton
What is the average price for a property for sale in Chittlehampton?
The average price for a property for sale in Chittlehampton is £337,500. This amount is 12% higher than the average price in Barnstaple. There are 17 property listings for sale in Chittlehampton.
Which train stations are available in or near Chittlehampton?
Some of the train stations available in or near Chittlehampton are Umberleigh, Chapelton and Portsmouth Arms.
Property Price Paid in Chittlehampton by Year
The average sold property price by year was:
| Year | Average Sold Price | Price Change |
Sold Properties
|
|---|---|---|---|
| 2025 | £380,000 | 22% |
1 Property |
| 2024 | £295,000 | -39% |
1 Property |
| 2022 | £408,900 | -60% |
4 Properties |
| 2021 | £653,700 | 50% |
2 Properties |
| 2020 | £327,500 | -7% |
2 Properties |
| 2019 | £350,000 | 24% |
3 Properties |
| 2018 | £267,000 | -46% |
2 Properties |
| 2017 | £388,625 | 22% |
4 Properties |
| 2016 | £305,000 | 46% |
1 Property |
| 2014 | £163,500 | -133% |
2 Properties |
Property Price per Property Type in Chittlehampton
Here you can find historic sold price data in order to help with your property search.
The average Property Paid Price for specific property types in the last three years are:
| Property Type | Average Sold Price | Sold Properties |
|---|---|---|
| Semi Detached House | £380,000.00 | 1 Semi Detached House |
| Terraced House | £295,000.00 | 1 Terraced House |
