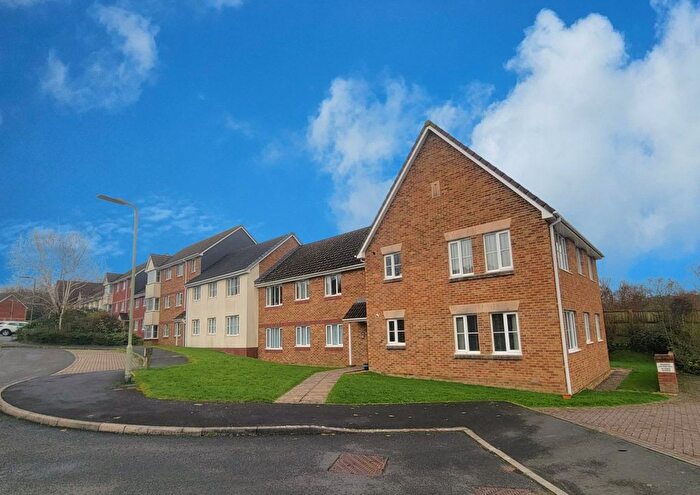
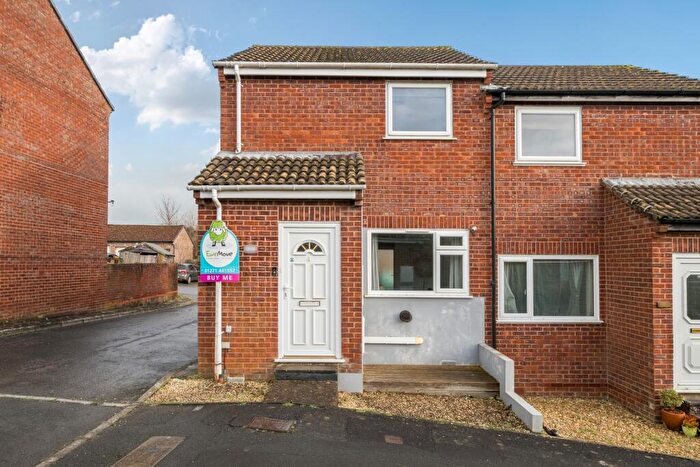
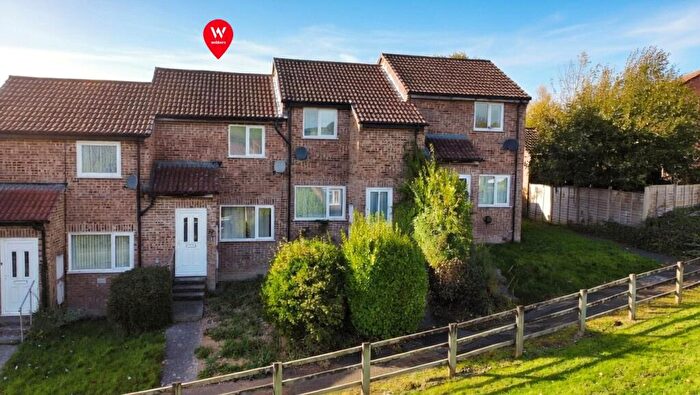
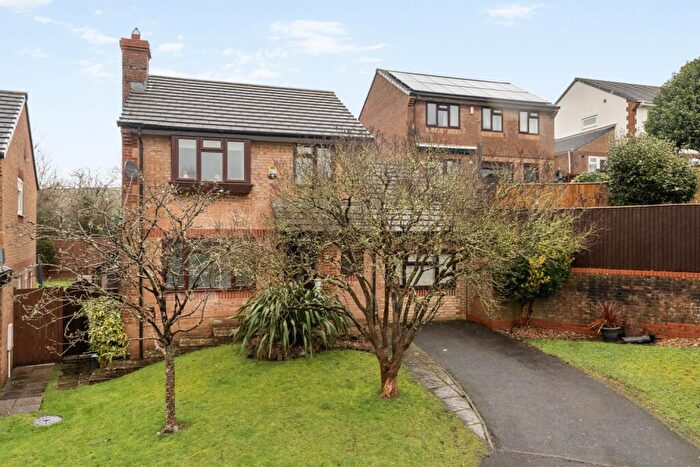
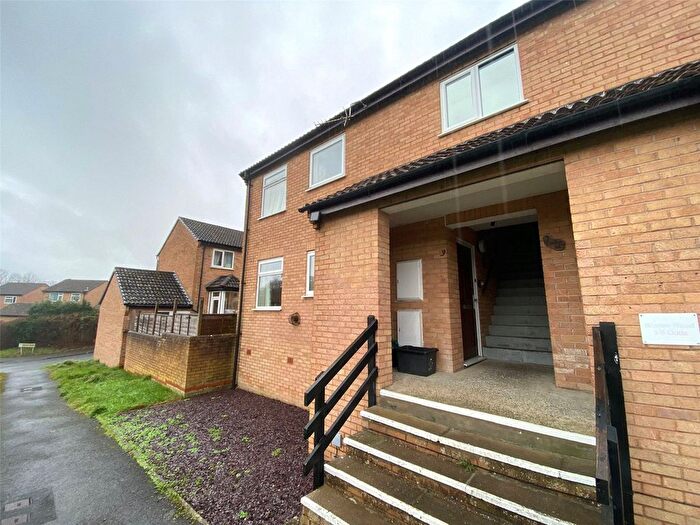
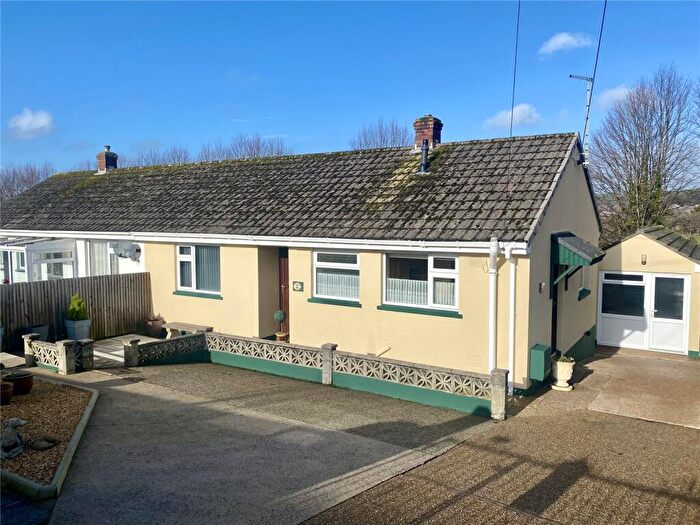
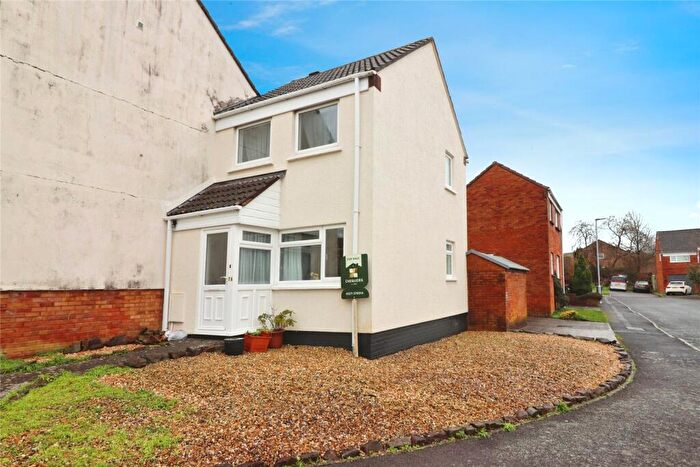
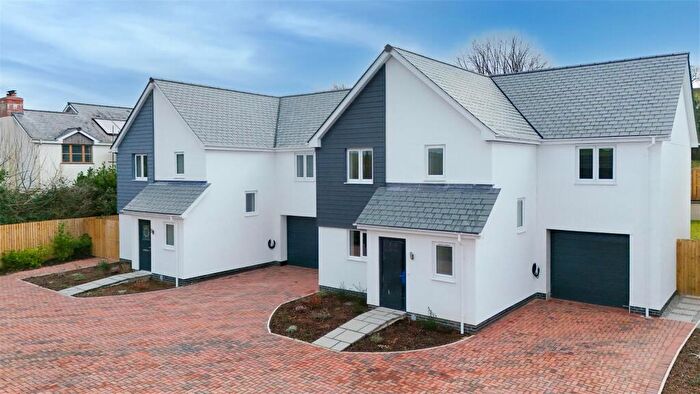
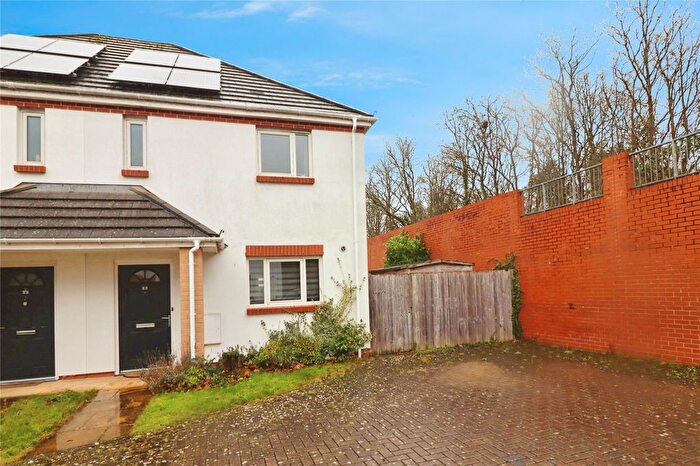
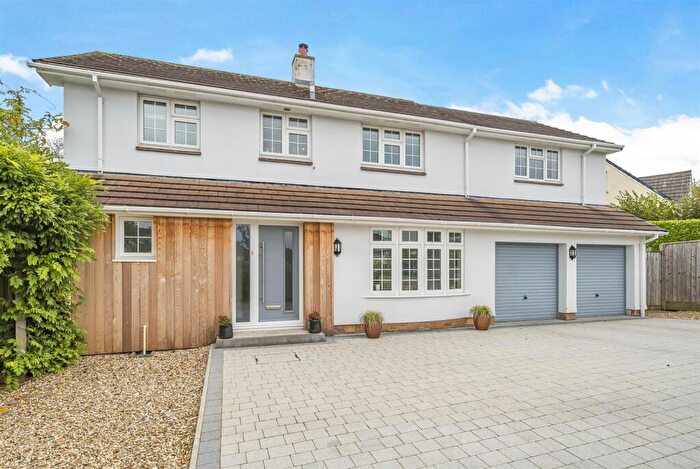
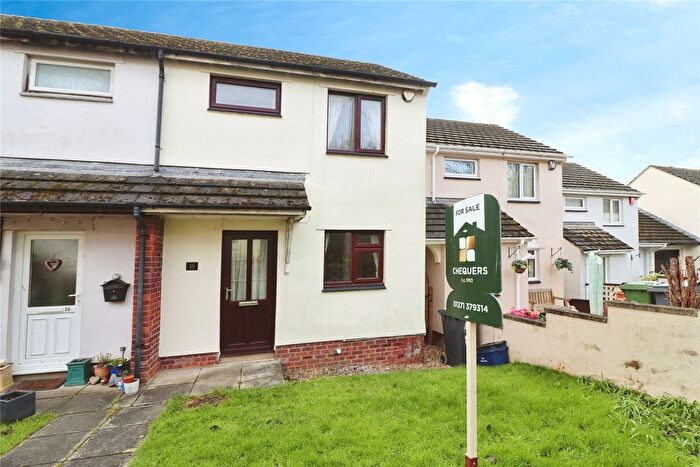
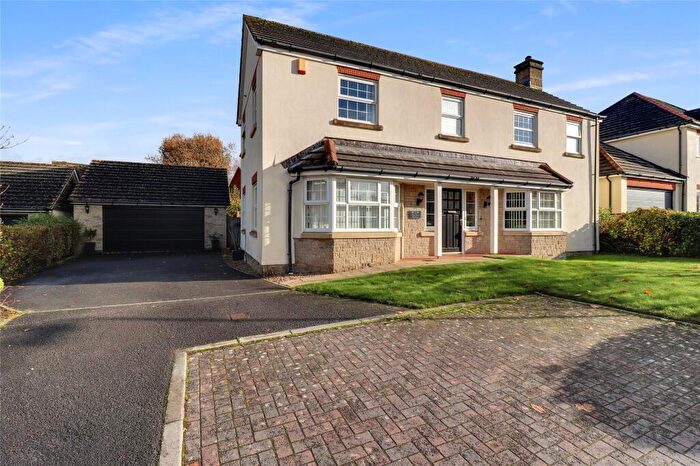
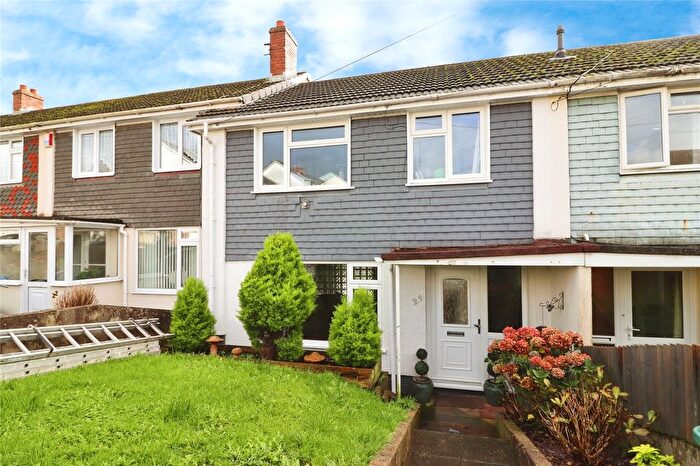
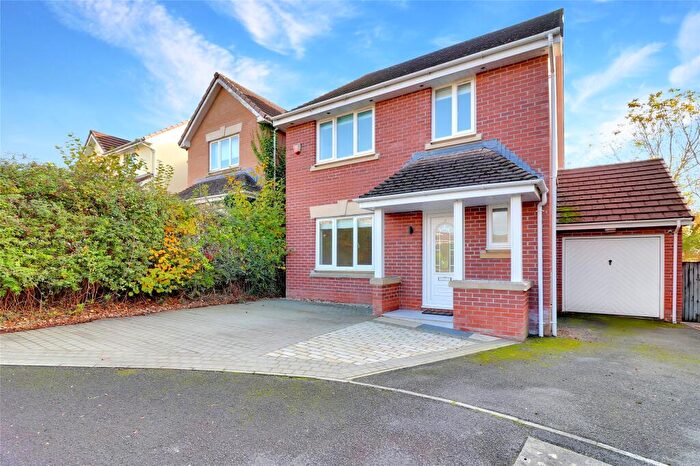
Houses for sale & to rent in Forches And Whiddon Valley, Barnstaple
House Prices in Forches And Whiddon Valley
Properties in Forches And Whiddon Valley have an average house price of £235,083.00 and had 150 Property Transactions within the last 3 years¹.
Forches And Whiddon Valley is an area in Barnstaple, Devon with 1,684 households², where the most expensive property was sold for £520,000.00.
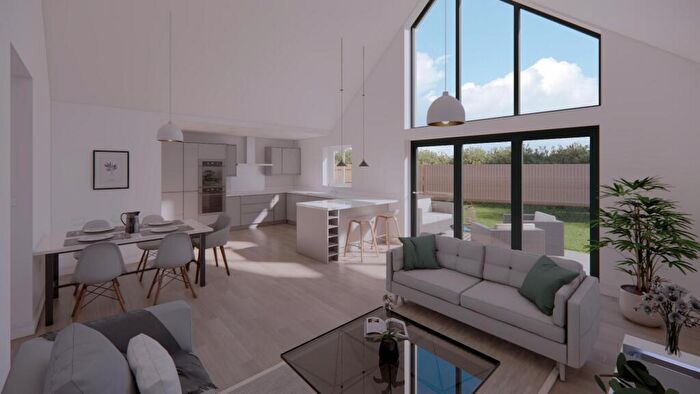
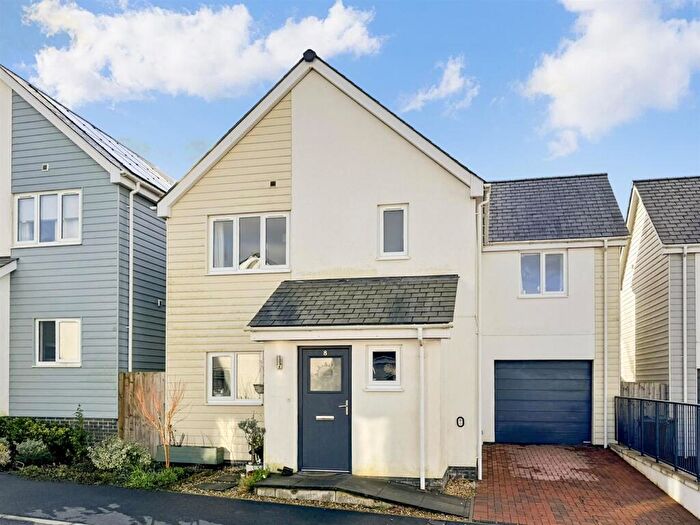
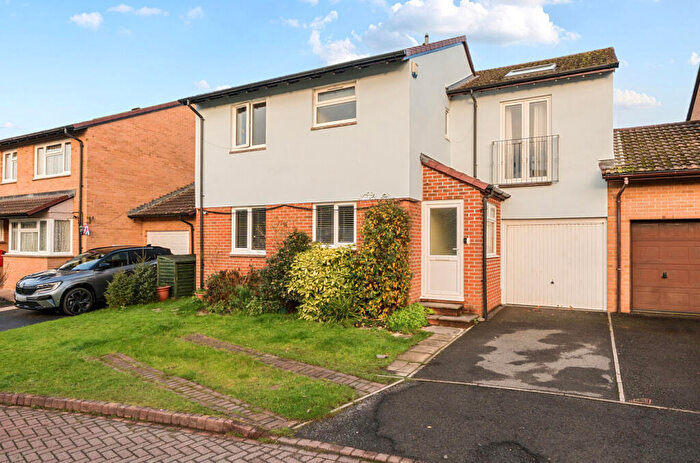
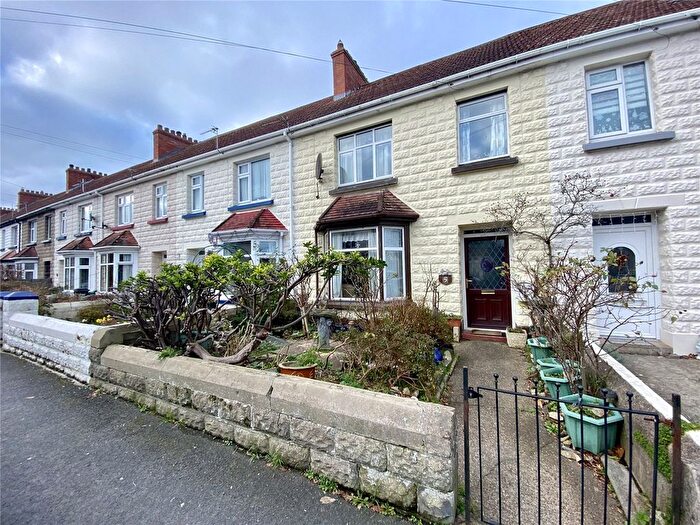
Properties for sale in Forches And Whiddon Valley
Roads and Postcodes in Forches And Whiddon Valley
Navigate through our locations to find the location of your next house in Forches And Whiddon Valley, Barnstaple for sale or to rent.
| Streets | Postcodes |
|---|---|
| Appletree Close | EX32 8PN |
| Barton Drive | EX32 7SH |
| Barton Road | EX32 8NG |
| Berry Road | EX32 8ES |
| Bingham Crescent | EX32 8BZ |
| Brewer Road | EX32 8EX |
| Campion Drive | EX32 8RB |
| Clover Way | EX32 8RD |
| East Park Road | EX32 8PL |
| Forches Avenue | EX32 8EF |
| Forches Gardens | EX32 8DZ |
| Foxglove Close | EX32 8RE |
| Gould Close | EX32 8HB |
| Gould Road | EX32 8EP EX32 8ER EX32 8ET EX32 8EY |
| Greenbank Road | EX32 8EG |
| Gribble Close | EX32 8EN |
| Hawley Manor | EX32 8AP |
| Hawthorn Road | EX32 8PU |
| Heron Court | EX32 8QR |
| John Gay Close | EX32 8DB |
| John Gay Road | EX32 8DA |
| Kestrel Way | EX32 8QN |
| Kingfisher Drive | EX32 8QW |
| Laburnum Drive | EX32 8PX |
| Lane End Park | EX32 8PP |
| Larkspur Gardens | EX32 8RA |
| Little Field Close | EX32 8NZ |
| Lower Moor | EX32 8NW |
| Magnolia Close | EX32 8QH |
| North Green | EX32 8EA |
| Oak Tree Drive | EX32 0HE |
| Orchard Place | EX32 8AS |
| Otter Way | EX32 8PS |
| Peards Down Close | EX32 8PF |
| Primrose Avenue | EX32 8RG |
| South Green | EX32 8EB |
| Sowden Lane | EX32 8DJ |
| Sowden Park | EX32 8EH EX32 8EJ |
| Speedwell Close | EX32 8PY |
| Springfield Mews | EX32 8DY |
| Stoat Park | EX32 8PT |
| Swallow Close | EX32 8QP |
| Treefield Walk | EX32 8PE |
| Venlock Close | EX32 8PD |
| Victoria Road | EX32 8DS |
| Walnut Way | EX32 7RF |
| Westacott Meadow | EX32 8QX |
| Willshere Road | EX32 8EL |
| Woodland Close | EX32 0EG |
| Woolbarn Lawn | EX32 8PQ |
Transport near Forches And Whiddon Valley
- FAQ
- Price Paid By Year
- Property Type Price
Frequently asked questions about Forches And Whiddon Valley
What is the average price for a property for sale in Forches And Whiddon Valley?
The average price for a property for sale in Forches And Whiddon Valley is £235,083. This amount is 22% lower than the average price in Barnstaple. There are 640 property listings for sale in Forches And Whiddon Valley.
What streets have the most expensive properties for sale in Forches And Whiddon Valley?
The streets with the most expensive properties for sale in Forches And Whiddon Valley are Kestrel Way at an average of £439,500, Swallow Close at an average of £438,333 and Kingfisher Drive at an average of £391,833.
What streets have the most affordable properties for sale in Forches And Whiddon Valley?
The streets with the most affordable properties for sale in Forches And Whiddon Valley are Peards Down Close at an average of £110,333, East Park Road at an average of £138,333 and Barton Road at an average of £141,450.
Which train stations are available in or near Forches And Whiddon Valley?
Some of the train stations available in or near Forches And Whiddon Valley are Barnstaple, Chapelton and Umberleigh.
Property Price Paid in Forches And Whiddon Valley by Year
The average sold property price by year was:
| Year | Average Sold Price | Price Change |
Sold Properties
|
|---|---|---|---|
| 2025 | £231,073 | -8% |
47 Properties |
| 2024 | £249,863 | 12% |
58 Properties |
| 2023 | £220,221 | -14% |
45 Properties |
| 2022 | £250,371 | 23% |
49 Properties |
| 2021 | £193,431 | -1% |
57 Properties |
| 2020 | £196,325 | -7% |
50 Properties |
| 2019 | £210,345 | 16% |
84 Properties |
| 2018 | £175,793 | -5% |
66 Properties |
| 2017 | £183,965 | 9% |
45 Properties |
| 2016 | £166,493 | -2% |
53 Properties |
| 2015 | £170,362 | 7% |
71 Properties |
| 2014 | £158,040 | -3% |
61 Properties |
| 2013 | £162,592 | 4% |
66 Properties |
| 2012 | £156,745 | -1% |
57 Properties |
| 2011 | £158,917 | 2% |
59 Properties |
| 2010 | £154,967 | 11% |
67 Properties |
| 2009 | £138,628 | -6% |
42 Properties |
| 2008 | £146,823 | -12% |
33 Properties |
| 2007 | £164,697 | 10% |
87 Properties |
| 2006 | £147,921 | 9% |
113 Properties |
| 2005 | £134,133 | -1% |
96 Properties |
| 2004 | £135,951 | 15% |
62 Properties |
| 2003 | £115,101 | 16% |
84 Properties |
| 2002 | £96,506 | 17% |
155 Properties |
| 2001 | £80,358 | 15% |
182 Properties |
| 2000 | £68,064 | 20% |
116 Properties |
| 1999 | £54,375 | 8% |
127 Properties |
| 1998 | £49,972 | 5% |
128 Properties |
| 1997 | £47,324 | 2% |
122 Properties |
| 1996 | £46,568 | 4% |
100 Properties |
| 1995 | £44,811 | - |
59 Properties |
Property Price per Property Type in Forches And Whiddon Valley
Here you can find historic sold price data in order to help with your property search.
The average Property Paid Price for specific property types in the last three years are:
| Property Type | Average Sold Price | Sold Properties |
|---|---|---|
| Semi Detached House | £236,994.00 | 43 Semi Detached Houses |
| Detached House | £348,710.00 | 38 Detached Houses |
| Terraced House | £187,455.00 | 51 Terraced Houses |
| Flat | £125,583.00 | 18 Flats |

