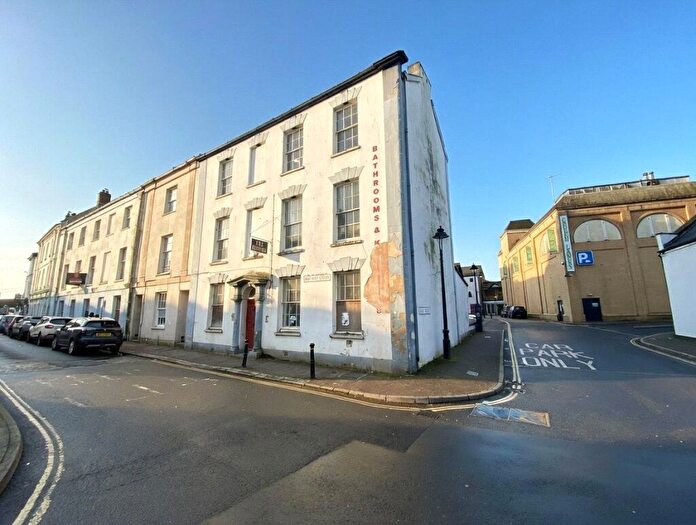
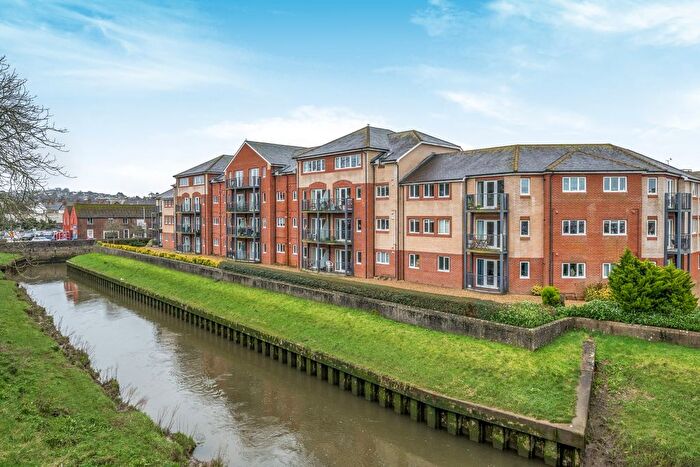
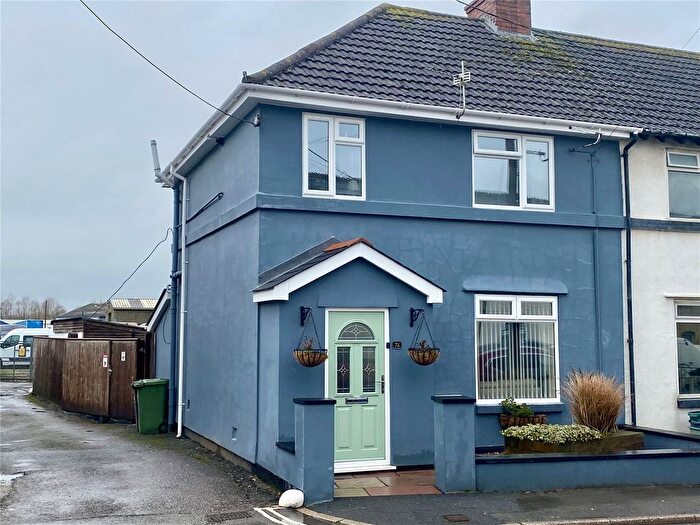
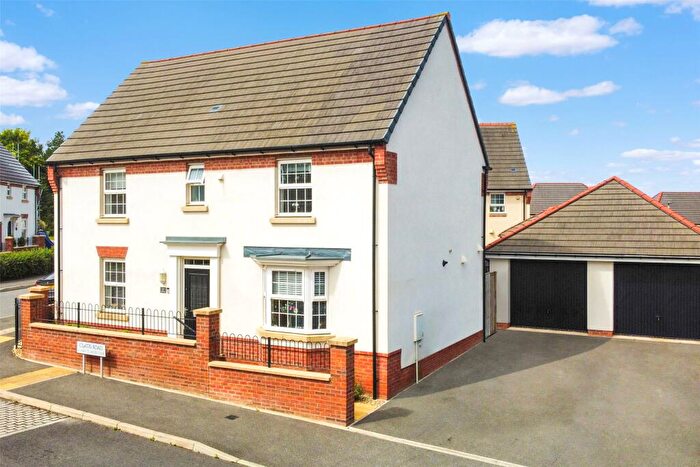
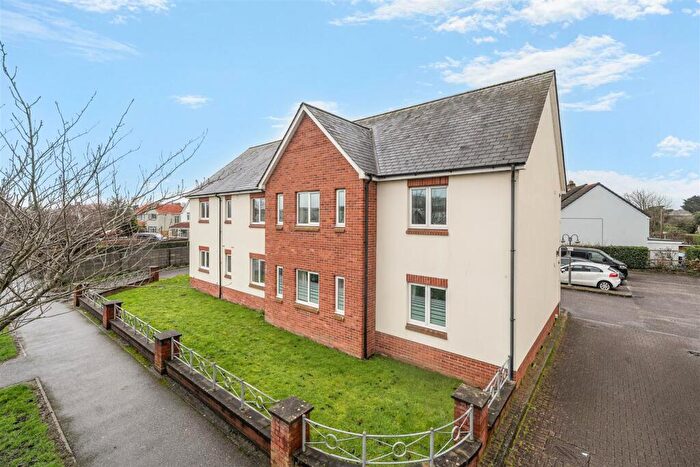
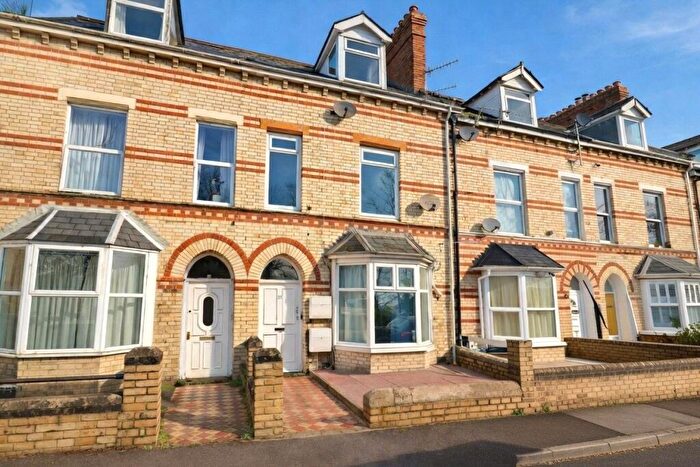
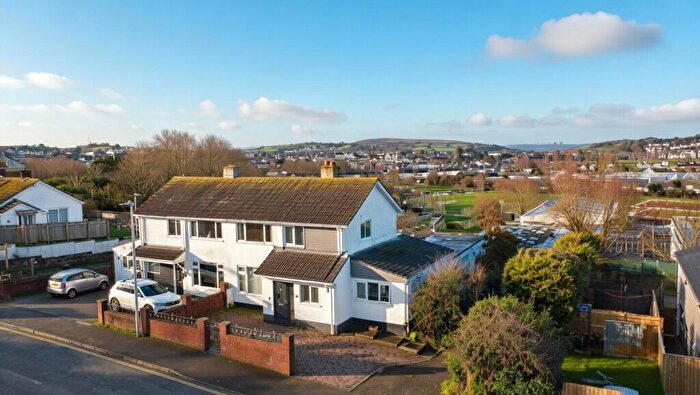
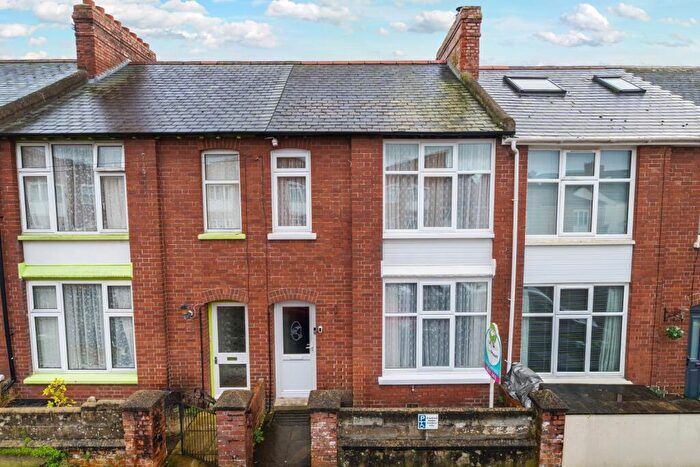
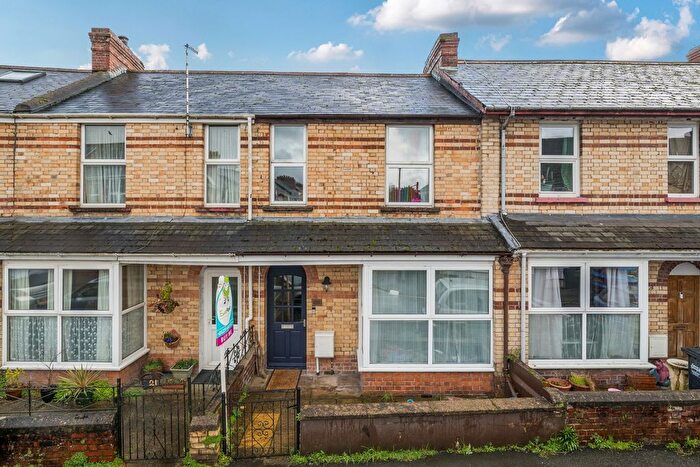
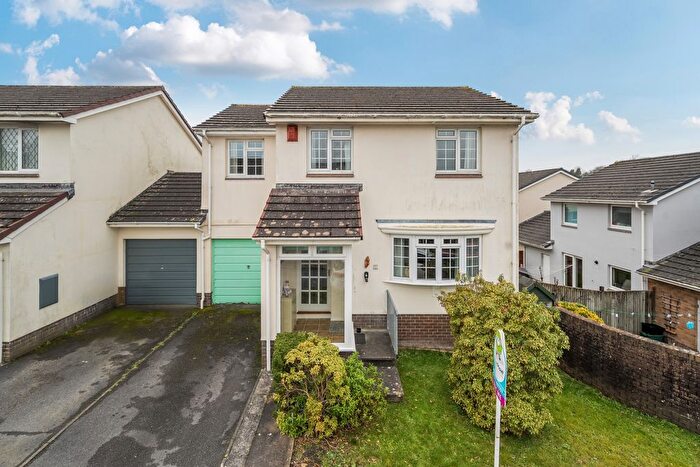
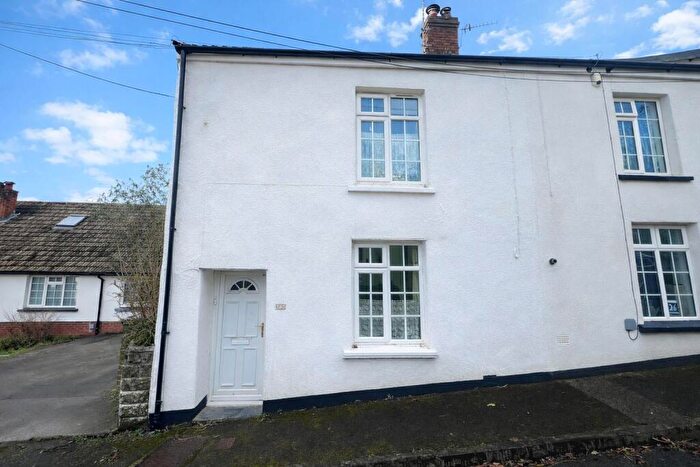
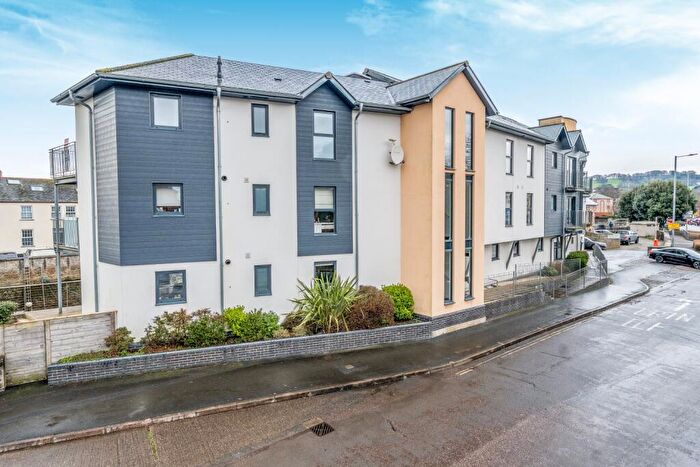
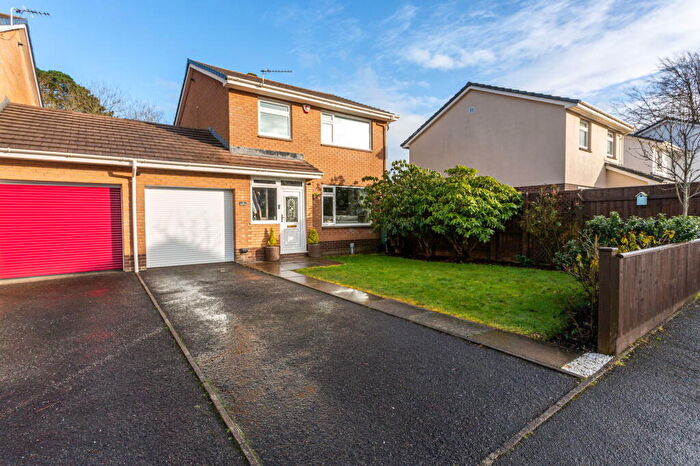
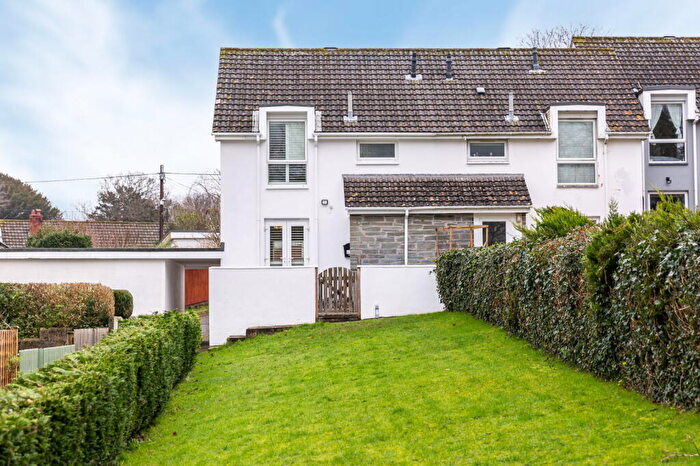
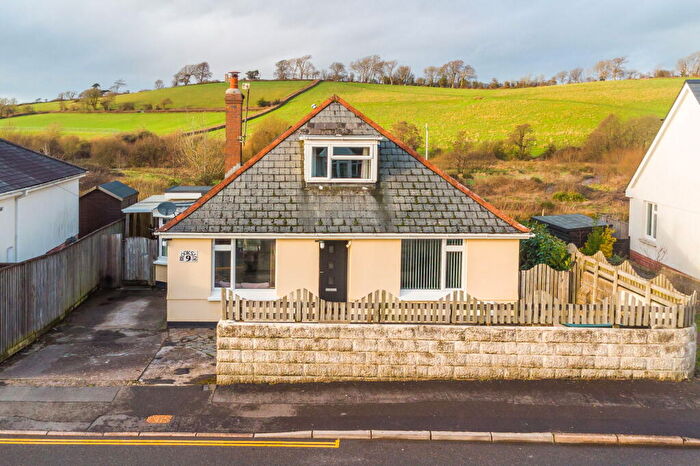
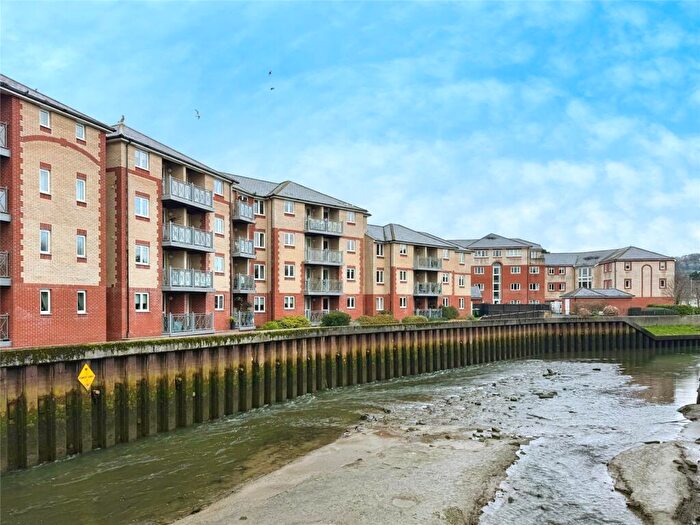
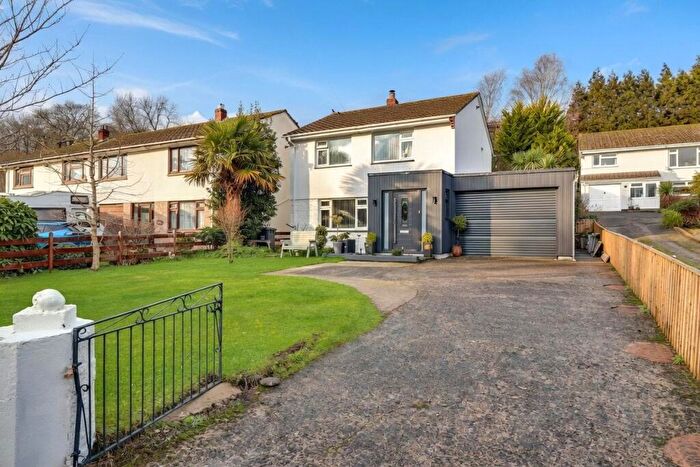
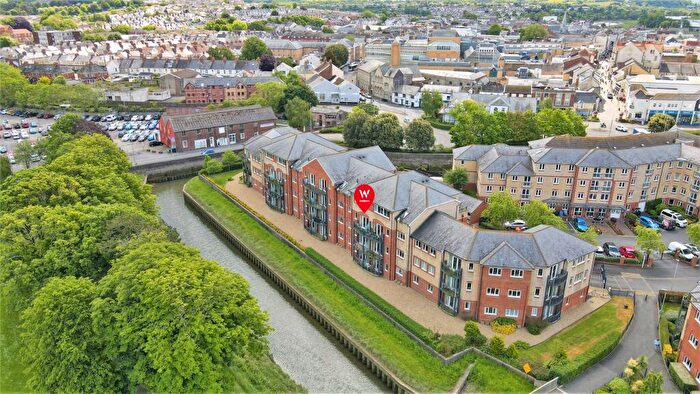
Houses for sale & to rent in Pilton, Barnstaple
House Prices in Pilton
Properties in Pilton have an average house price of £254,594.00 and had 198 Property Transactions within the last 3 years¹.
Pilton is an area in Barnstaple, Devon with 1,743 households², where the most expensive property was sold for £910,000.00.
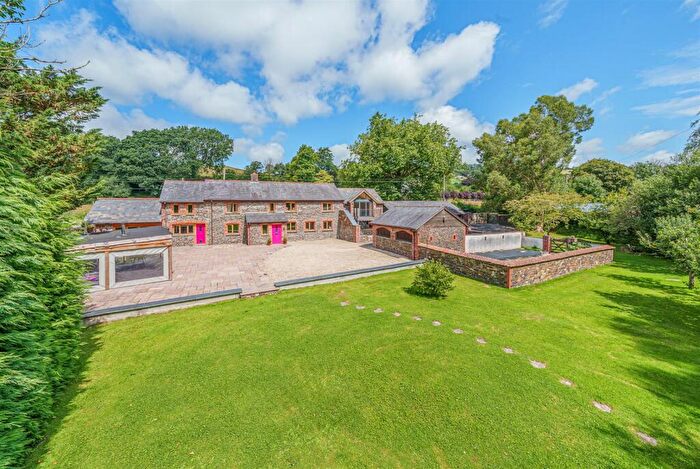
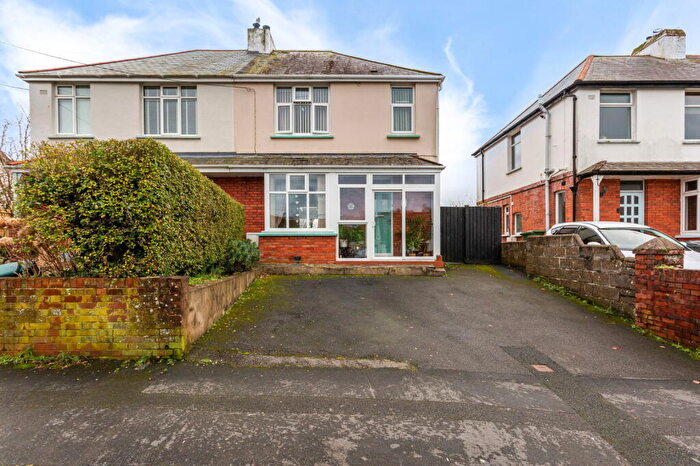
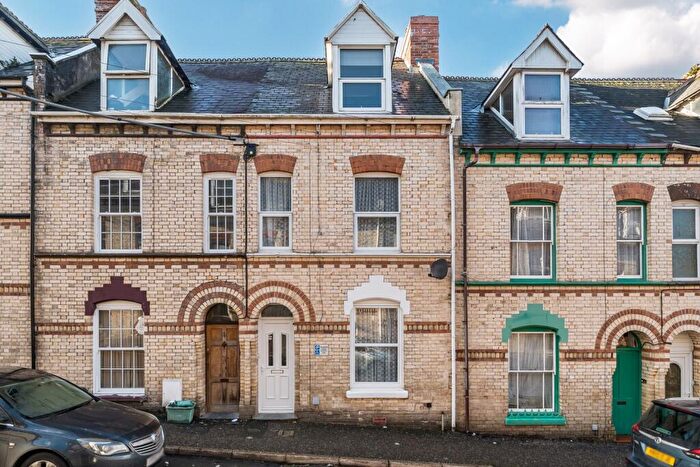
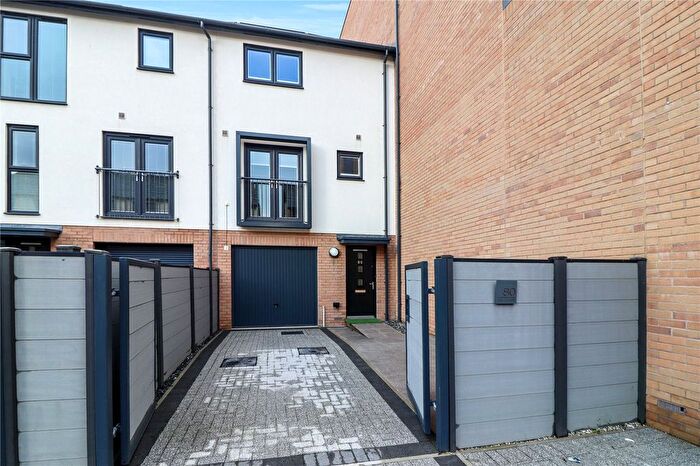
Properties for sale in Pilton
Roads and Postcodes in Pilton
Navigate through our locations to find the location of your next house in Pilton, Barnstaple for sale or to rent.
| Streets | Postcodes |
|---|---|
| Abbey Road | EX31 1QY |
| Barlow Road | EX31 1TR |
| Beech Grove | EX31 1PZ |
| Bellaire | EX31 1RG |
| Bellaire Drive | EX31 4AH EX31 4AJ |
| Braunton Road | EX31 1GA EX31 1GF EX31 1GH |
| Broadgate | EX31 1QZ |
| Broadgate Close | EX31 4AL |
| Bull Hill | EX31 1QR |
| Byron Close | EX31 1QH |
| Chaddiford Lane | EX31 1RD EX31 1RE EX31 1RF |
| Crosspark Close | EX31 4AN |
| Fair View | EX31 1JR EX31 1JS |
| Greenmeadow Drive | EX31 4HT |
| Higher Raleigh Road | EX31 1PR EX31 4JA |
| Ladywell | EX31 1QS EX31 1QT |
| Lion Cottages | EX31 4AP |
| Littabourne | EX31 1PU EX31 1PX |
| Lynbro Road | EX31 1QG |
| Maer Top Way | EX31 1RZ |
| Mannings Way | EX31 1QF |
| Masefield Avenue | EX31 1QJ |
| Meadow Road | EX31 4AF |
| Mill Road | EX31 1JQ |
| Mills Way | EX31 1GW EX31 1GX EX31 1GY EX31 1GZ |
| North Road | EX31 1PA |
| Northfield Lane | EX31 1QD EX31 1QE |
| Northfield Park | EX31 1QA |
| Nursery End | EX31 1RA |
| Pilton Lawn | EX31 4AA EX31 4AB |
| Pilton Quay | EX31 1PB EX31 1RN |
| Pilton Street | EX31 1PE EX31 1PG EX31 1PJ EX31 1PL EX31 1PQ |
| Pottington Drive | EX31 1LD |
| Pottington Road | EX31 1JH |
| Priory Close | EX31 1QX |
| Priory Gardens | EX31 1PT |
| Priory Road | EX31 1NX |
| Raleigh Cottages | EX31 4HZ |
| Raleigh Heights | EX31 1ND |
| Raleigh Road | EX31 4HY |
| Rolle Quay | EX31 1JE |
| Rolle Street | EX31 1JN EX31 1JW |
| Roselyn Terrace | EX31 1JX |
| The Gardens | EX31 1PP |
| The Rock | EX31 1PN |
| Under Minnow Road | EX31 1QU |
| West End | EX31 1GL |
| Westaway Close | EX31 1RU |
| Westaway Heights | EX31 1NR EX31 1NY |
| Western Terrace | EX31 1JG |
| Whites Lane | EX31 1PW |
| Windsor Road | EX31 4AG EX31 4AQ EX31 4AR |
| Wordsworth Avenue | EX31 1QQ |
| Youings Drive | EX31 1QL |
| EX31 4AD EX31 4AW |
Transport near Pilton
- FAQ
- Price Paid By Year
- Property Type Price
Frequently asked questions about Pilton
What is the average price for a property for sale in Pilton?
The average price for a property for sale in Pilton is £254,594. This amount is 16% lower than the average price in Barnstaple. There are 1,053 property listings for sale in Pilton.
What streets have the most expensive properties for sale in Pilton?
The streets with the most expensive properties for sale in Pilton are Under Minnow Road at an average of £499,166, Northfield Lane at an average of £425,071 and Byron Close at an average of £379,850.
What streets have the most affordable properties for sale in Pilton?
The streets with the most affordable properties for sale in Pilton are Western Terrace at an average of £162,100, Mills Way at an average of £171,777 and Fair View at an average of £192,327.
Which train stations are available in or near Pilton?
Some of the train stations available in or near Pilton are Barnstaple, Chapelton and Umberleigh.
Property Price Paid in Pilton by Year
The average sold property price by year was:
| Year | Average Sold Price | Price Change |
Sold Properties
|
|---|---|---|---|
| 2025 | £265,567 | 4% |
49 Properties |
| 2024 | £255,621 | 4% |
78 Properties |
| 2023 | £245,893 | -3% |
71 Properties |
| 2022 | £252,958 | -2% |
73 Properties |
| 2021 | £257,532 | 3% |
86 Properties |
| 2020 | £248,833 | 17% |
75 Properties |
| 2019 | £207,509 | 3% |
76 Properties |
| 2018 | £200,608 | -13% |
65 Properties |
| 2017 | £226,769 | 15% |
75 Properties |
| 2016 | £191,981 | -1% |
85 Properties |
| 2015 | £193,192 | -8% |
86 Properties |
| 2014 | £208,343 | 15% |
80 Properties |
| 2013 | £176,075 | 8% |
63 Properties |
| 2012 | £162,536 | -6% |
67 Properties |
| 2011 | £172,199 | -11% |
56 Properties |
| 2010 | £191,728 | -3% |
56 Properties |
| 2009 | £197,468 | 19% |
105 Properties |
| 2008 | £159,890 | -24% |
97 Properties |
| 2007 | £199,042 | 11% |
195 Properties |
| 2006 | £178,112 | -0,1% |
117 Properties |
| 2005 | £178,325 | 10% |
91 Properties |
| 2004 | £160,006 | 8% |
48 Properties |
| 2003 | £147,095 | 20% |
73 Properties |
| 2002 | £118,304 | 21% |
65 Properties |
| 2001 | £93,686 | 16% |
92 Properties |
| 2000 | £78,258 | 17% |
87 Properties |
| 1999 | £64,731 | -4% |
99 Properties |
| 1998 | £67,509 | 19% |
82 Properties |
| 1997 | £54,973 | 4% |
95 Properties |
| 1996 | £52,597 | 9% |
68 Properties |
| 1995 | £47,930 | - |
65 Properties |
Property Price per Property Type in Pilton
Here you can find historic sold price data in order to help with your property search.
The average Property Paid Price for specific property types in the last three years are:
| Property Type | Average Sold Price | Sold Properties |
|---|---|---|
| Semi Detached House | £304,373.00 | 25 Semi Detached Houses |
| Detached House | £407,324.00 | 33 Detached Houses |
| Terraced House | £238,431.00 | 82 Terraced Houses |
| Flat | £169,090.00 | 58 Flats |

