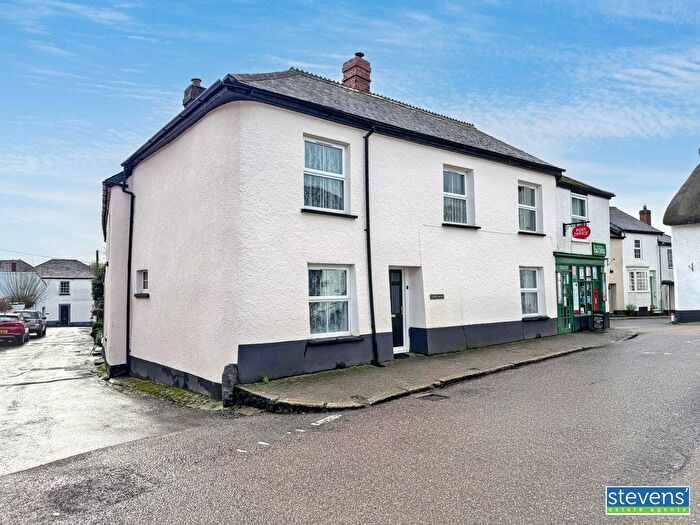
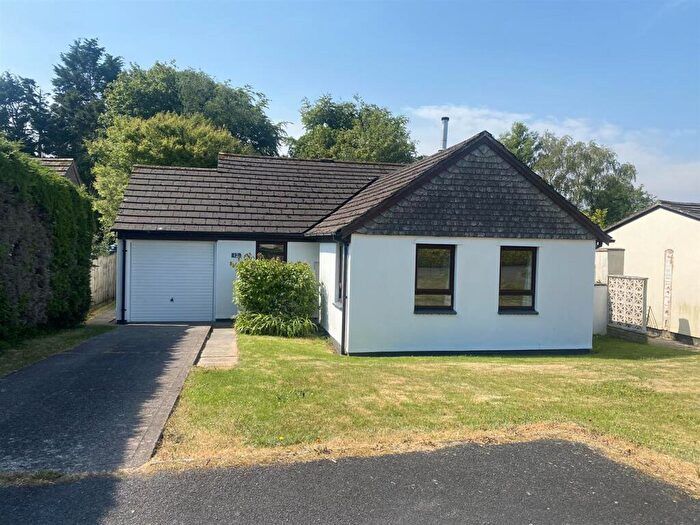
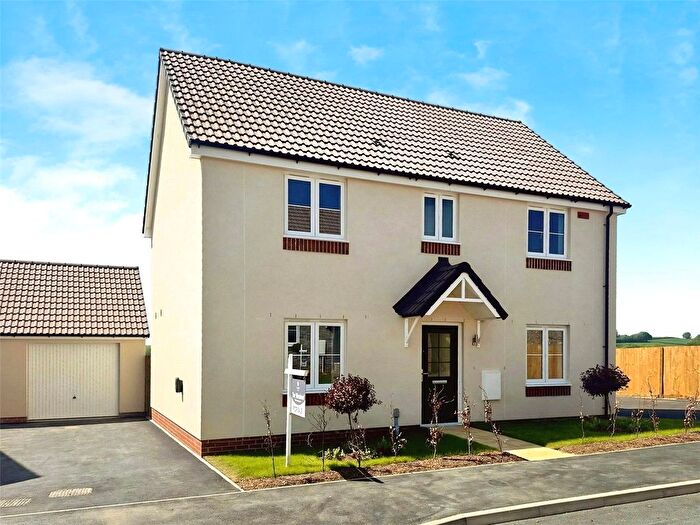
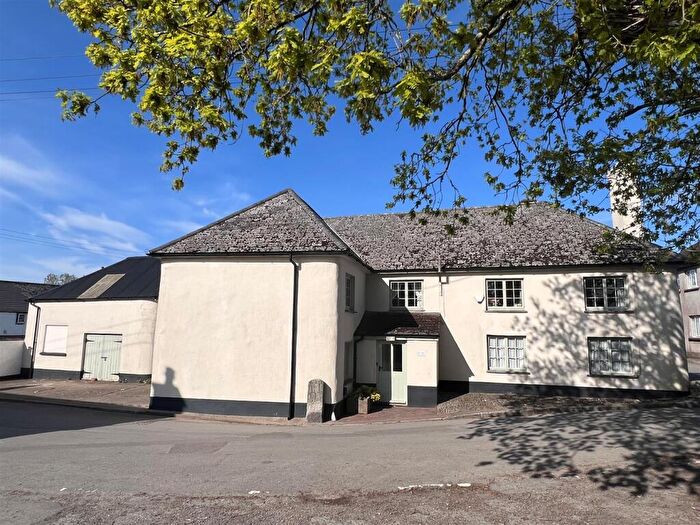
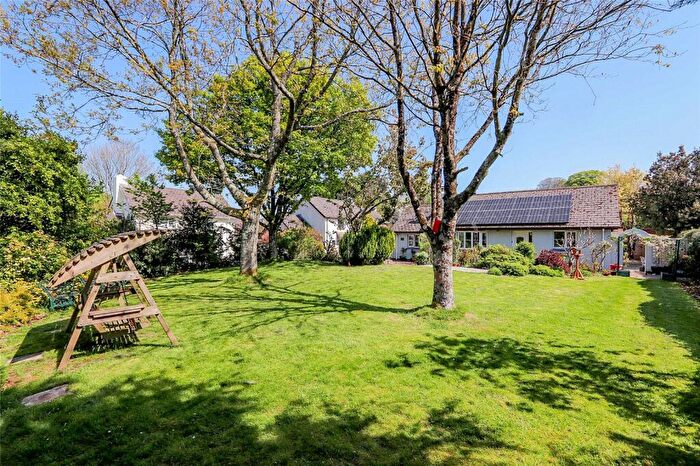
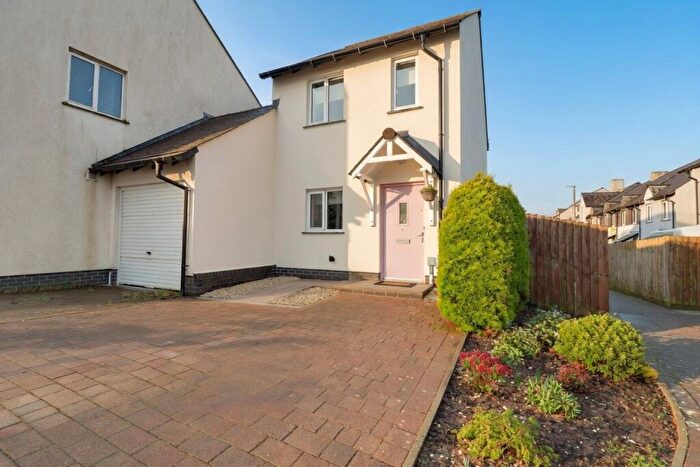
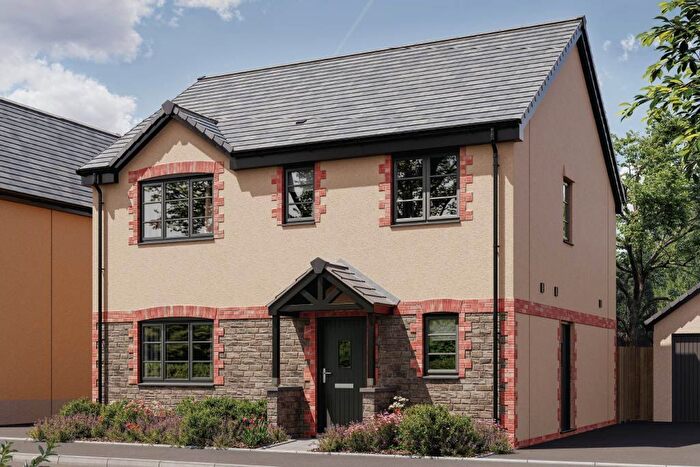
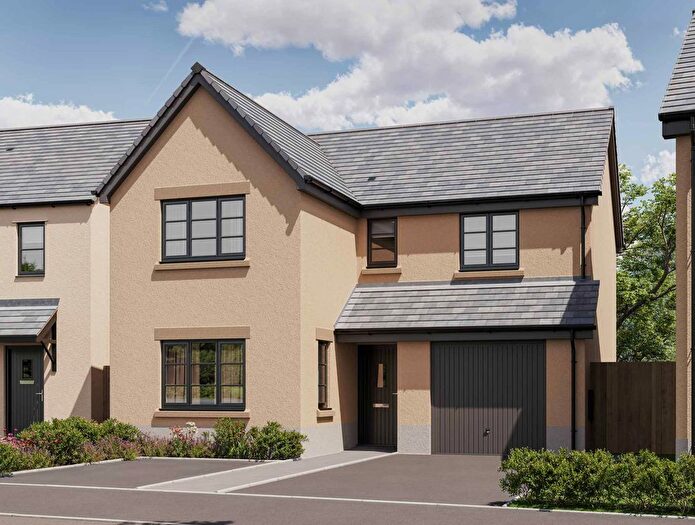
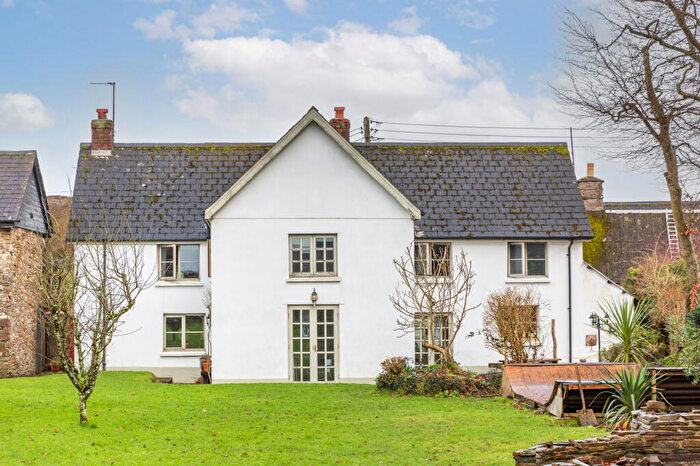
Houses for sale & to rent in Winkleigh, Chulmleigh
House Prices in Winkleigh
Properties in Winkleigh have an average house price of £423,783.00 and had 21 Property Transactions within the last 3 years¹.
Winkleigh is an area in Chulmleigh, Devon with 279 households², where the most expensive property was sold for £695,000.00.
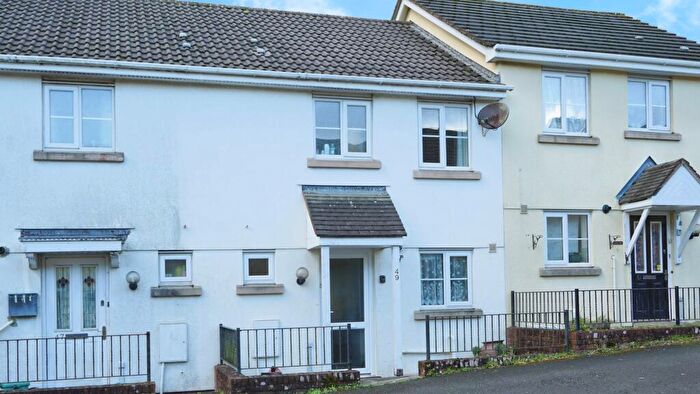
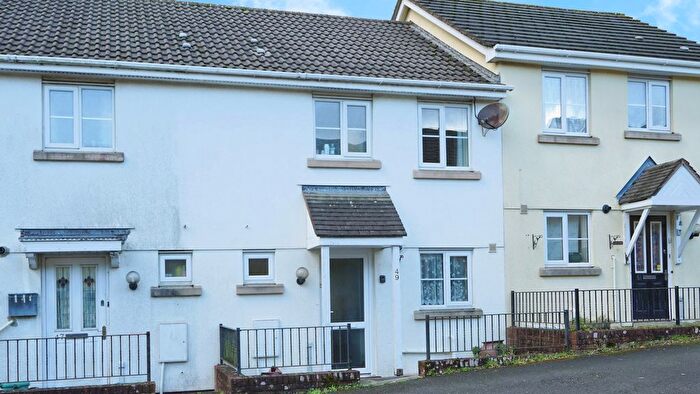
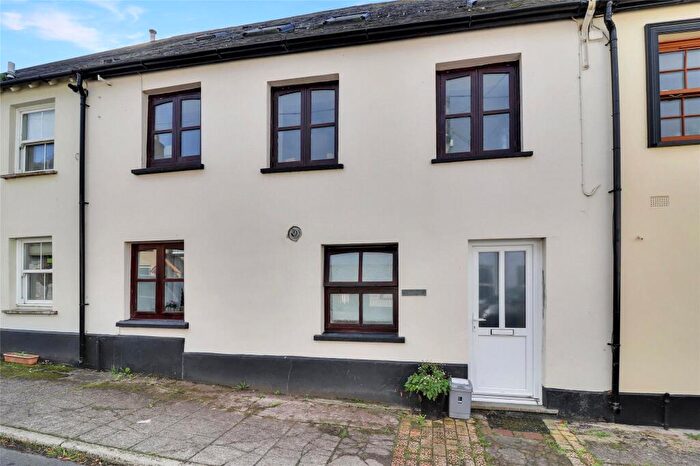
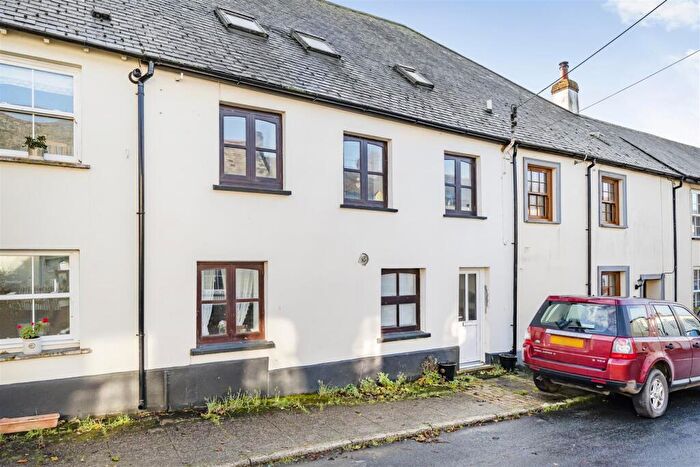
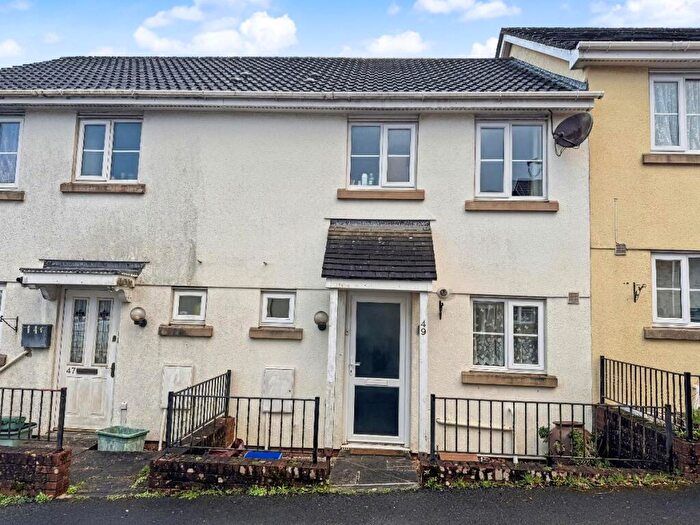
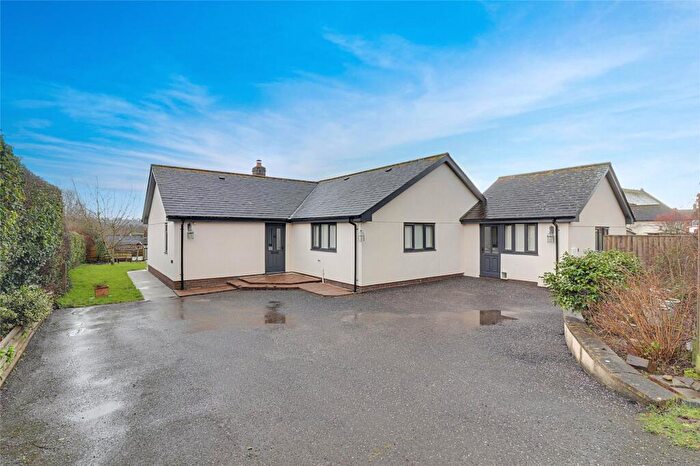
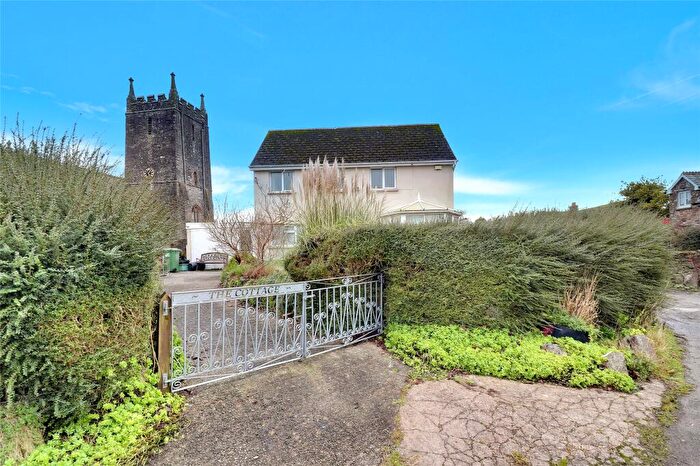
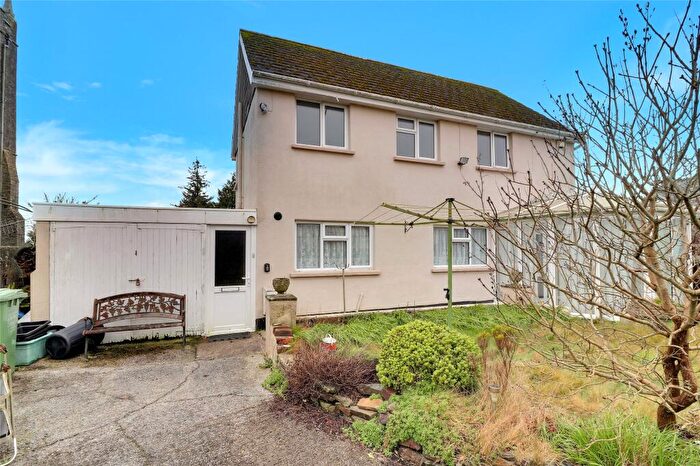
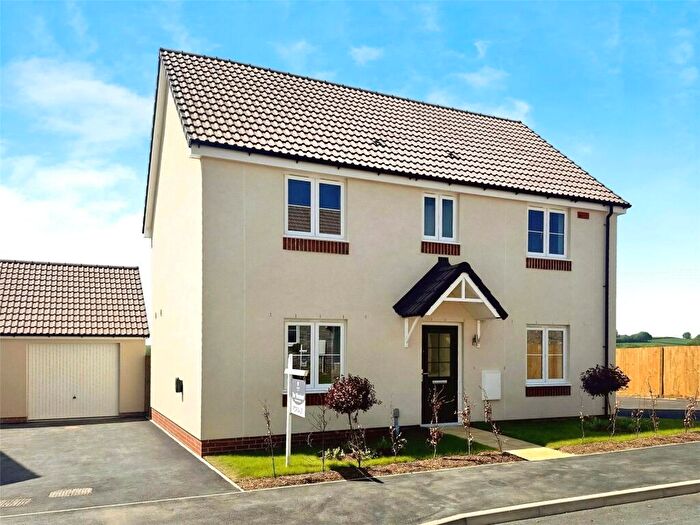
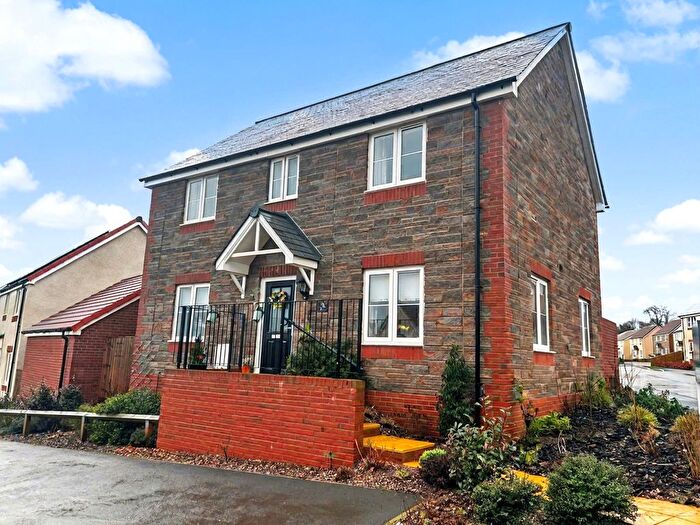
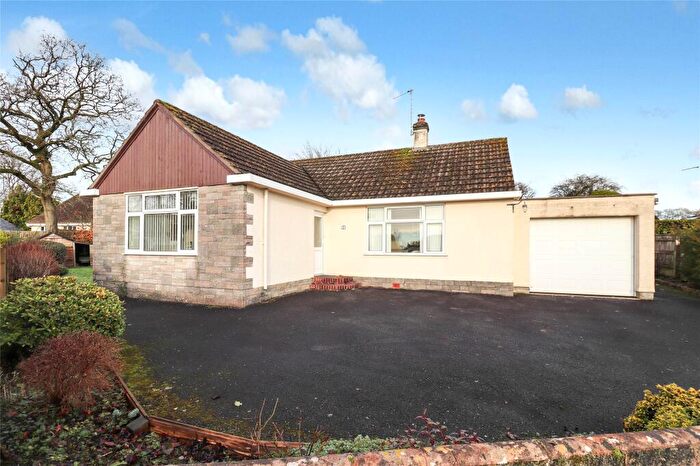
Properties for sale in Winkleigh
Roads and Postcodes in Winkleigh
Navigate through our locations to find the location of your next house in Winkleigh, Chulmleigh for sale or to rent.
| Streets | Postcodes |
|---|---|
| Beech Lea | EX18 7NA |
| Church Street | EX18 7LP |
| Coles Court | EX18 7LH |
| Cottwood | EX18 7PG |
| Green Hedges | EX18 7LT |
| Old Orchard | EX18 7PA |
| Rose Cottages | EX18 7LZ |
| Shute Wood | EX18 7QJ |
| The Terrace | EX18 7LX |
| The Village | EX18 7LU |
| Westmead | EX18 7PD |
| EX18 7BA EX18 7BB EX18 7BD EX18 7LS EX18 7LY EX18 7NB EX18 7ND EX18 7NE EX18 7NF EX18 7NG EX18 7NT EX18 7NU EX18 7NX EX18 7NY EX18 7NZ EX18 7PE EX18 7PH EX18 7PL EX18 7PP EX18 7PQ EX18 7QA EX18 7QB EX18 7QD EX18 7QE EX18 7QQ EX18 7RH EX18 7RL EX18 7SW EX18 7LQ EX18 7NH EX18 7NJ EX18 7NQ EX18 7PB EX18 7PF EX18 7PJ EX18 7PN EX18 7PR EX18 7PW EX18 7QF EX18 7QG EX18 7QH EX18 7RJ EX18 7RQ |
Transport near Winkleigh
- FAQ
- Price Paid By Year
- Property Type Price
Frequently asked questions about Winkleigh
What is the average price for a property for sale in Winkleigh?
The average price for a property for sale in Winkleigh is £423,783. This amount is 28% higher than the average price in Chulmleigh. There are 762 property listings for sale in Winkleigh.
What streets have the most expensive properties for sale in Winkleigh?
The street with the most expensive properties for sale in Winkleigh is Cottwood at an average of £339,950.
What streets have the most affordable properties for sale in Winkleigh?
The street with the most affordable properties for sale in Winkleigh is Beech Lea at an average of £260,000.
Which train stations are available in or near Winkleigh?
Some of the train stations available in or near Winkleigh are King's Nympton, Eggesford and Portsmouth Arms.
Property Price Paid in Winkleigh by Year
The average sold property price by year was:
| Year | Average Sold Price | Price Change |
Sold Properties
|
|---|---|---|---|
| 2025 | £382,181 | -11% |
8 Properties |
| 2024 | £423,142 | -13% |
7 Properties |
| 2023 | £480,000 | 17% |
6 Properties |
| 2022 | £400,357 | 9% |
7 Properties |
| 2021 | £363,859 | 12% |
16 Properties |
| 2020 | £320,000 | -27% |
3 Properties |
| 2019 | £405,625 | 21% |
4 Properties |
| 2018 | £318,888 | -7% |
9 Properties |
| 2017 | £340,600 | 1% |
10 Properties |
| 2016 | £338,859 | -1% |
11 Properties |
| 2015 | £341,000 | 7% |
13 Properties |
| 2014 | £318,000 | 11% |
8 Properties |
| 2013 | £281,611 | 15% |
9 Properties |
| 2012 | £240,578 | -4% |
12 Properties |
| 2011 | £249,375 | -2% |
8 Properties |
| 2010 | £254,658 | -18% |
6 Properties |
| 2009 | £300,707 | 17% |
7 Properties |
| 2008 | £248,333 | -74% |
3 Properties |
| 2007 | £433,000 | 31% |
11 Properties |
| 2006 | £297,926 | 24% |
15 Properties |
| 2005 | £226,031 | 2% |
14 Properties |
| 2004 | £221,641 | 13% |
6 Properties |
| 2003 | £192,391 | 3% |
24 Properties |
| 2002 | £186,111 | 20% |
18 Properties |
| 2001 | £147,972 | 7% |
9 Properties |
| 2000 | £137,204 | -1% |
12 Properties |
| 1999 | £138,695 | 30% |
10 Properties |
| 1998 | £96,928 | -8% |
7 Properties |
| 1997 | £104,909 | 13% |
11 Properties |
| 1996 | £91,437 | -3% |
4 Properties |
| 1995 | £94,395 | - |
10 Properties |
Property Price per Property Type in Winkleigh
Here you can find historic sold price data in order to help with your property search.
The average Property Paid Price for specific property types in the last three years are:
| Property Type | Average Sold Price | Sold Properties |
|---|---|---|
| Semi Detached House | £260,500.00 | 5 Semi Detached Houses |
| Detached House | £474,809.00 | 16 Detached Houses |

