
Houses for sale in EX24 6SD, Coly Valley, Colyton
House Prices in EX24 6SD, Coly Valley
Properties in EX24 6SD have no sales history available within the last 3 years. EX24 6SD is a postcode in Coly Valley, an area in Colyton, Devon, with 9 households².
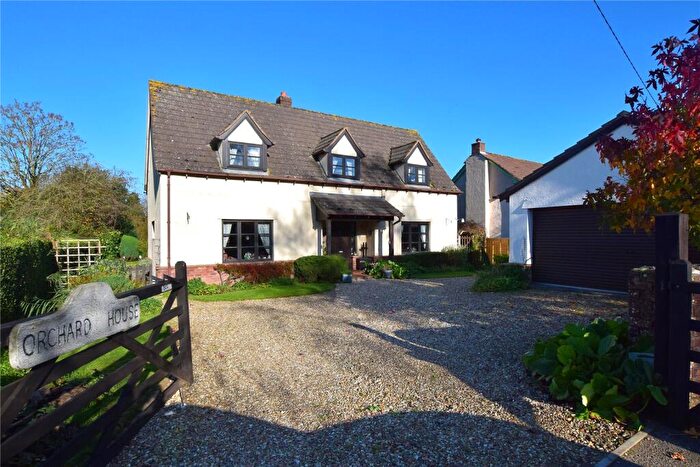
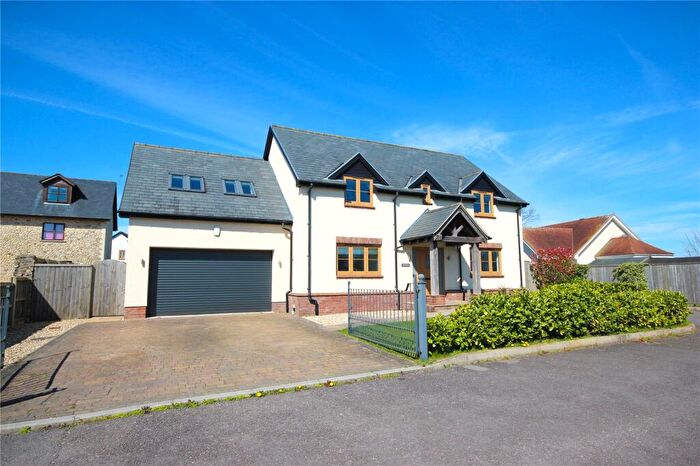
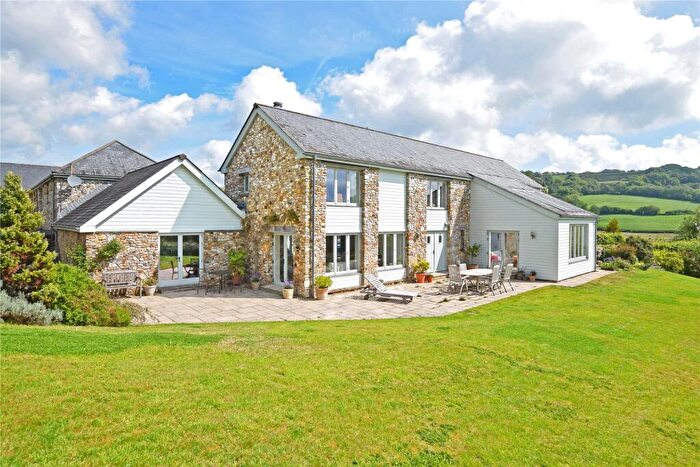
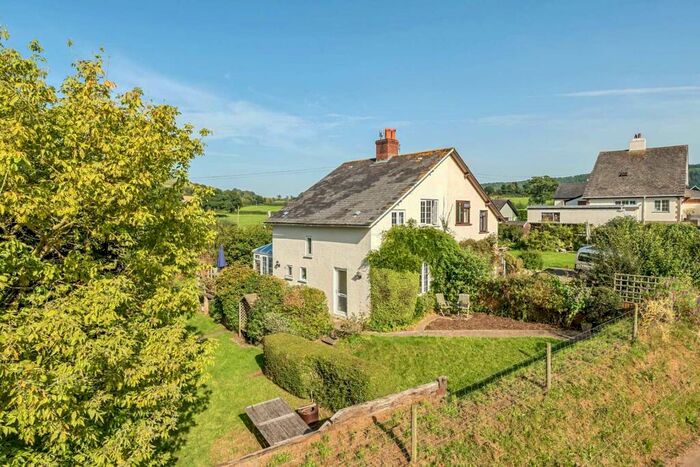
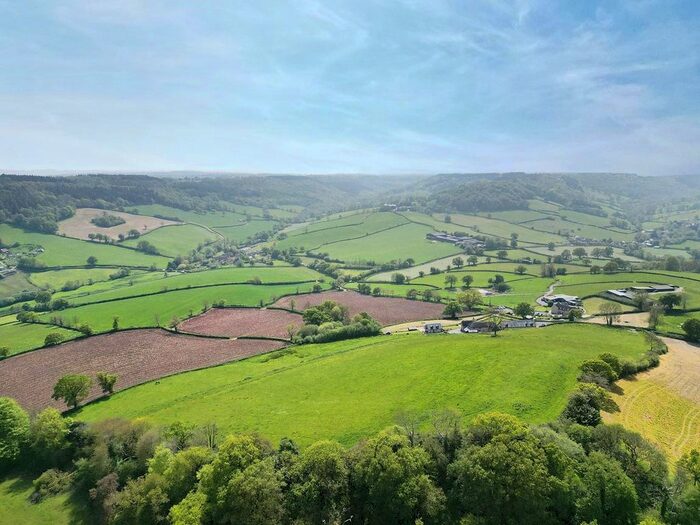
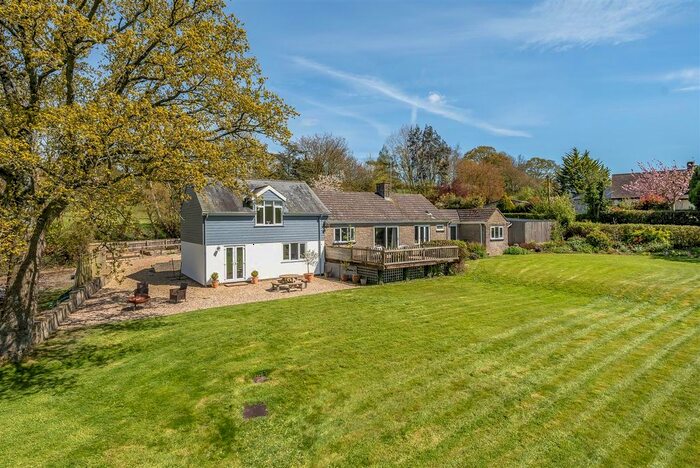
Properties for sale near EX24 6SD

![]()
If you are looking to sell your house, let it out, or receive a property valuation, an expert can help you.
Click the button below to get started.
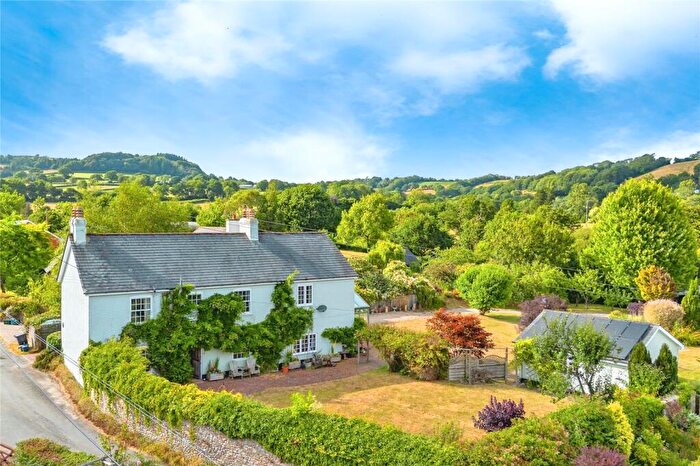
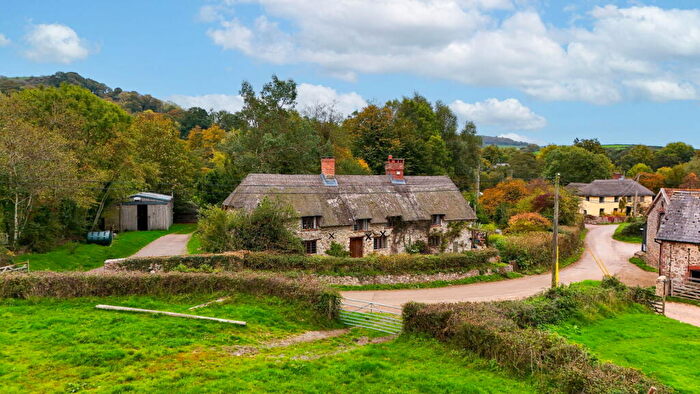
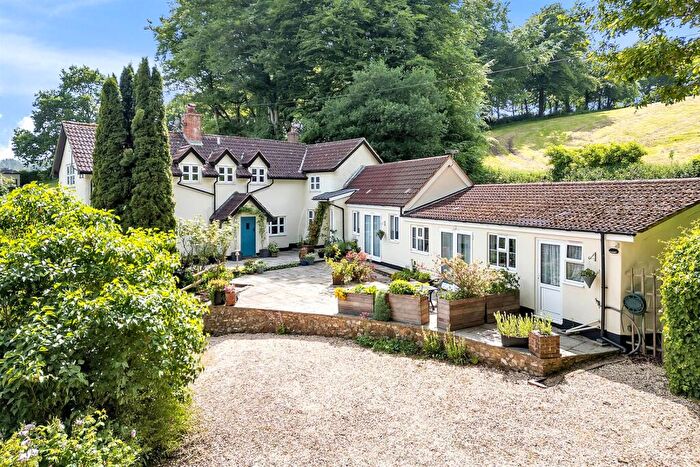
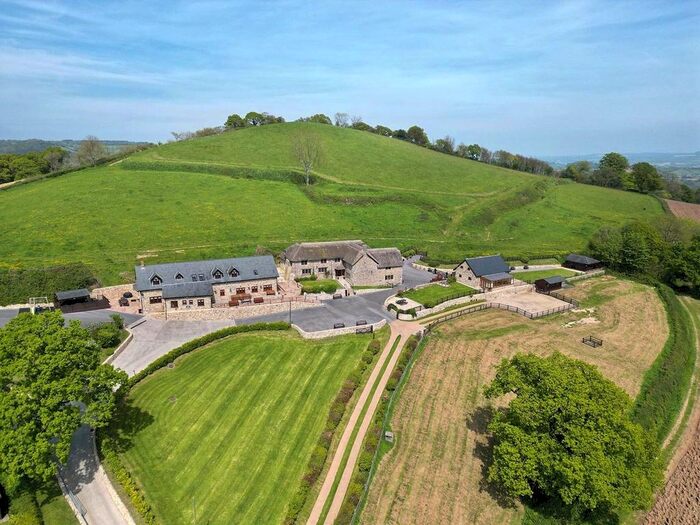
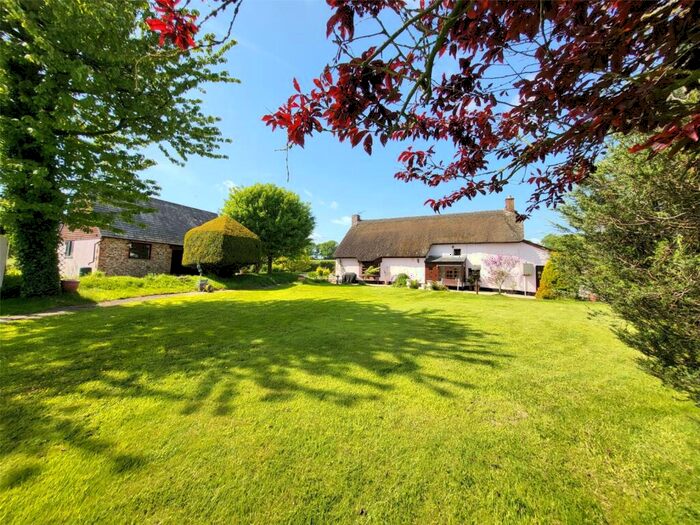
Previously listed properties near EX24 6SD


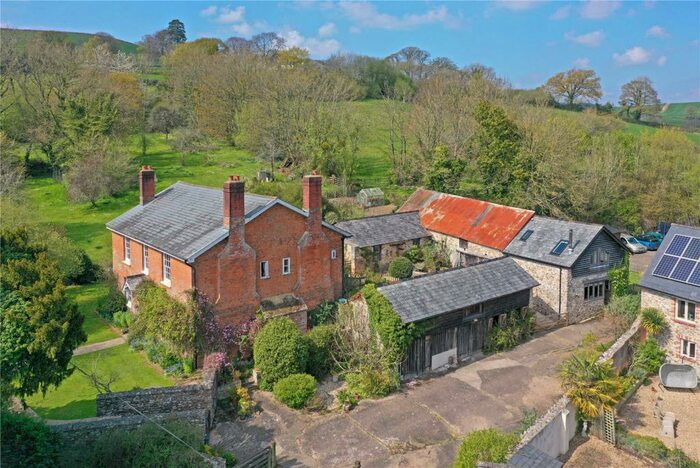
![]()
If you are looking to sell your house, let it out, or receive a property valuation, an expert can help you.
Click the button below to get started.
Price Paid in EX24 6SD, Coly Valley
BEECHCROFT EX24 6SD, Coly Valley Colyton
Property BEECHCROFT has been sold 2 times. The last time it was sold was in 11/10/2017 and the sold price was £735,000.00.
This detached house, sold as a freehold on 11/10/2017, is a 174 sqm detached house with an EPC rating of B.
| Date | Price | Property Type | Tenure | Classification |
|---|---|---|---|---|
| 11/10/2017 | £735,000.00 | Detached House | freehold | Established Building |
| 24/11/2011 | £100,000.00 | Detached House | freehold | Established Building |
SCRUEL BARTON COTTAGES 2 EX24 6SD, Coly Valley Colyton
Property SCRUEL BARTON COTTAGES 2 has been sold 1 time. The last time it was sold was in 11/10/2013 and the sold price was £239,000.00.
This is a Semi Detached House which was sold as a freehold in 11/10/2013
| Date | Price | Property Type | Tenure | Classification |
|---|---|---|---|---|
| 11/10/2013 | £239,000.00 | Semi Detached House | freehold | Established Building |
2 Scruel Barton Cottages Southleigh, EX24 6SD, Coly Valley Colyton
This is a 113 square meter Semi-detached House with an EPC rating of E. Currently, there is no transaction history available for this property.
Property price trends in EX24 6SD
According to the latest Land Registry data, the average home in EX24 6SD sold for £735,000 in 2017. That figure comes from 3 sales logged over the past 6 years.
Prices have continued to climb over the last three years. Compared with 2013, when the typical sale came in around £239,000, that's a rise of roughly 207.5%.
Looking back five years, average prices are up about 635% since 2011, a gain of around £635,000 in cash terms.
Property Price Paid in EX24 6SD by Year
The average sold property price by year was:
| Year | Average Sold Price | Price Change |
Sold Properties
|
|---|---|---|---|
| 2017 | £735,000 | 67% |
1 Property |
| 2013 | £239,000 | 58% |
1 Property |
| 2011 | £100,000 | - |
1 Property |
