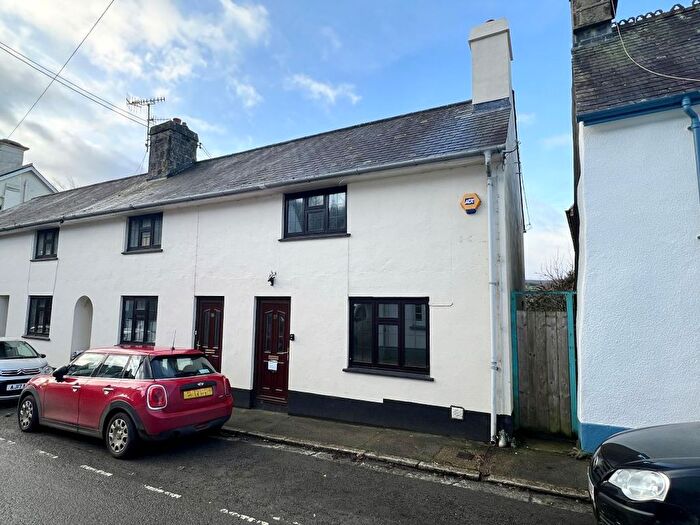
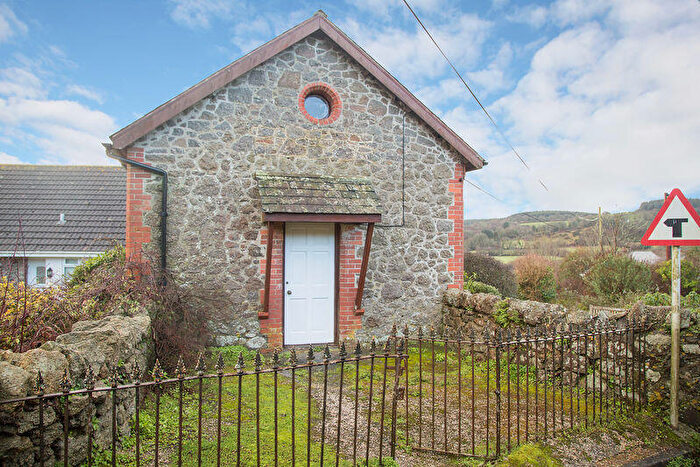
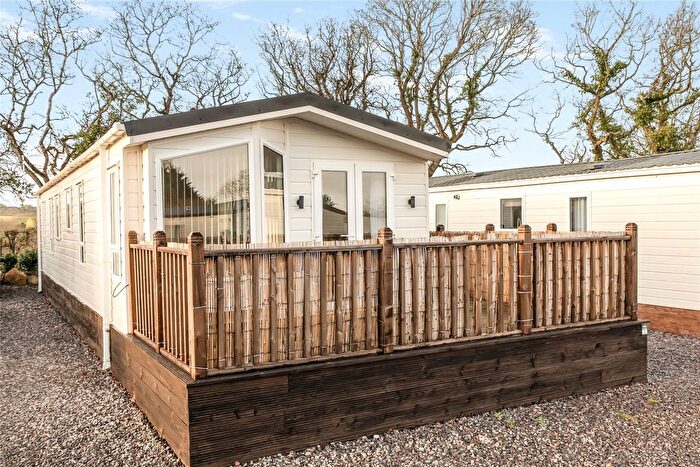
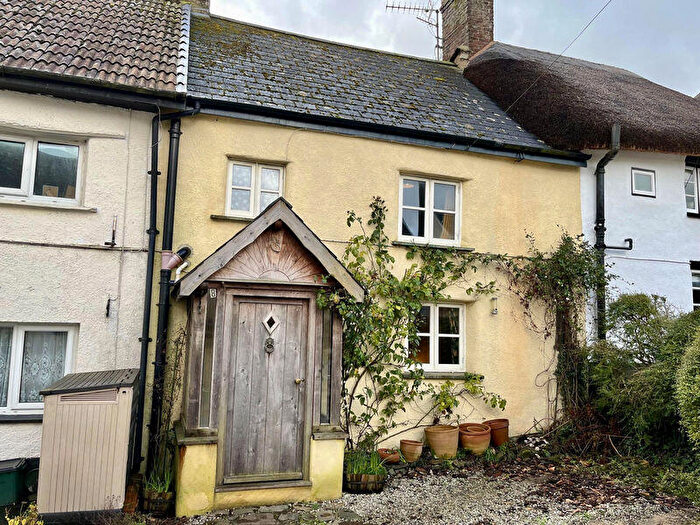
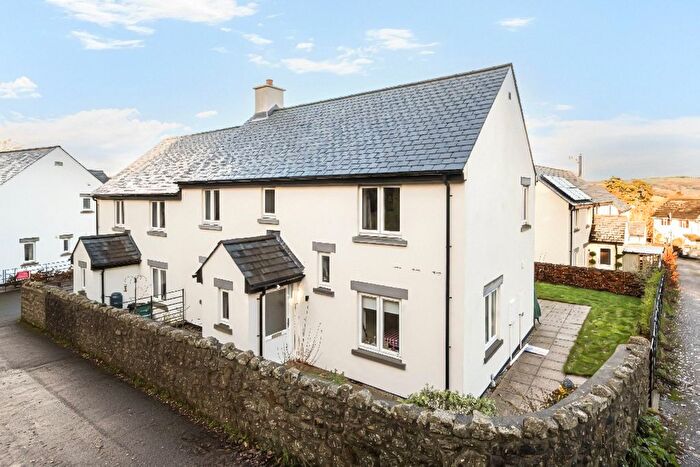
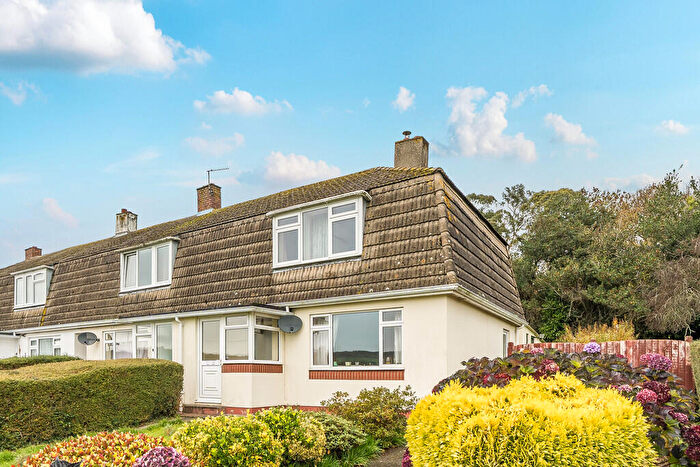
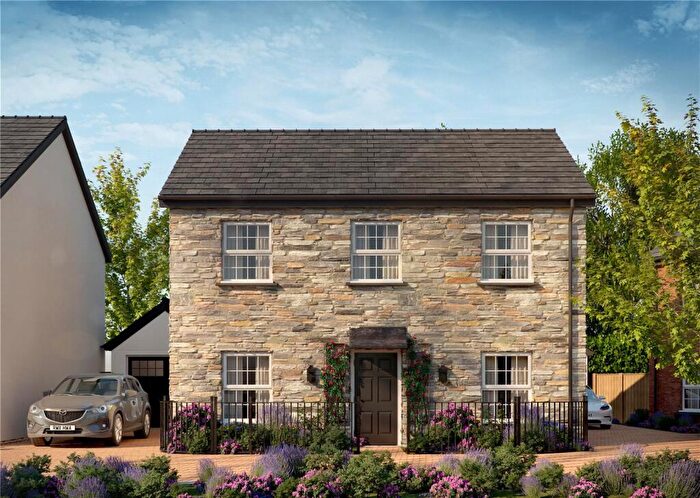
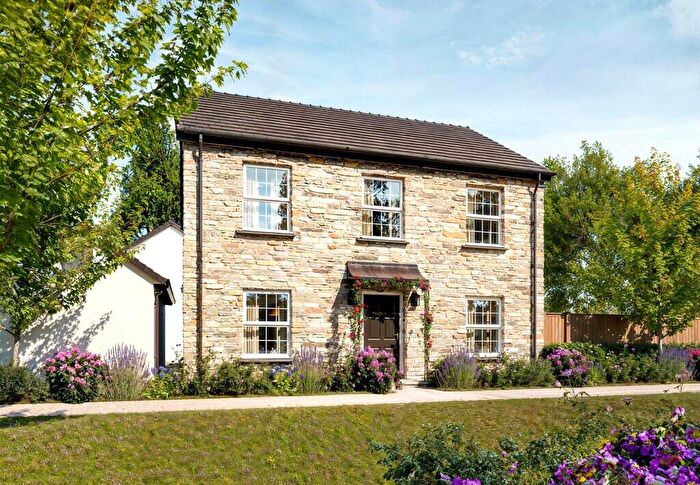
Houses for sale & to rent in Moretonhampstead, Newton Abbot
House Prices in Moretonhampstead
Properties in Moretonhampstead have an average house price of £790,833.00 and had 6 Property Transactions within the last 3 years¹.
Moretonhampstead is an area in Newton Abbot, Devon with 98 households², where the most expensive property was sold for £1,350,000.00.
Properties for sale in Moretonhampstead
Roads and Postcodes in Moretonhampstead
Navigate through our locations to find the location of your next house in Moretonhampstead, Newton Abbot for sale or to rent.
| Streets | Postcodes |
|---|---|
| Betton Way | TQ13 8NA |
| Bidder Close | TQ13 8NR |
| Bow Lane | TQ13 8PD |
| Cossick Cross | TQ13 8SN |
| Court Street | TQ13 8LZ |
| Cross Street | TQ13 8NN |
| Doccombe | TQ13 8SX |
| Hingston View | TQ13 8FW |
| Mill Road | TQ13 9SR |
| North Bovey Road | TQ13 8PQ |
| Old Barn Drive | TQ13 8FB |
| Station Road | TQ13 8NU |
| TQ13 7TT TQ13 8LX TQ13 8NS TQ13 8PR TQ13 8PS TQ13 8PX TQ13 8QB TQ13 8QD TQ13 8QE TQ13 8QG TQ13 8QH TQ13 8QJ TQ13 8QT TQ13 8RE TQ13 8RF TQ13 8RH TQ13 8RL TQ13 8RQ TQ13 8RT TQ13 8RW TQ13 8SB TQ13 8SF TQ13 8SG TQ13 8SH TQ13 8SR TQ13 8WQ TQ13 8WS TQ13 8YQ TQ13 8YX TQ13 9NP TQ13 9SL TQ13 9UD TQ13 9UN TQ13 9UQ TQ13 9XD TQ13 9XG |
Transport near Moretonhampstead
-
Yeoford Station
-
Crediton Station
-
Exeter St. Thomas Station
-
Newton Abbot Station
-
Exeter St. David's Station
-
Copplestone Station
-
Sampford Courtenay Station
-
Okehampton Station
-
Exeter Central Station
-
Newton St.Cyres Station
- FAQ
- Price Paid By Year
- Property Type Price
Frequently asked questions about Moretonhampstead
What is the average price for a property for sale in Moretonhampstead?
The average price for a property for sale in Moretonhampstead is £790,833. This amount is 135% higher than the average price in Newton Abbot. There are 562 property listings for sale in Moretonhampstead.
Which train stations are available in or near Moretonhampstead?
Some of the train stations available in or near Moretonhampstead are Yeoford, Crediton and Exeter St. Thomas.
Property Price Paid in Moretonhampstead by Year
The average sold property price by year was:
| Year | Average Sold Price | Price Change |
Sold Properties
|
|---|---|---|---|
| 2025 | £420,000 | -95% |
1 Property |
| 2024 | £820,000 | -9% |
2 Properties |
| 2023 | £895,000 | 70% |
3 Properties |
| 2020 | £269,000 | 12% |
2 Properties |
| 2018 | £237,500 | -16% |
1 Property |
| 2017 | £274,500 | 11% |
4 Properties |
| 2016 | £245,480 | 3% |
5 Properties |
| 2015 | £238,283 | -55% |
3 Properties |
| 2014 | £368,900 | -64% |
5 Properties |
| 2007 | £605,000 | 47% |
1 Property |
| 2006 | £320,000 | -103% |
1 Property |
| 2003 | £650,000 | 82% |
1 Property |
| 1999 | £120,000 | - |
1 Property |
Property Price per Property Type in Moretonhampstead
Here you can find historic sold price data in order to help with your property search.
The average Property Paid Price for specific property types in the last three years are:
| Property Type | Average Sold Price | Sold Properties |
|---|---|---|
| Detached House | £790,833.00 | 6 Detached Houses |

