
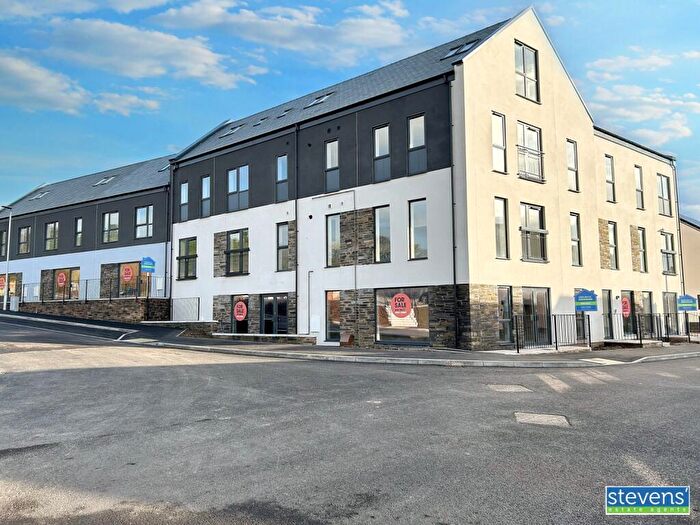
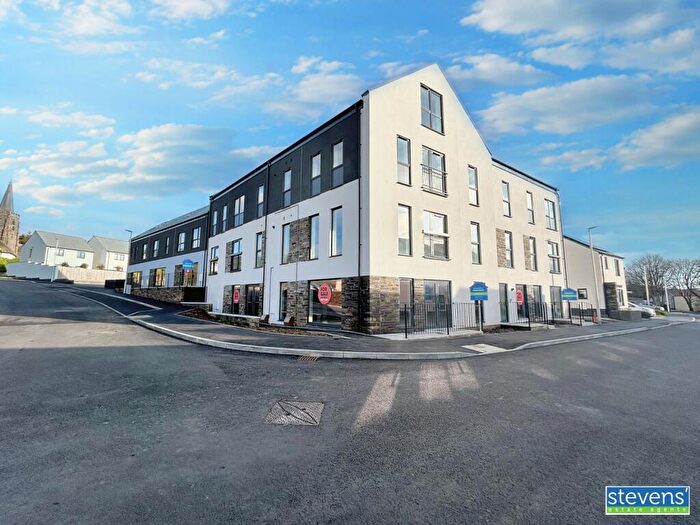
Houses for sale in EX20 3JQ, Normandy Place, Hatherleigh, Okehampton
House Prices in EX20 3JQ, Normandy Place, Hatherleigh
Properties in EX20 3JQ have no sales history available within the last 3 years. EX20 3JQ is a postcode in Normandy Place located in Hatherleigh, an area in Okehampton, Devon, with 4 households².
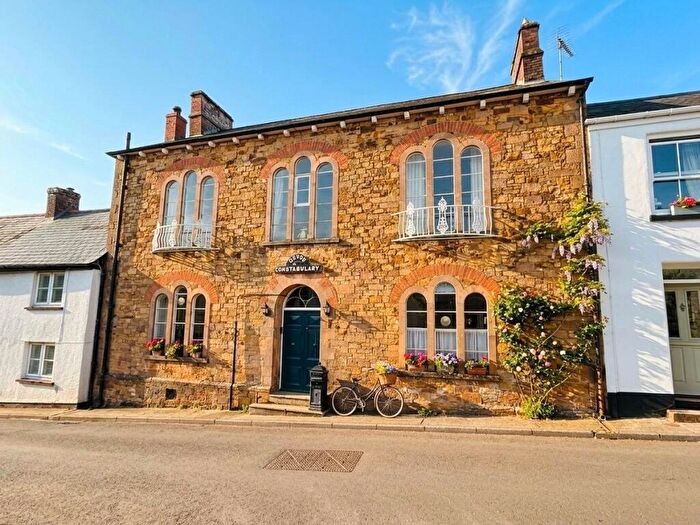
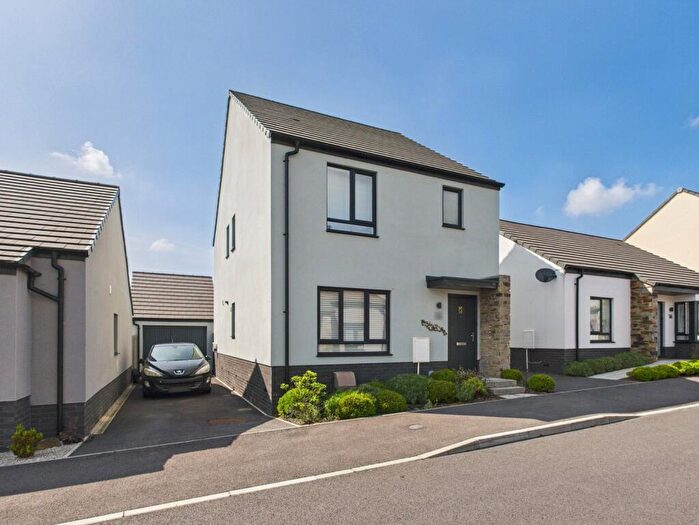
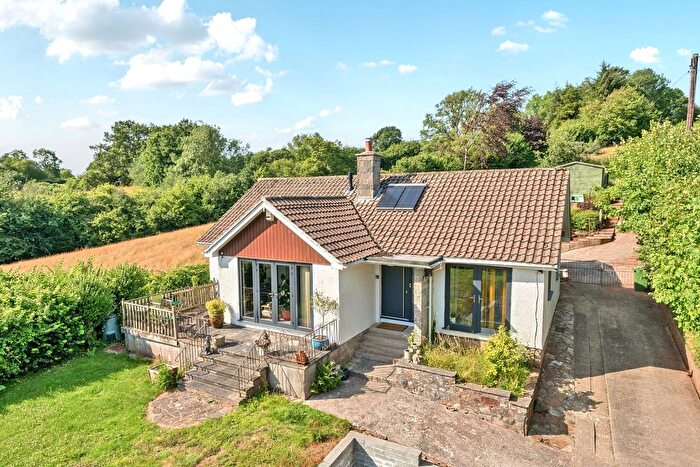
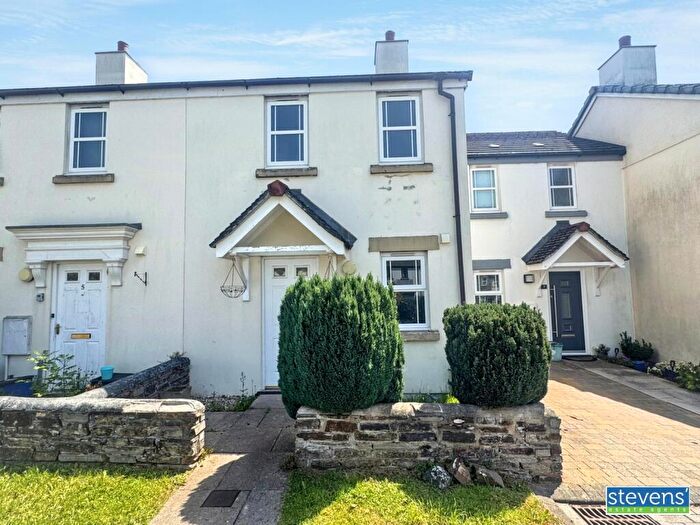
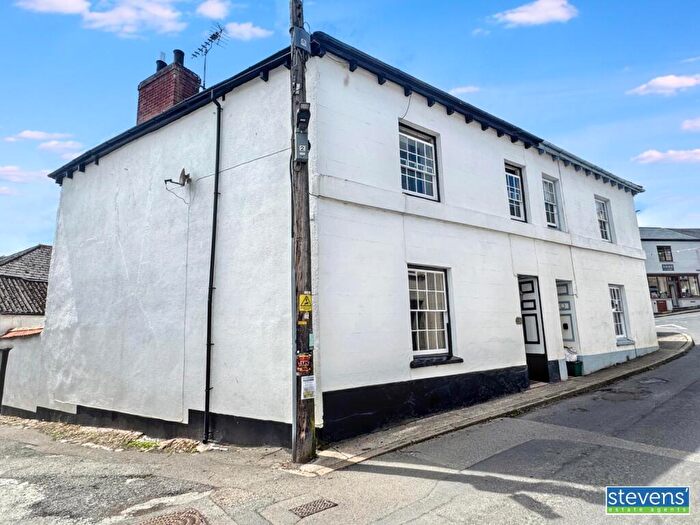
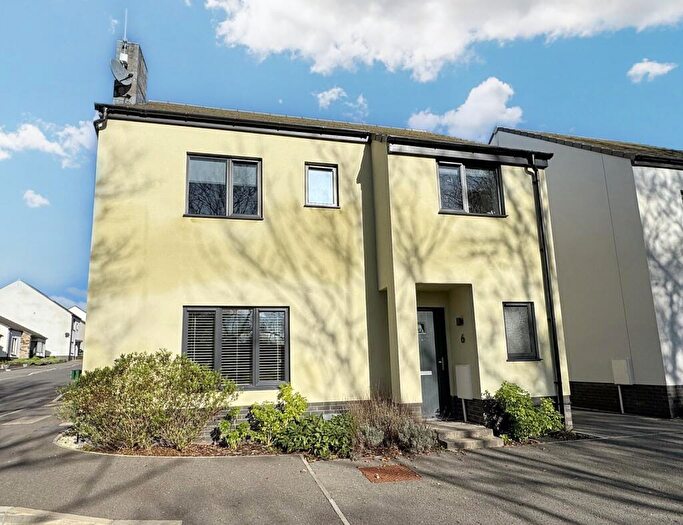
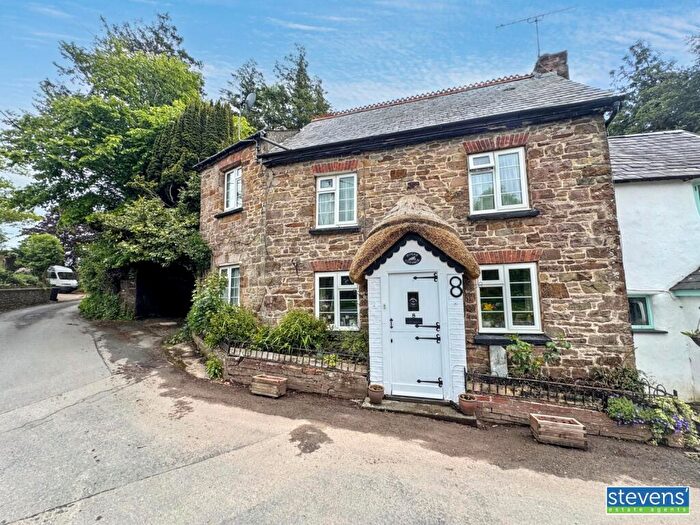
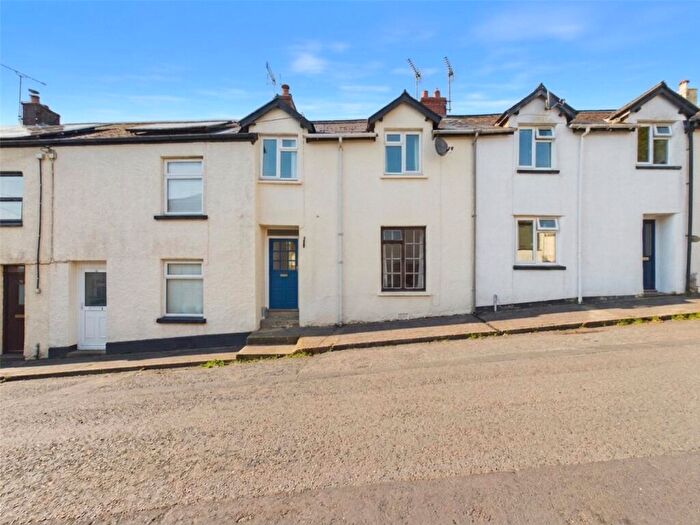
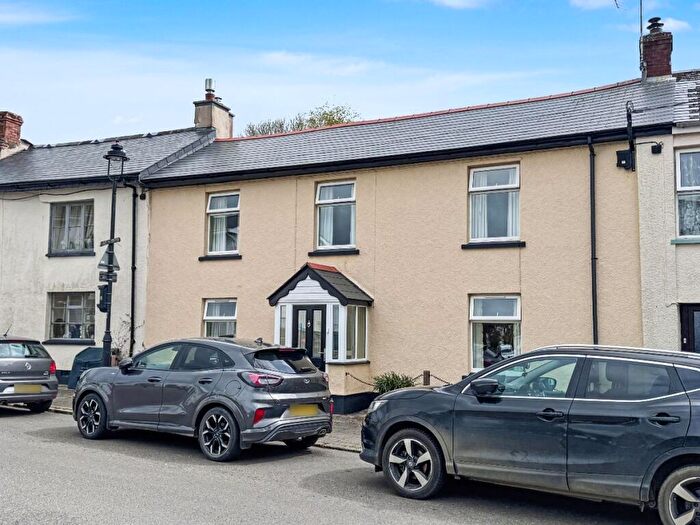
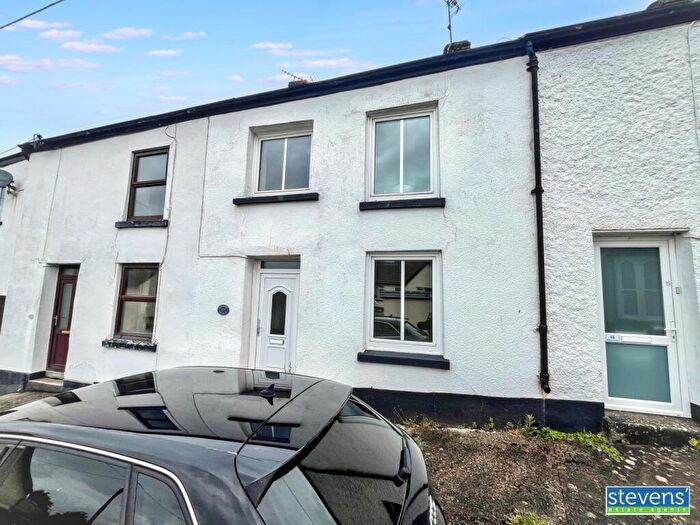
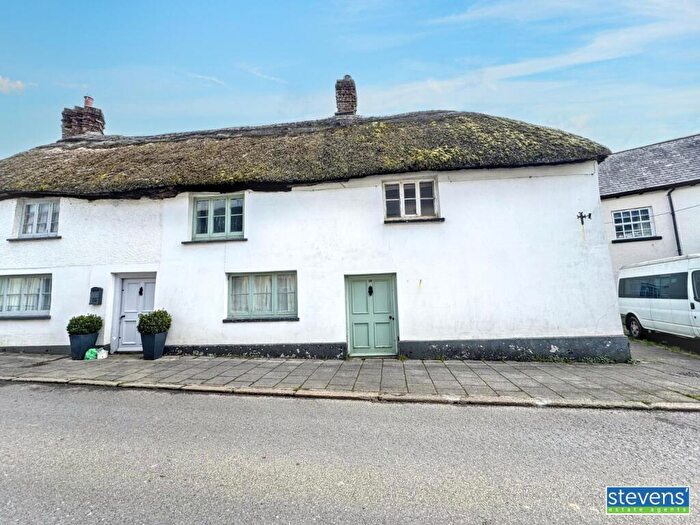
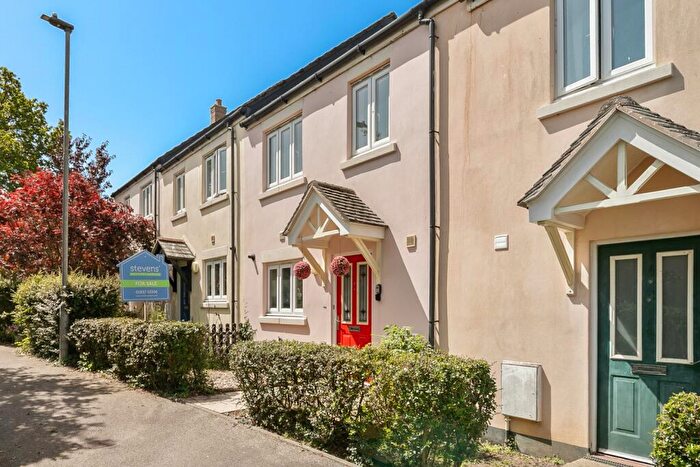
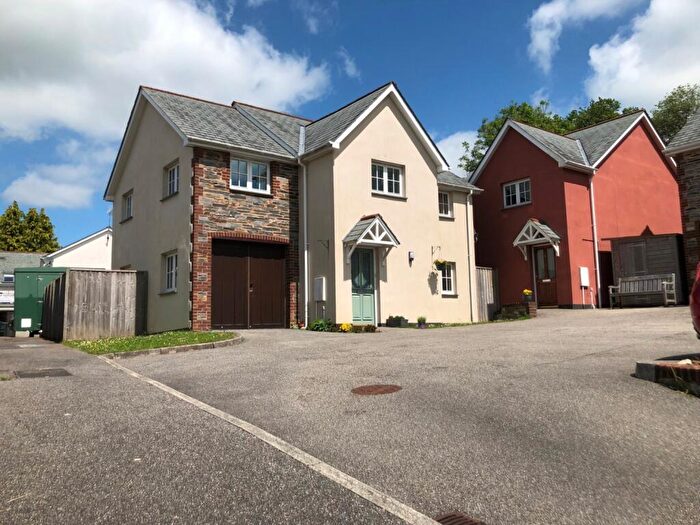
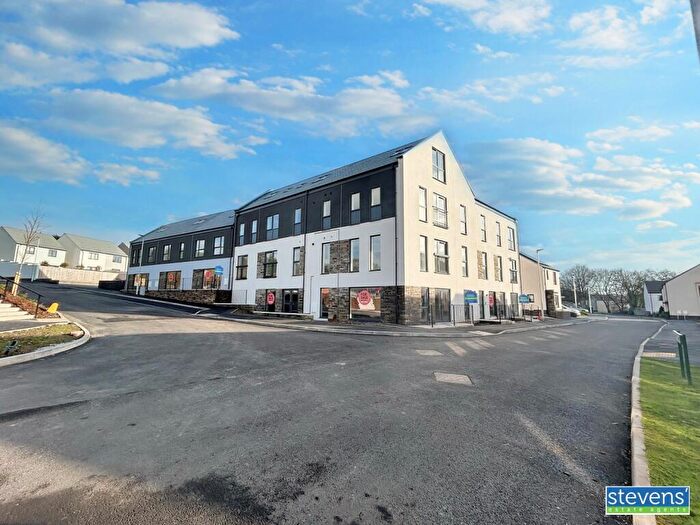
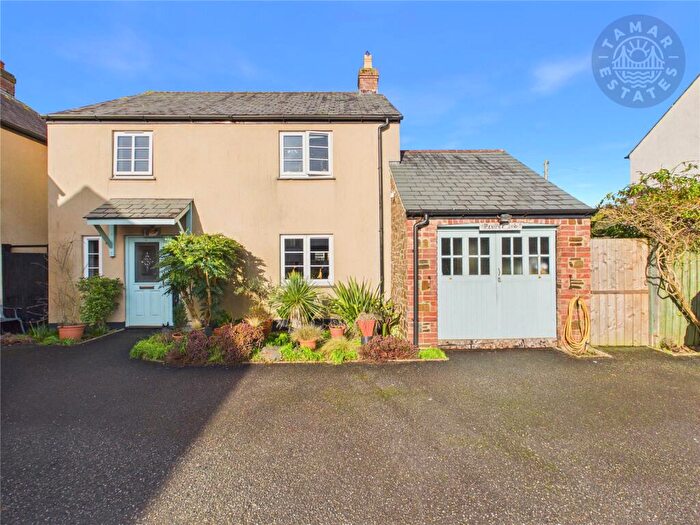
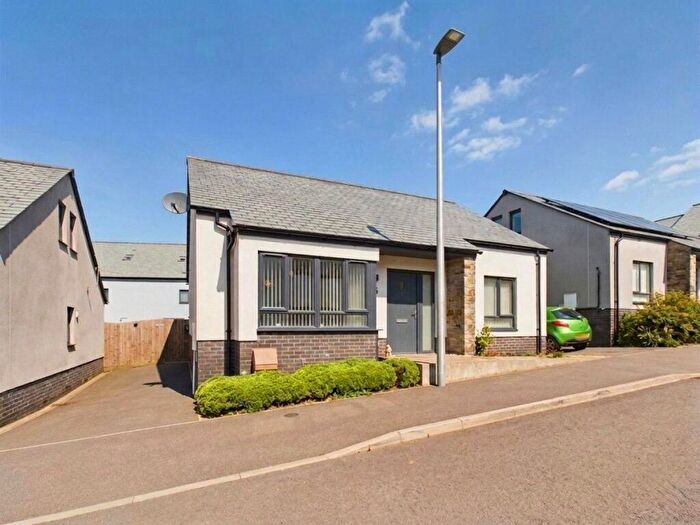
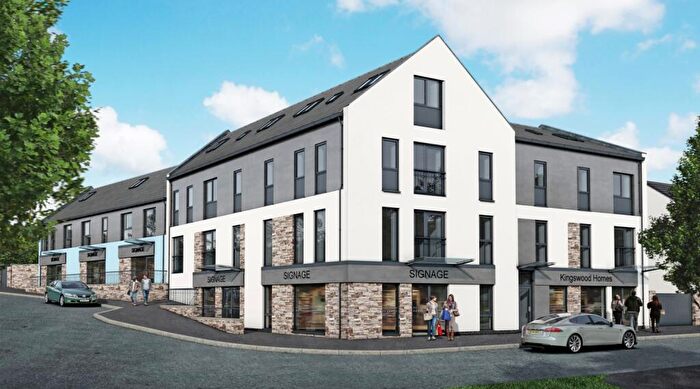
Properties for sale near EX20 3JQ, Normandy Place

![]()
If you are looking to sell your house, let it out, or receive a property valuation, an expert can help you.
Click the button below to get started.
Price Paid in Normandy Place, EX20 3JQ, Hatherleigh
3 Normandy Place, EX20 3JQ, Hatherleigh Okehampton
Property 3 has been sold 3 times. The last time it was sold was in 04/08/2017 and the sold price was £223,000.00.
This semi detached house, sold as a freehold on 04/08/2017, is a 101 sqm semi-detached house with an EPC rating of F.
| Date | Price | Property Type | Tenure | Classification |
|---|---|---|---|---|
| 04/08/2017 | £223,000.00 | Semi Detached House | freehold | Established Building |
| 21/12/2007 | £186,000.00 | Semi Detached House | freehold | Established Building |
| 24/10/2003 | £136,000.00 | Semi Detached House | freehold | Established Building |
2 Normandy Place, EX20 3JQ, Hatherleigh Okehampton
Property 2 has been sold 2 times. The last time it was sold was in 22/09/2000 and the sold price was £92,000.00.
This is a Semi Detached House which was sold as a freehold in 22/09/2000
| Date | Price | Property Type | Tenure | Classification |
|---|---|---|---|---|
| 22/09/2000 | £92,000.00 | Semi Detached House | freehold | Established Building |
| 11/11/1996 | £69,250.00 | Semi Detached House | freehold | Established Building |
Property price trends in EX20 3JQ, Normandy Place
According to the latest Land Registry data, the average home in EX20 3JQ, Normandy Place sold for £223,000 in 2017. That figure comes from 5 sales logged over the past 21 years.
Zoom out to the past decade for the fuller picture. Back in 2007, homes here averaged £186,000, so the typical sold price has climbed about 19.9% since then, roughly 1.8% a year. Stretch the view to fifteen years and that annual pace edges up closer to 3.6%.
Property Price Paid in EX20 3JQ, Normandy Place by Year
The average sold property price by year was:
| Year | Average Sold Price | Price Change |
Sold Properties
|
|---|---|---|---|
| 2017 | £223,000 | 17% |
1 Property |
| 2007 | £186,000 | 27% |
1 Property |
| 2003 | £136,000 | 32% |
1 Property |
| 2000 | £92,000 | 25% |
1 Property |
| 1996 | £69,250 | - |
1 Property |
