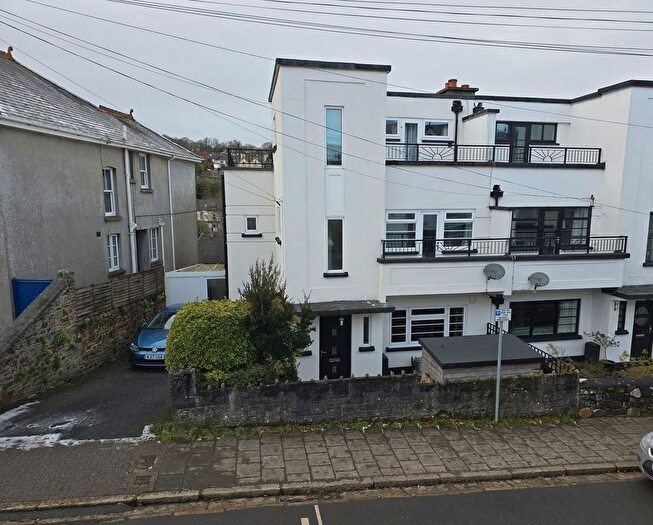
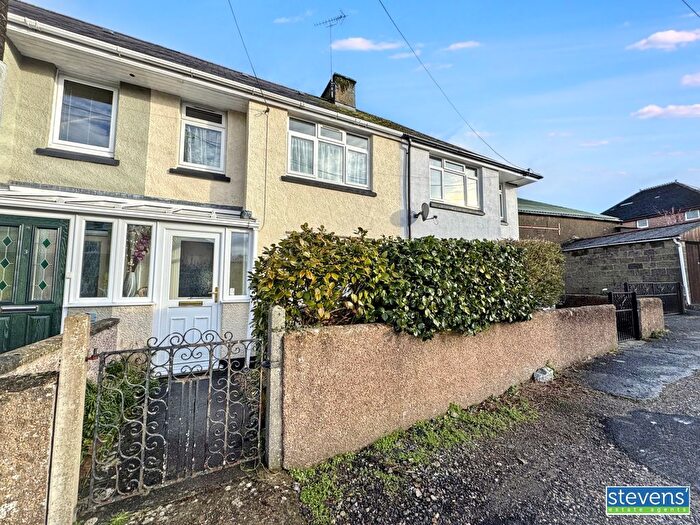
Houses for sale & to rent in Okehampton South, Okehampton
House Prices in Okehampton South
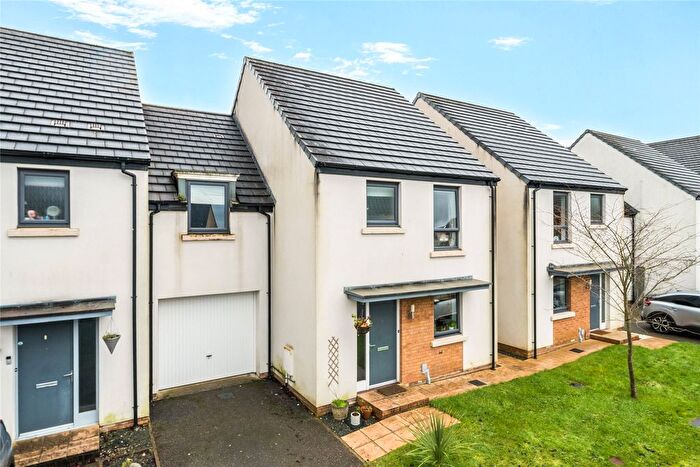
Properties in Okehampton South have an average house price of £200,000.00 and had 1 Property Transaction within the last 3 years¹.
Okehampton South is an area in Okehampton, Devon with 106 households², where the most expensive property was sold for £200,000.00.
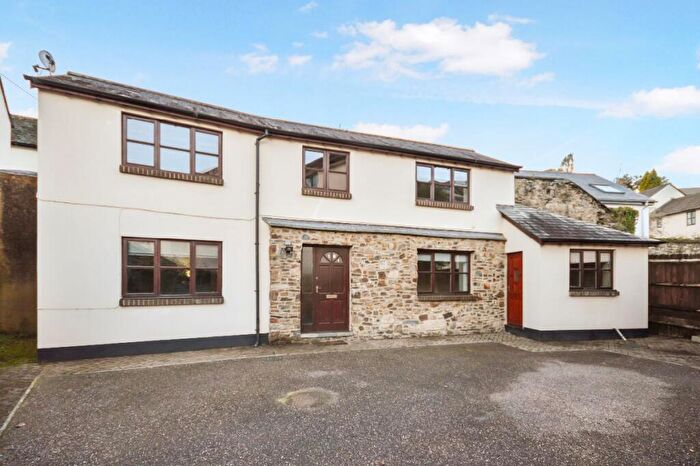
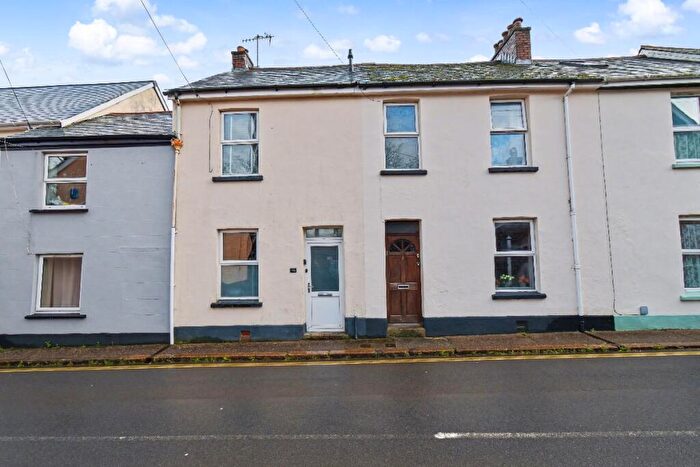
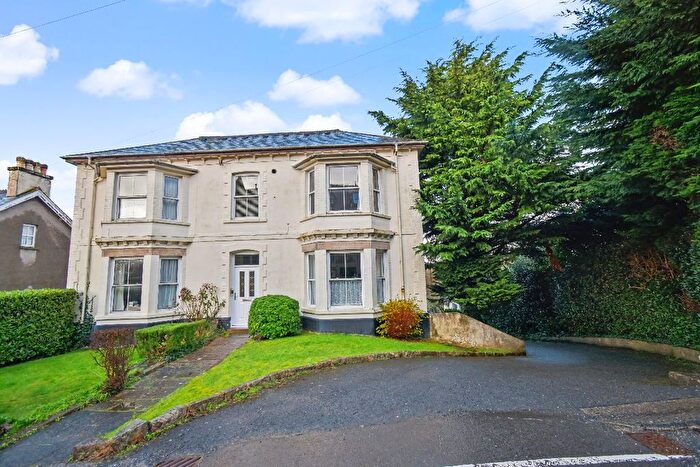
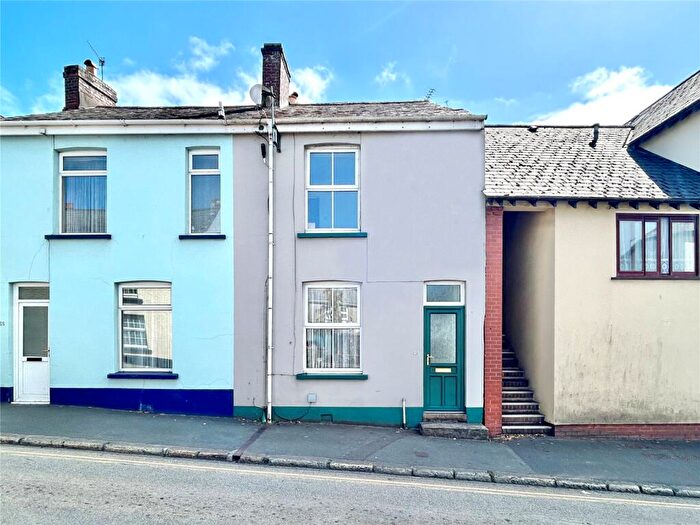
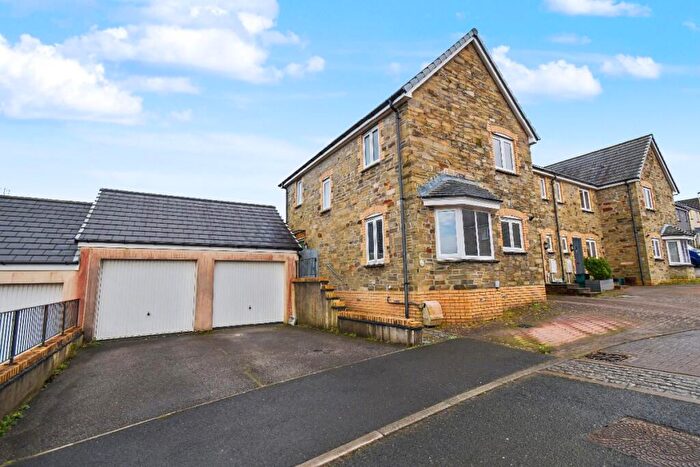
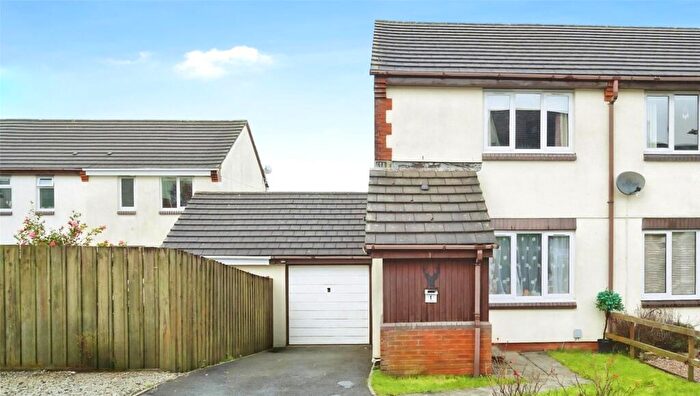
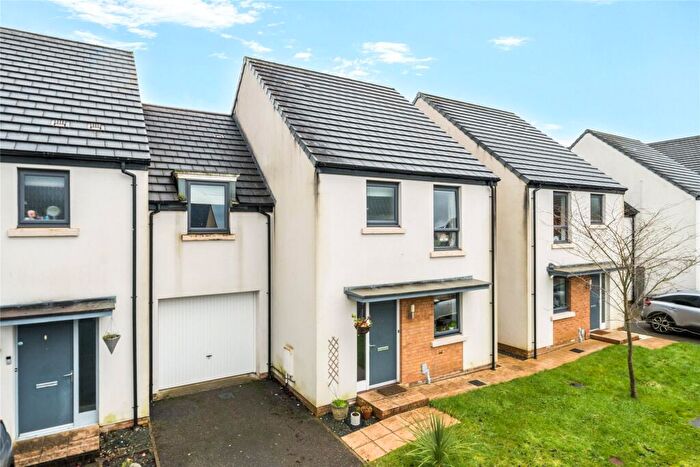
Properties for sale in Okehampton South
Roads and Postcodes in Okehampton South
Navigate through our locations to find the location of your next house in Okehampton South, Okehampton for sale or to rent.
| Streets | Postcodes |
|---|---|
| Castle Road | EX20 1FA |
| Castleford Way | EX20 1JX |
| Courtenay Road | EX20 1PZ |
| East Street | EX20 1AY |
| Fairplace | EX20 1DN |
| Fore Street | EX20 1AP EX20 1HB EX20 1HD |
| Fowley Cross | EX20 4NA |
| George Street | EX20 1HW EX20 1QA |
| Giblands Park | EX20 1TH |
| High Street | EX20 1LB |
| Klondyke Road | EX20 1EW |
| March Court | EX20 1BY |
| Mill Road | EX20 1FZ EX20 1GF EX20 1PW |
| New Road | EX20 1ET |
| River Walk | EX20 1LH |
| Sharp Hill | EX20 1FF |
| Simmons Close | EX20 1ND |
| Simmons Park | EX20 1DX EX20 1EP |
| St James Street | EX20 1DW |
| Station Road | EX20 1EJ EX20 1HS |
| Tavistock Road | EX20 4LP |
| The Glen | EX20 1LL |
| West Street | EX20 1HG EX20 1HQ |
| EX20 1GE EX20 1GS EX20 1QP EX20 1WY EX20 1YX EX20 4LN EX20 4LT |
Transport near Okehampton South
-
Okehampton Station
-
Sampford Courtenay Station
-
Lapford Station
-
Eggesford Station
-
Morchard Road Station
-
Copplestone Station
-
Yeoford Station
-
King's Nympton Station
- FAQ
- Price Paid By Year
- Property Type Price
Frequently asked questions about Okehampton South
What is the average price for a property for sale in Okehampton South?
The average price for a property for sale in Okehampton South is £200,000. This amount is 36% lower than the average price in Okehampton. There are 1,643 property listings for sale in Okehampton South.
Which train stations are available in or near Okehampton South?
Some of the train stations available in or near Okehampton South are Okehampton, Sampford Courtenay and Lapford.
Property Price Paid in Okehampton South by Year
The average sold property price by year was:
| Year | Average Sold Price | Price Change |
Sold Properties
|
|---|---|---|---|
| 2024 | £200,000 | 3% |
1 Property |
| 2022 | £194,500 | -35% |
3 Properties |
| 2021 | £263,500 | 43% |
4 Properties |
| 2020 | £149,500 | 15% |
2 Properties |
| 2019 | £126,333 | -20% |
3 Properties |
| 2017 | £151,993 | 25% |
8 Properties |
| 2016 | £114,071 | -8% |
7 Properties |
| 2015 | £123,500 | -102% |
10 Properties |
| 2014 | £250,000 | 53% |
1 Property |
| 2008 | £116,358 | -321% |
1 Property |
| 2006 | £490,000 | 38% |
1 Property |
| 2003 | £305,000 | 28% |
1 Property |
| 2001 | £220,000 | -9% |
1 Property |
| 2000 | £240,000 | 71% |
1 Property |
| 1995 | £70,000 | - |
1 Property |
Property Price per Property Type in Okehampton South
Here you can find historic sold price data in order to help with your property search.
The average Property Paid Price for specific property types in the last three years are:
| Property Type | Average Sold Price | Sold Properties |
|---|---|---|
| Terraced House | £200,000.00 | 1 Terraced House |

