
Houses for sale in Thrushel, Okehampton
House Prices in Thrushel
Properties in Thrushel have an average house price of £396k and had 8 Property Transactions within the last 3 years¹.
Thrushel is an area in Okehampton, Devon with 159 households², where the most expensive property was sold for £545k.
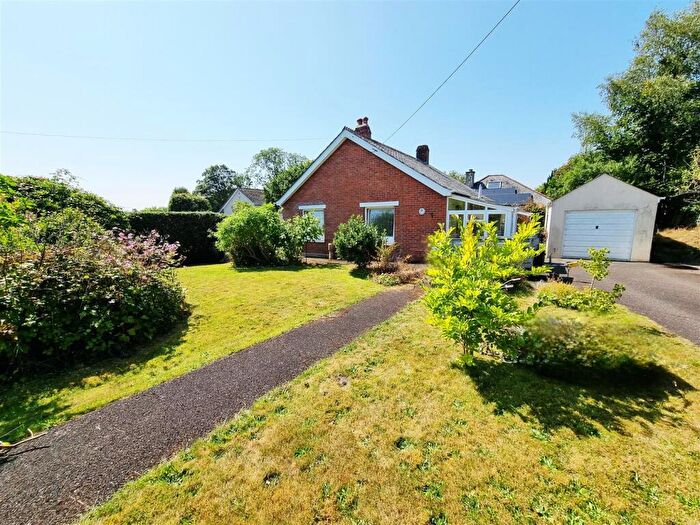
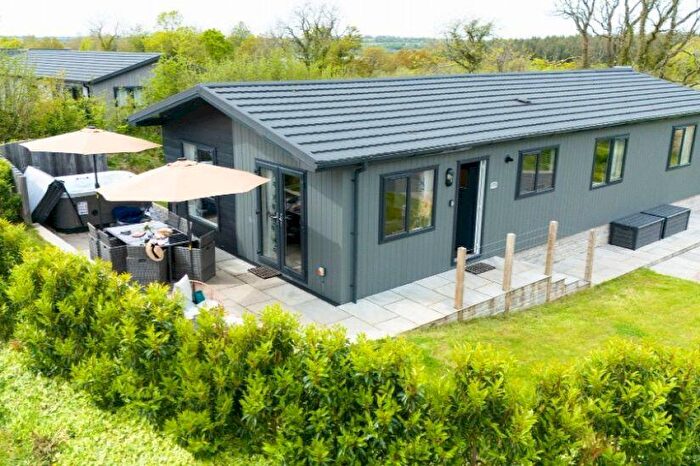
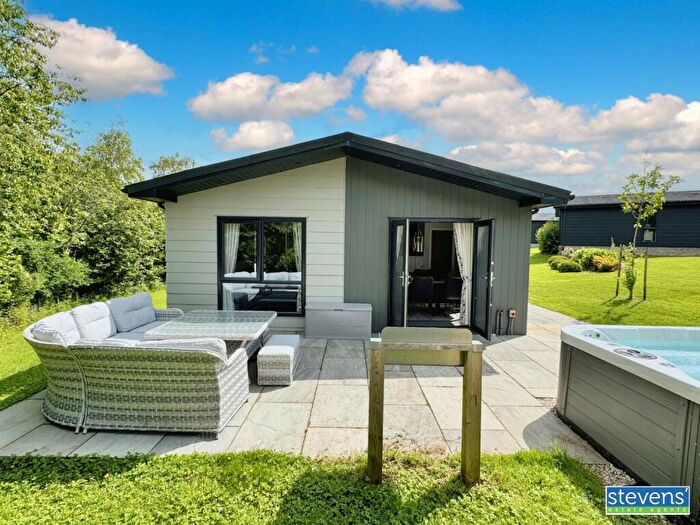
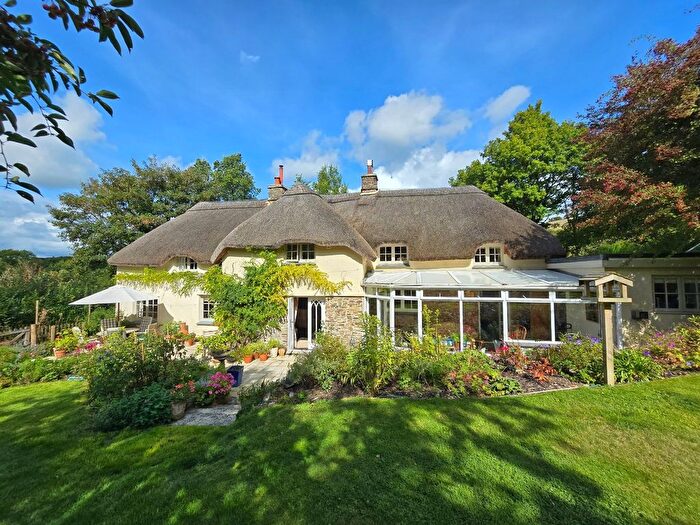
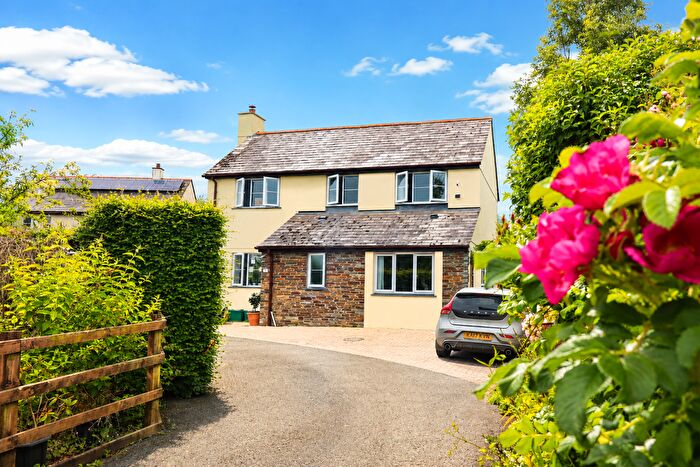
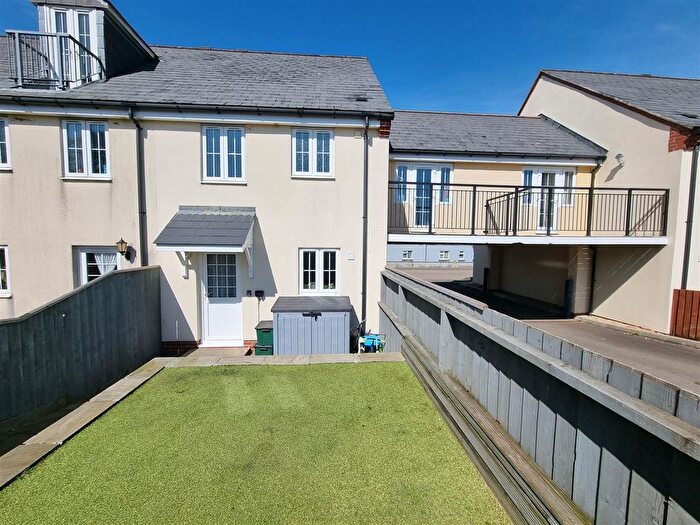
Properties for sale in Thrushel
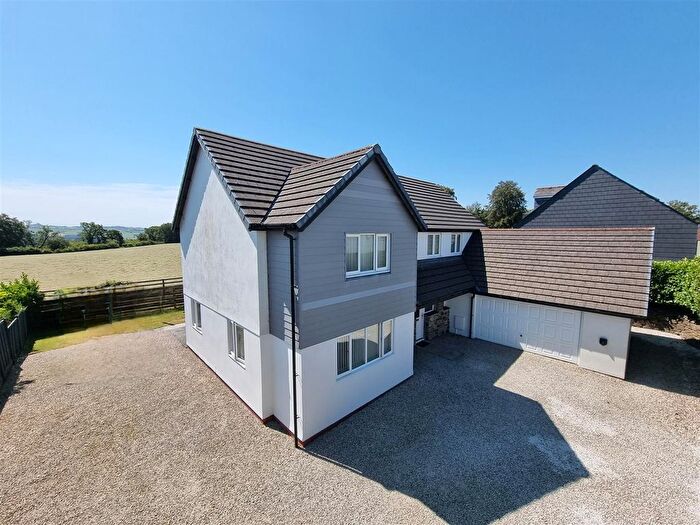
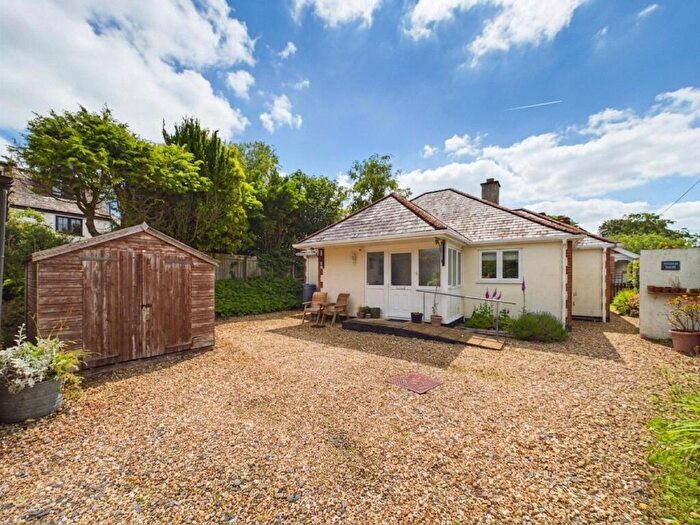
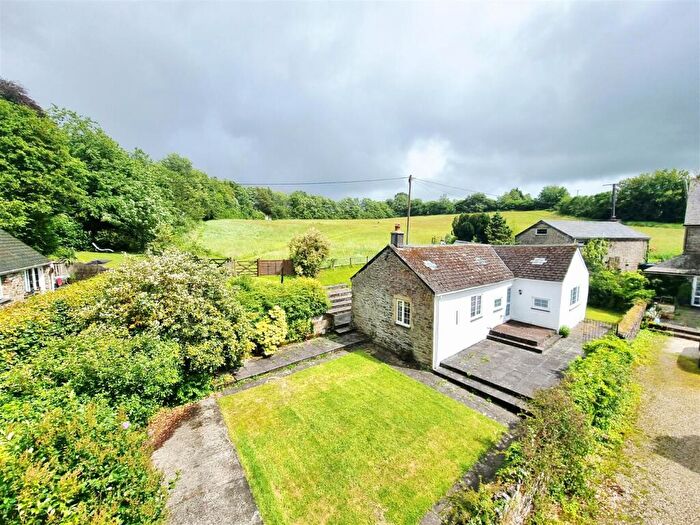
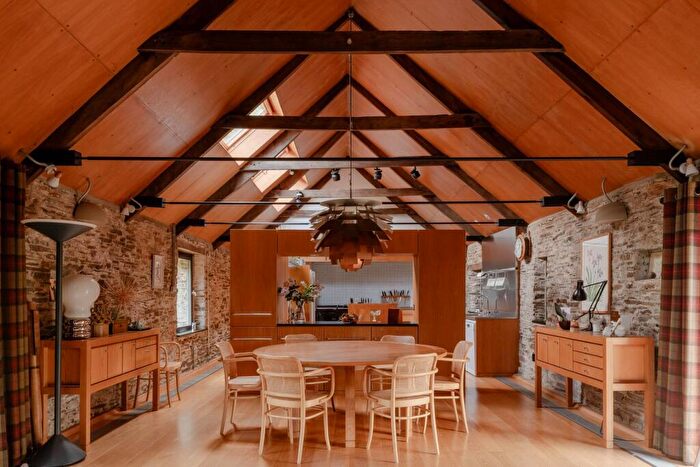
![]()
If you are looking to sell your house, let it out, or receive a property valuation, an expert can help you.
Click the button below to get started.
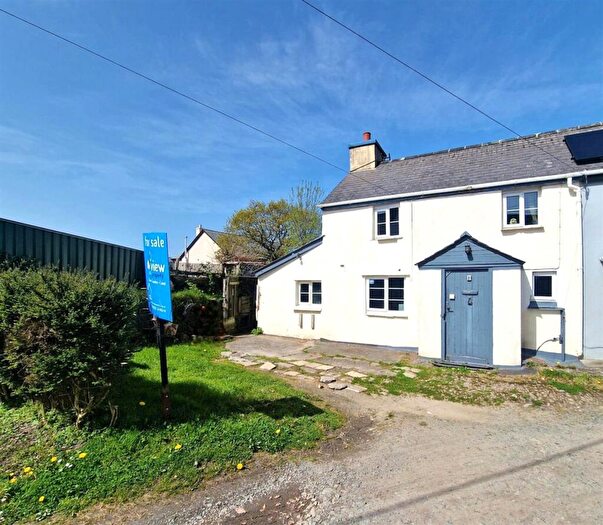

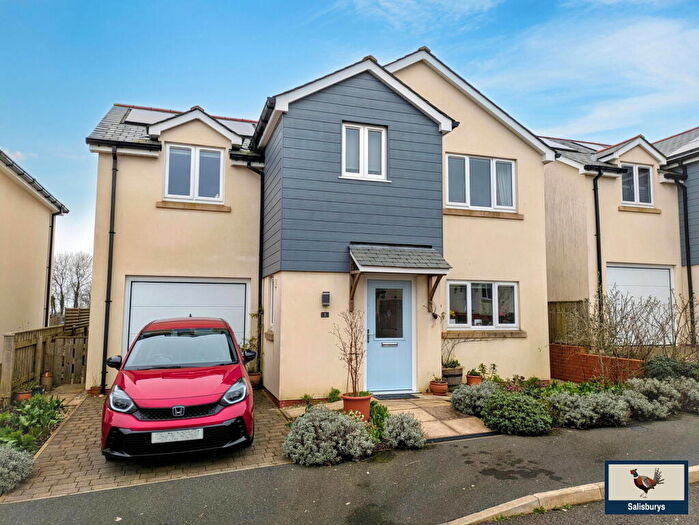
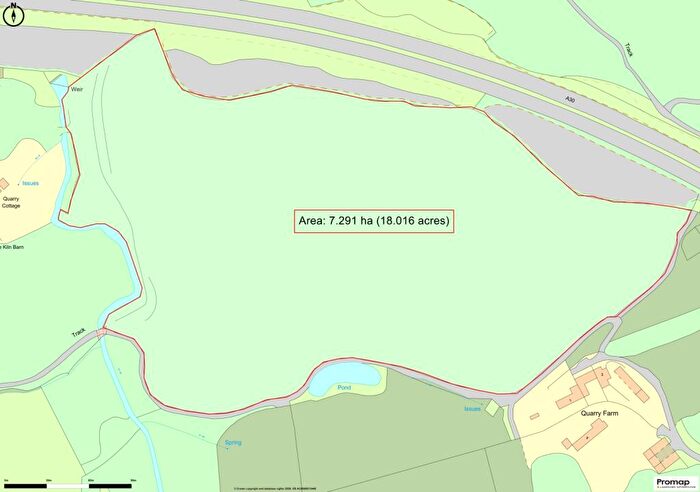
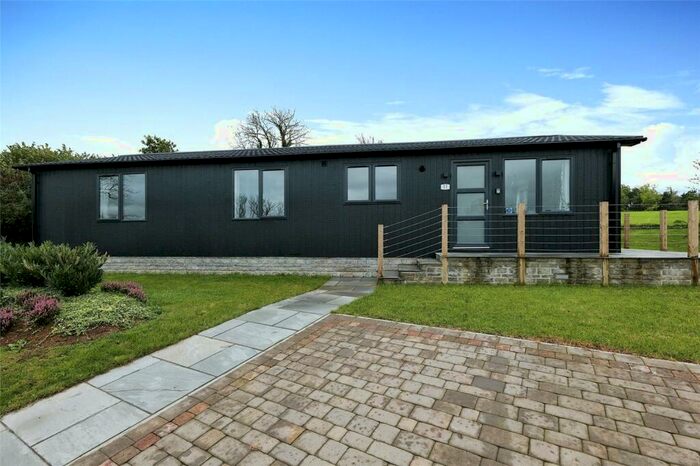
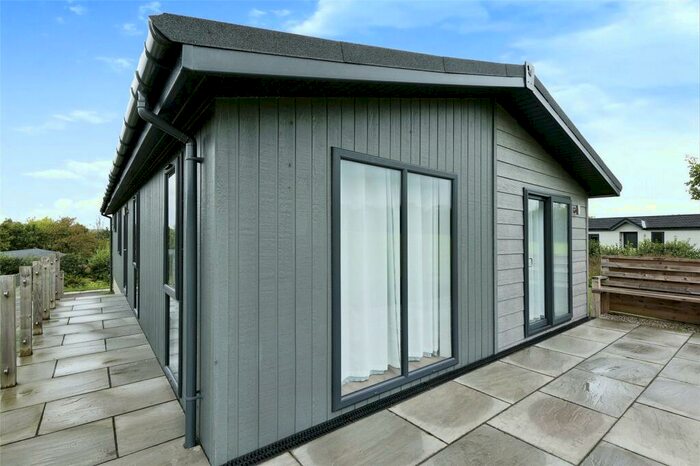
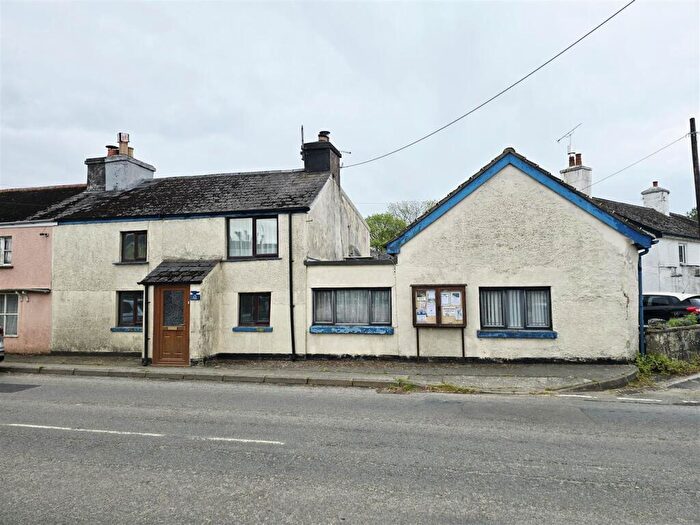
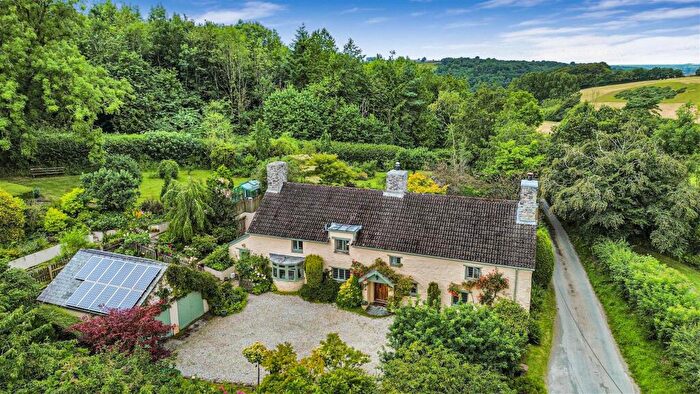
Previously listed properties in Thrushel
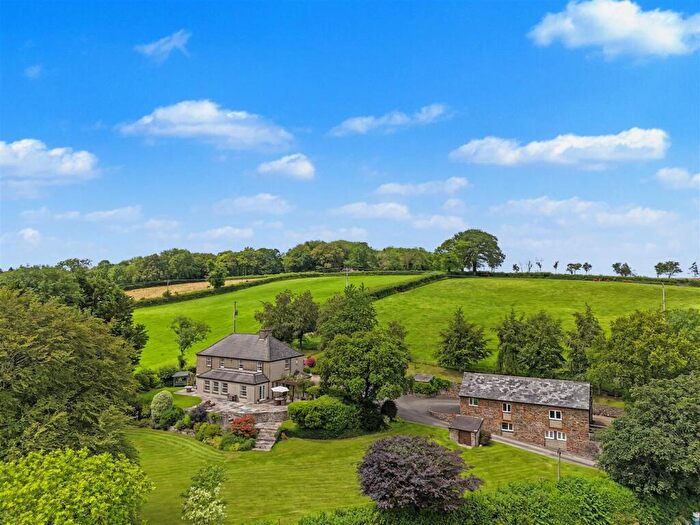
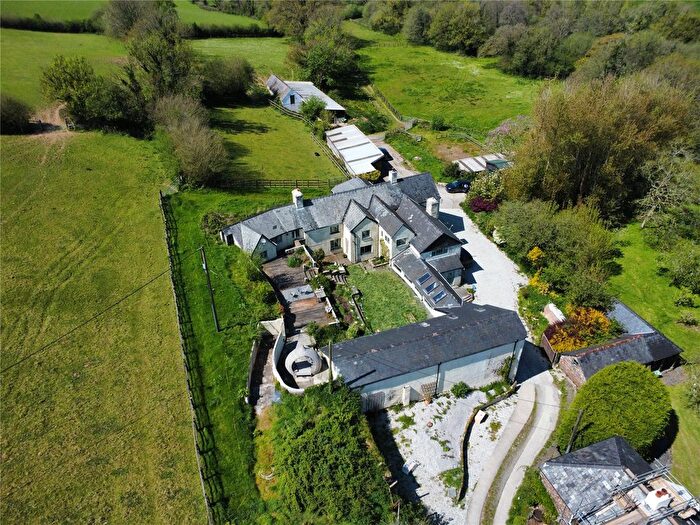
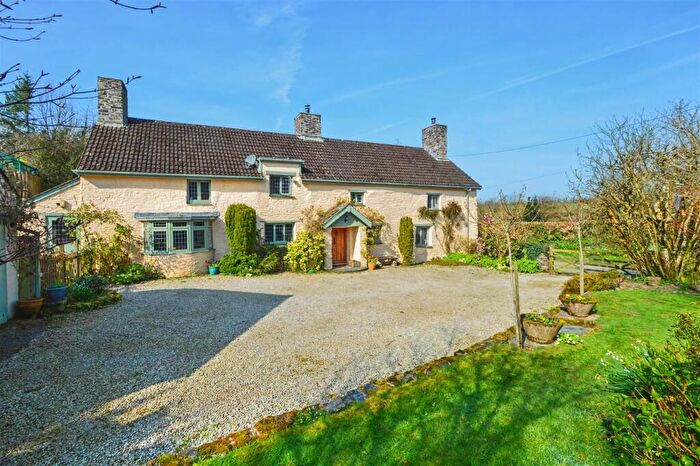
![]()
If you are looking to sell your house, let it out, or receive a property valuation, an expert can help you.
Click the button below to get started.
Roads and Postcodes in Thrushel
Navigate through our locations to find the location of your next house in Thrushel, Okehampton for sale or to rent.
| Streets | Postcodes |
|---|---|
| Lobhill Cross | EX20 4DT |
| Portgate | EX20 4PX EX20 4PY EX20 4QZ |
| Rowan Cottages | EX20 4DG |
| Stowford Rise | EX20 4DA |
| EX20 4BU EX20 4BY EX20 4BZ EX20 4DB EX20 4DD EX20 4DE EX20 4DZ EX20 4EA EX20 4EB EX20 4PH EX20 4PJ EX20 4QJ EX20 4QL EX20 4QP EX20 4QR EX20 4QT EX20 4QW EX20 4QX EX20 4QY |
Property price trends in Thrushel
According to the latest Land Registry data, the average home in Thrushel sold for £285,833 in 2025. That figure comes from 145 sales logged over the past 30 years.
Prices have fallen back over the last three years. Compared with 2022, when the typical sale came in around £566,250, that's a fall of roughly 49.5%.
Looking back five years, average prices are down about 38.7% since 2020, a drop of around £180,157 in cash terms.
Zoom out to the past decade for the fuller picture. Back in 2015, homes here averaged £267,400, so the typical sold price has climbed about 6.9% since then, roughly 0.7% a year. Stretch the view to fifteen years and that annual pace eases back to about -3.4%.
Frequently asked questions about Thrushel
What is the average price for a property for sale in Thrushel?
The average price for a property for sale in Thrushel is £396,212. This amount is 27% higher than the average price in Okehampton. There are 184 property listings for sale in Thrushel.
Which train stations are available in or near Thrushel?
Some of the train stations available in or near Thrushel are Okehampton, Gunnislake and Calstock.
Property Price Paid in Thrushel by Year
The average sold property price by year was:
| Year | Average Sold Price | Price Change |
Sold Properties
|
|---|---|---|---|
| 2025 | £285,833 | -85% |
3 Properties |
| 2024 | £528,750 | 21% |
2 Properties |
| 2023 | £418,233 | -35% |
3 Properties |
| 2022 | £566,250 | 8% |
5 Properties |
| 2021 | £520,500 | 10% |
4 Properties |
| 2020 | £465,990 | 5% |
5 Properties |
| 2019 | £440,432 | 23% |
3 Properties |
| 2018 | £338,812 | -34% |
8 Properties |
| 2017 | £453,333 | 31% |
3 Properties |
| 2016 | £312,470 | 14% |
5 Properties |
Property Price per Property Type in Thrushel
Here you can find historic sold price data in order to help with your property search.
The average Property Paid Price for specific property types in the last three years are:
| Property Type | Average Sold Price | Sold Properties |
|---|---|---|
| Terraced House | £232,350.00 | 2 Terraced Houses |
| Detached House | £511,875.00 | 4 Detached Houses |
| Semi Detached House | £328,750.00 | 2 Semi Detached Houses |
