
Houses for sale in EX12 3HE, Marmora Terrace, Beer And Branscombe, Seaton
House Prices in EX12 3HE, Marmora Terrace, Beer And Branscombe
Properties in EX12 3HE have no sales history available within the last 3 years. EX12 3HE is a postcode in Marmora Terrace located in Beer And Branscombe, an area in Seaton, Devon, with 3 households².
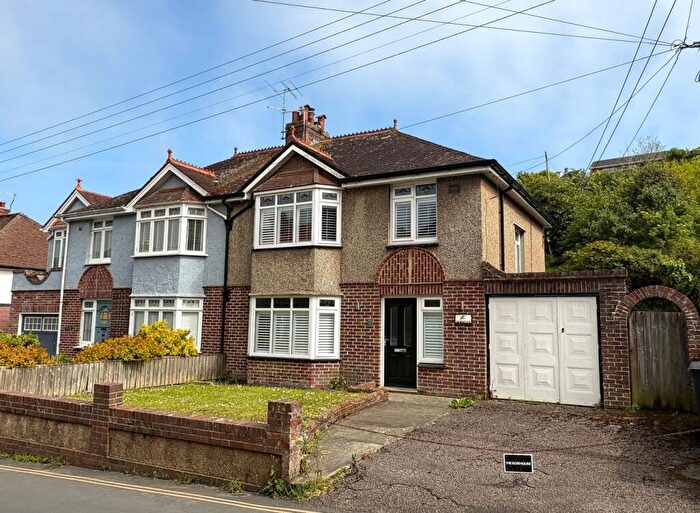
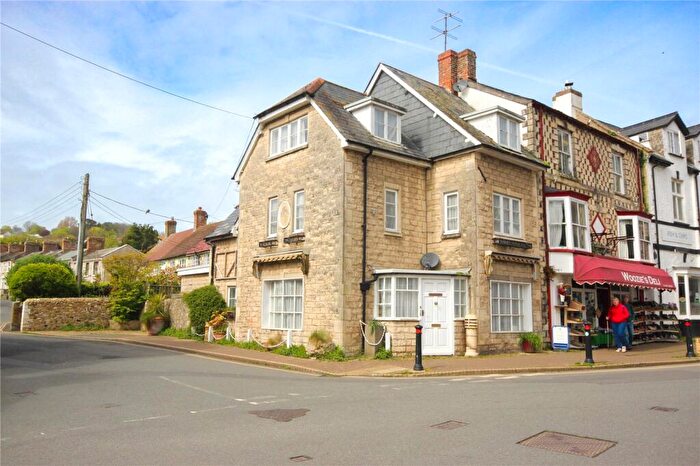
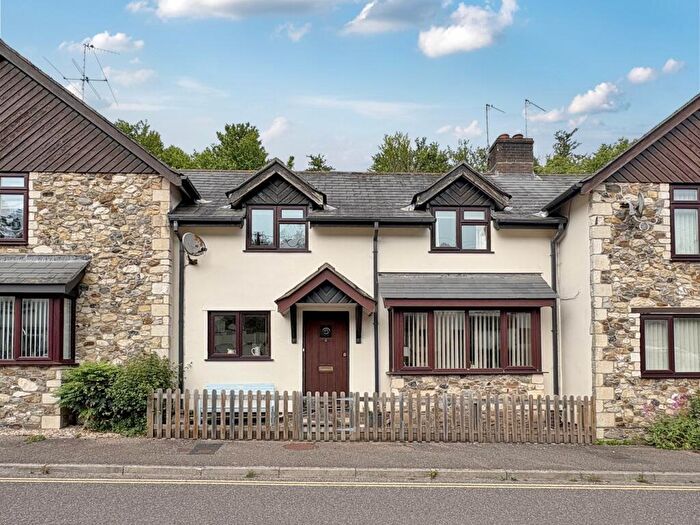
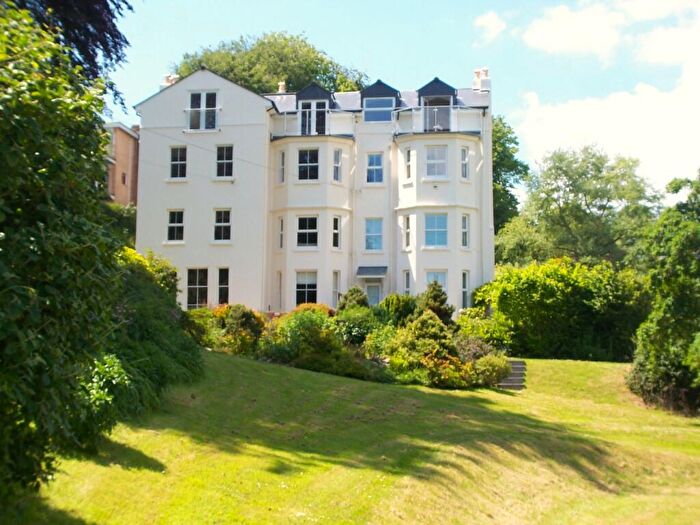
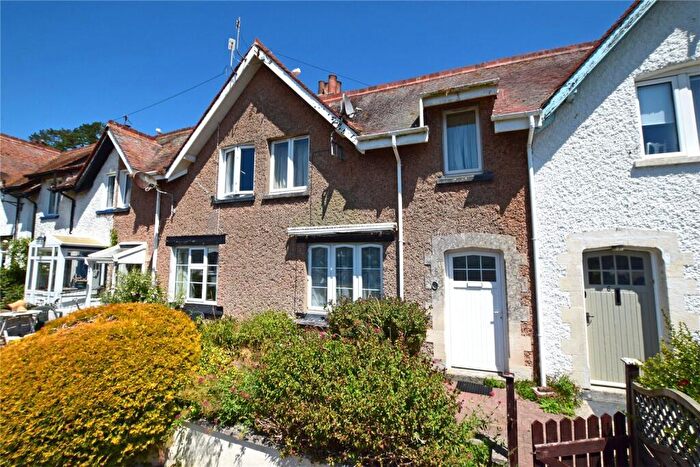
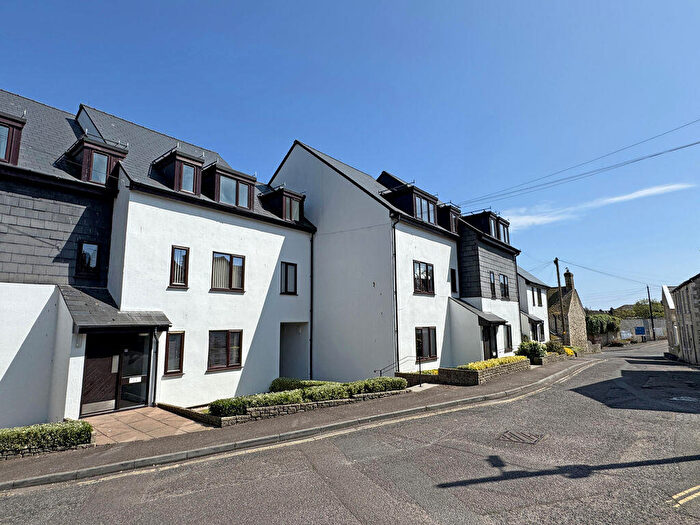
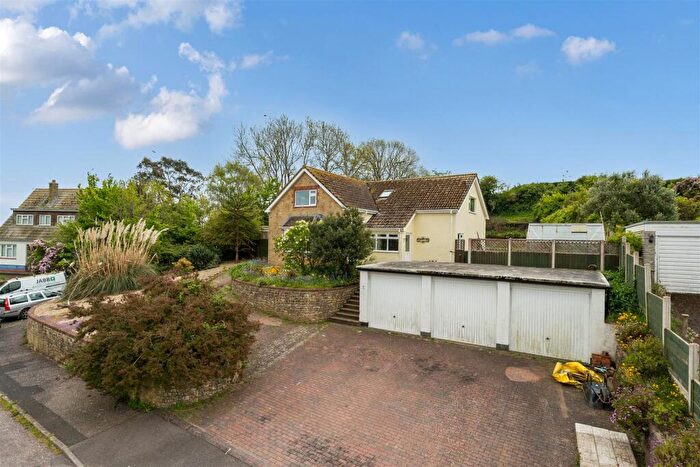
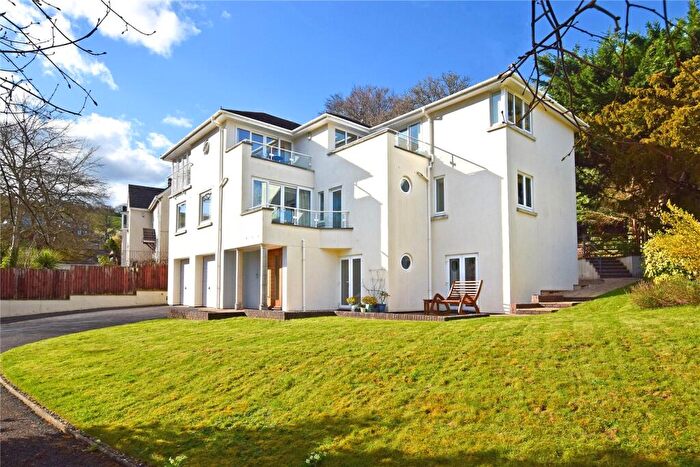
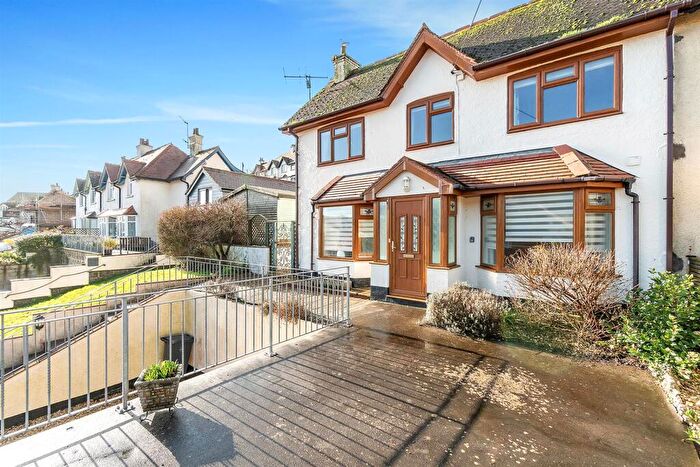
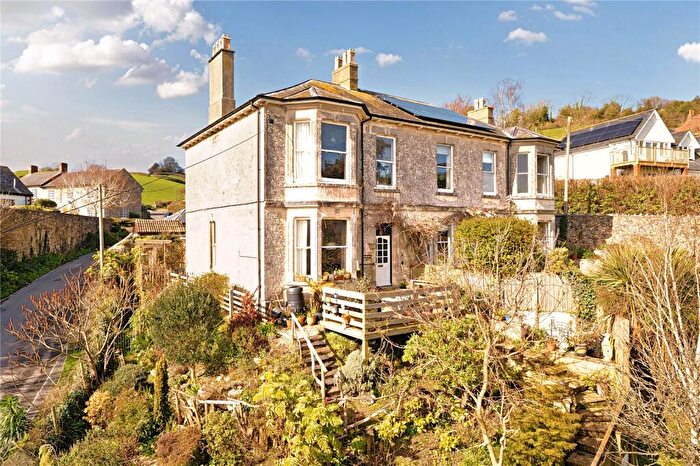
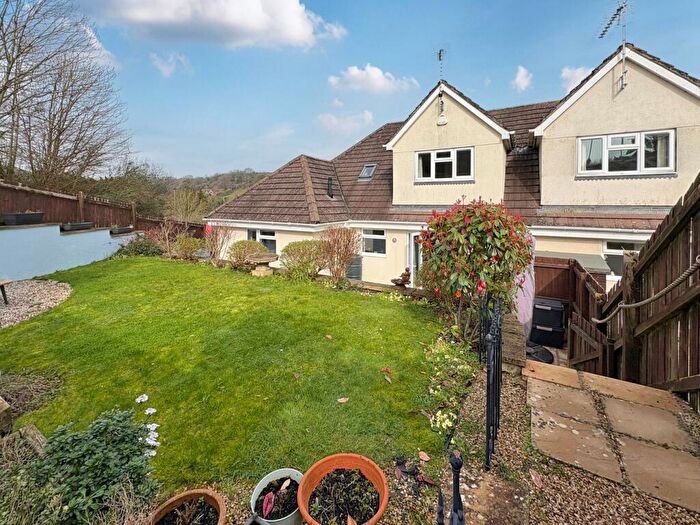
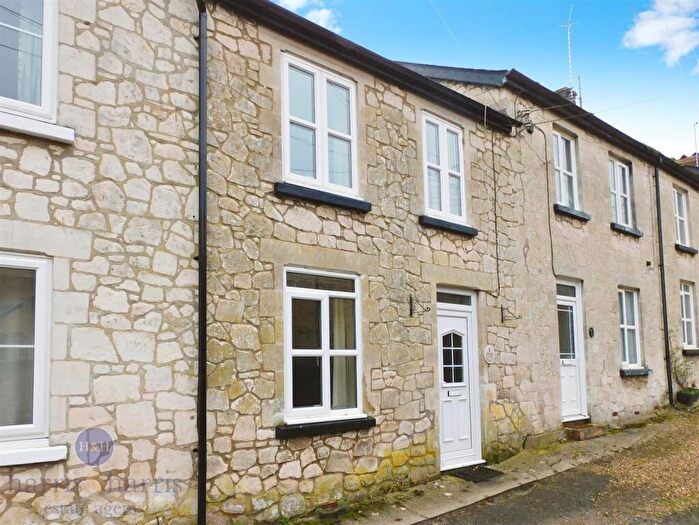
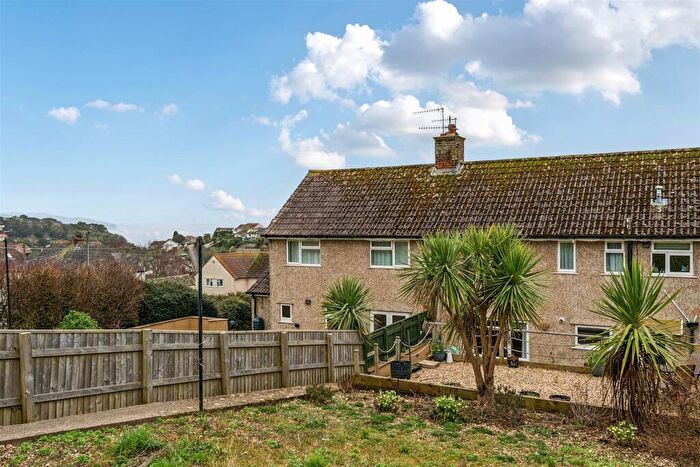
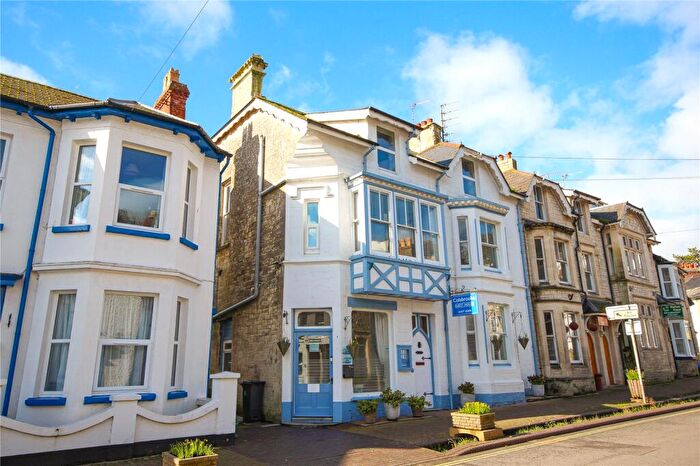
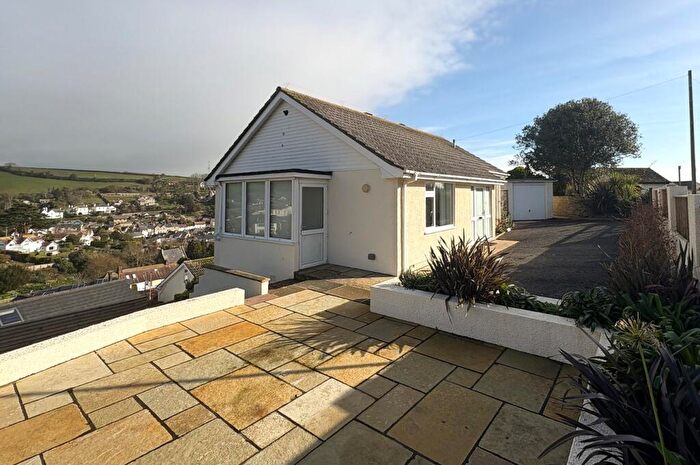
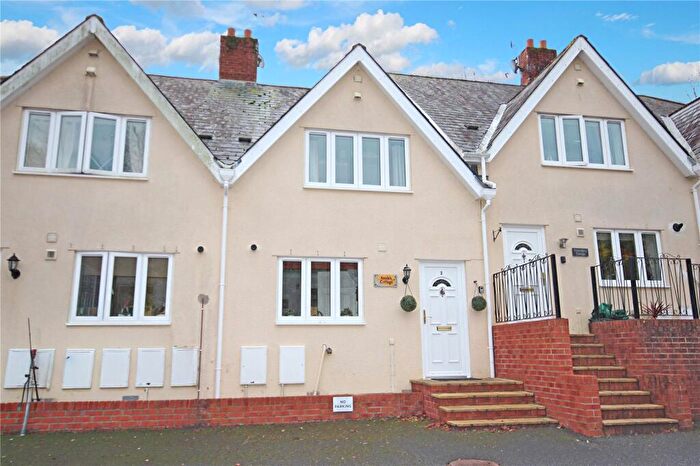
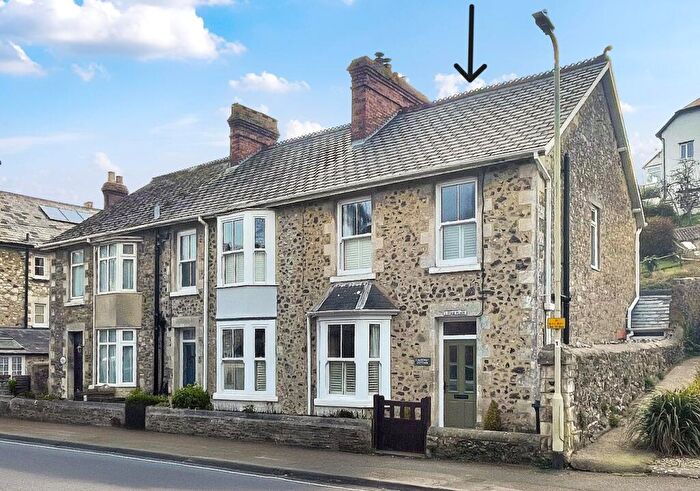
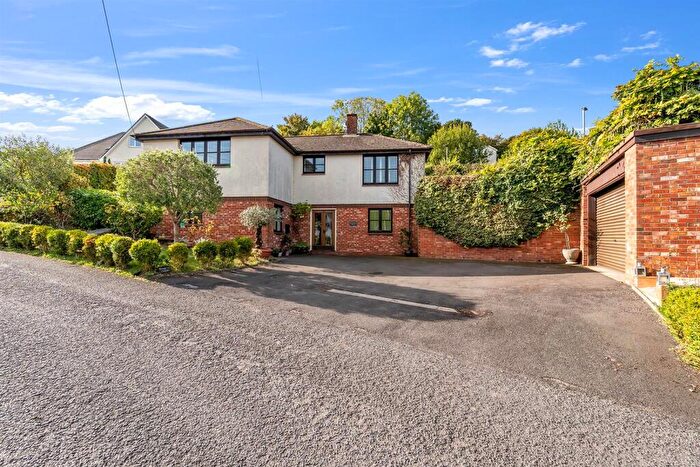
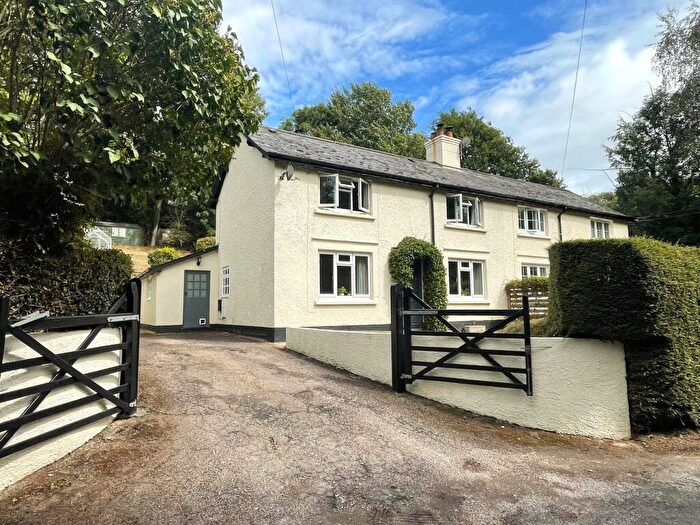
Properties for sale near EX12 3HE, Marmora Terrace
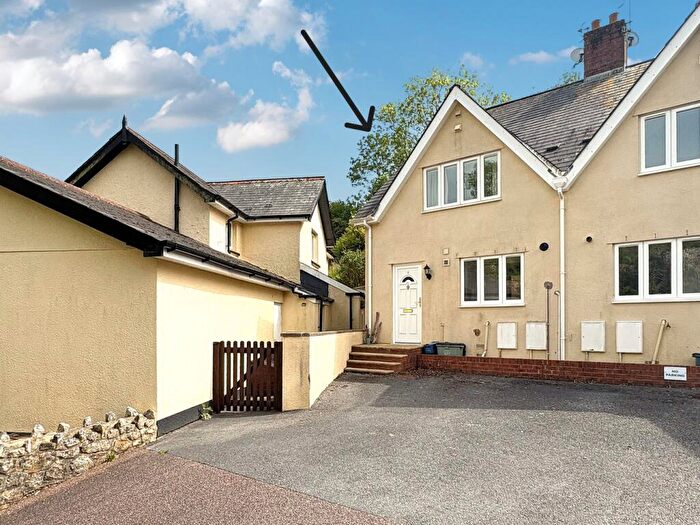
![]()
If you are looking to sell your house, let it out, or receive a property valuation, an expert can help you.
Click the button below to get started.
Price Paid in Marmora Terrace, EX12 3HE, Beer And Branscombe
3 Marmora Terrace, EX12 3HE, Beer And Branscombe Seaton
Property 3 has been sold 2 times. The last time it was sold was in 12/11/2015 and the sold price was £253,000.00.
This terraced house, sold as a freehold on 12/11/2015, is a 83 sqm mid-terrace house with an EPC rating of D.
| Date | Price | Property Type | Tenure | Classification |
|---|---|---|---|---|
| 12/11/2015 | £253,000.00 | Terraced House | freehold | Established Building |
| 27/05/2002 | £140,000.00 | Terraced House | freehold | Established Building |
2 Marmora Terrace, EX12 3HE, Beer And Branscombe Seaton
Property 2 has been sold 2 times. The last time it was sold was in 10/07/2006 and the sold price was £248,000.00.
This terraced house, sold as a freehold on 10/07/2006, is a 83 sqm mid-terrace house with an EPC rating of E.
| Date | Price | Property Type | Tenure | Classification |
|---|---|---|---|---|
| 10/07/2006 | £248,000.00 | Terraced House | freehold | Established Building |
| 24/06/1996 | £41,000.00 | Terraced House | freehold | Established Building |
Property price trends in EX12 3HE, Marmora Terrace
According to the latest Land Registry data, the average home in EX12 3HE, Marmora Terrace sold for £253,000 in 2015. That figure comes from 4 sales logged over the past 19 years.
Zoom out to the past decade for the fuller picture. Back in 2006, homes here averaged £248,000, so the typical sold price has climbed about 2% since then, roughly 0.2% a year. Stretch the view to fifteen years and that annual pace edges up closer to 4.7%.
Property Price Paid in EX12 3HE, Marmora Terrace by Year
The average sold property price by year was:
| Year | Average Sold Price | Price Change |
Sold Properties
|
|---|---|---|---|
| 2015 | £253,000 | 2% |
1 Property |
| 2006 | £248,000 | 44% |
1 Property |
| 2002 | £140,000 | 71% |
1 Property |
| 1996 | £41,000 | - |
1 Property |
