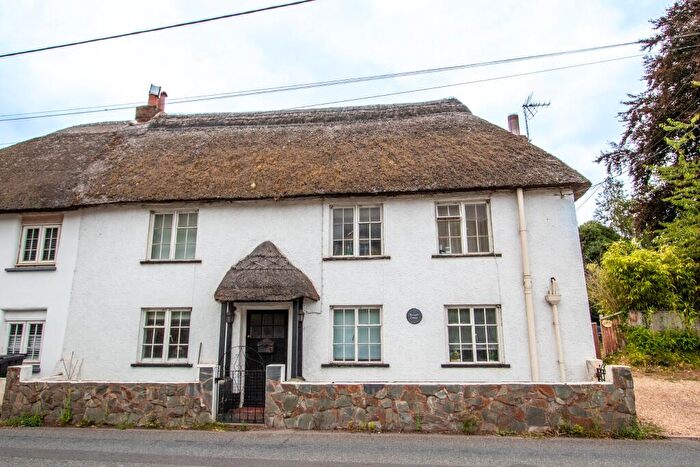
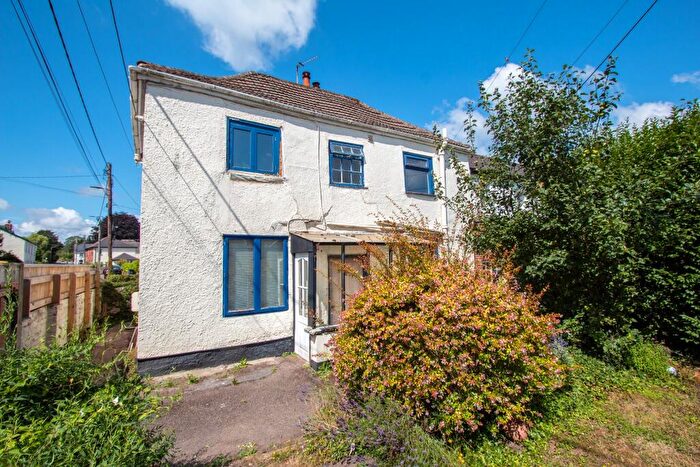
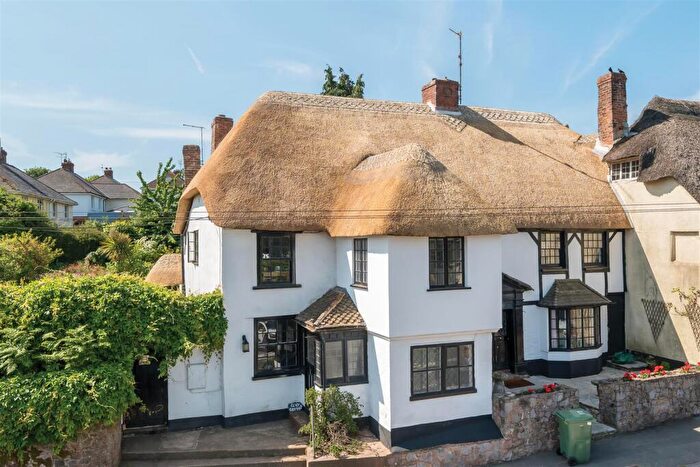
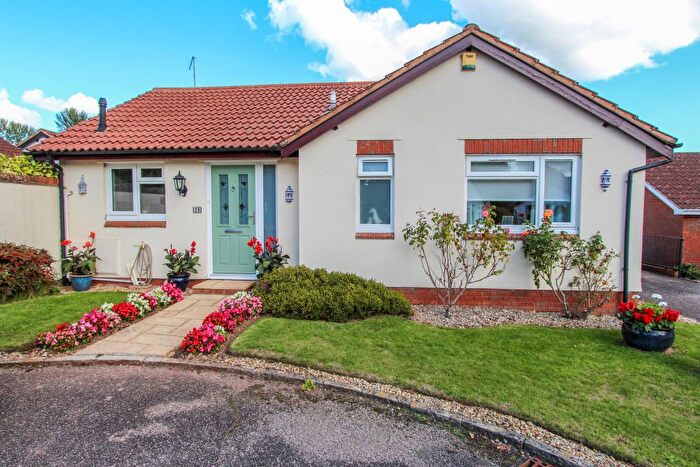
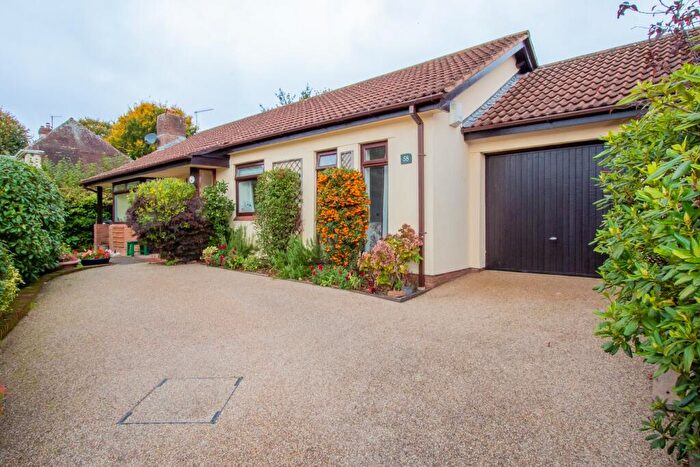
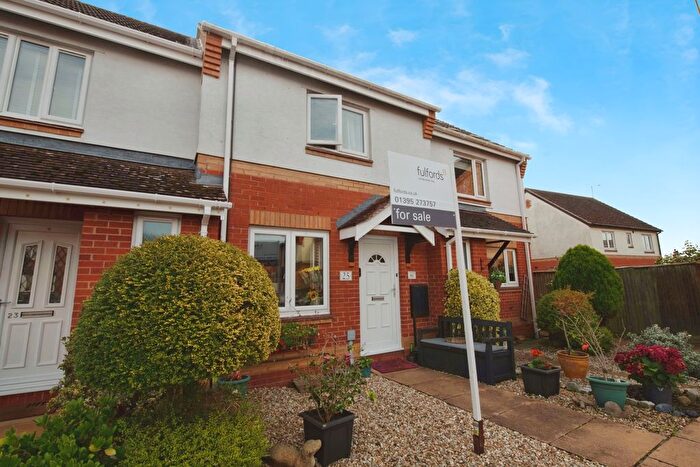
Houses for sale & to rent in Newton Poppleford And Harpford, Sidmouth
House Prices in Newton Poppleford And Harpford
Properties in Newton Poppleford And Harpford have an average house price of £384,908.00 and had 84 Property Transactions within the last 3 years¹.
Newton Poppleford And Harpford is an area in Sidmouth, Devon with 834 households², where the most expensive property was sold for £2,930,000.00.
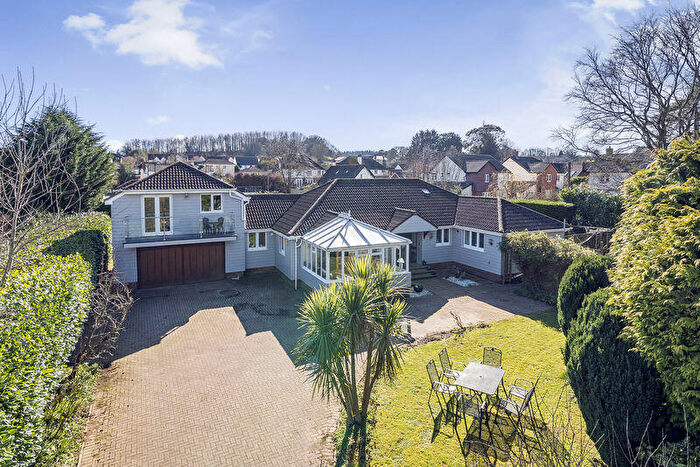
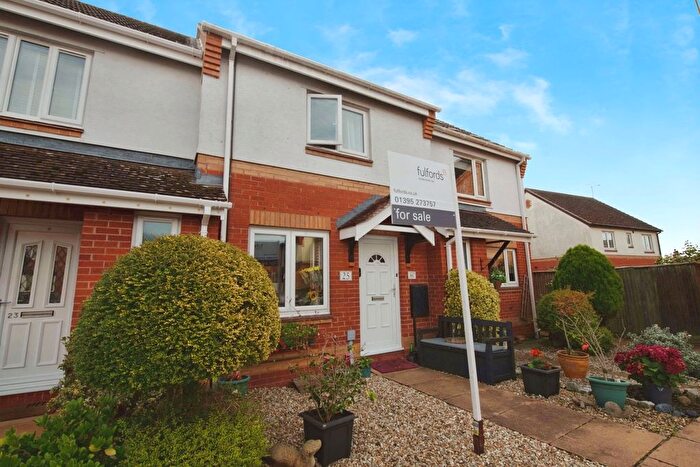
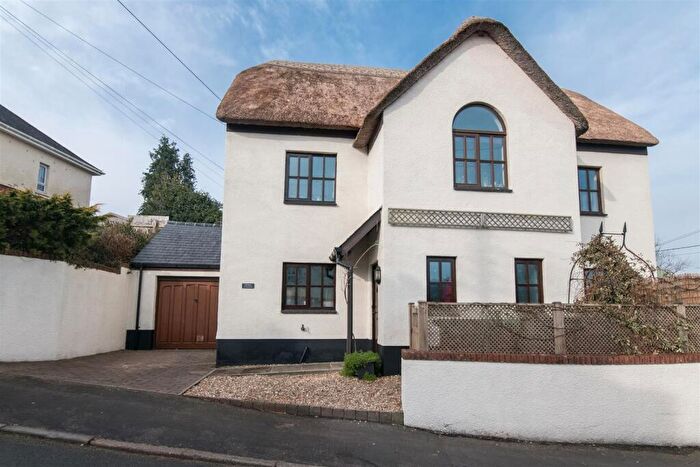
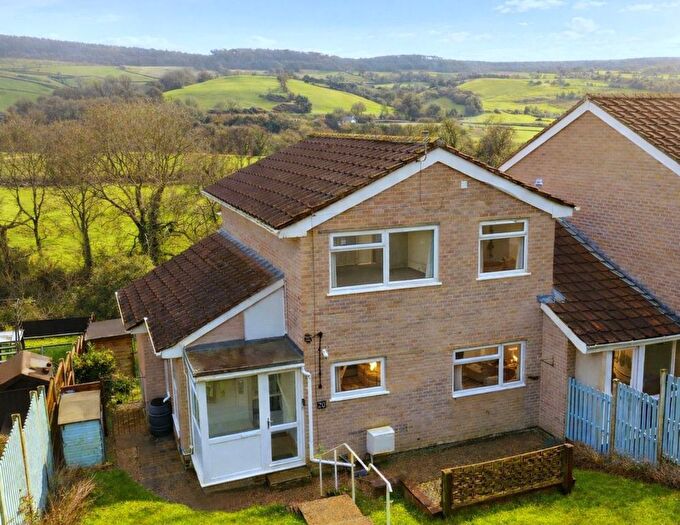
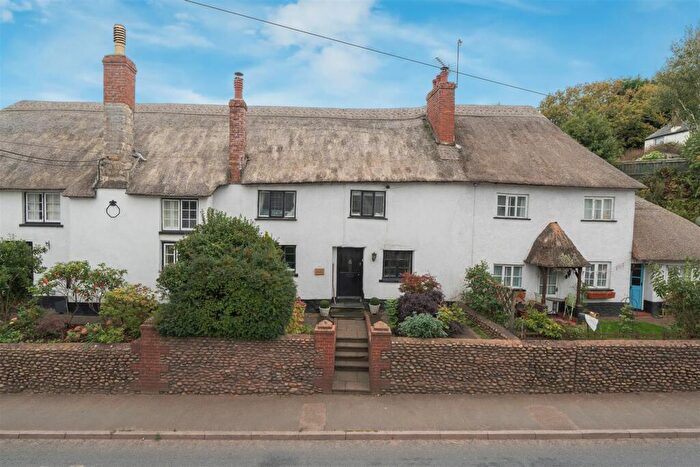
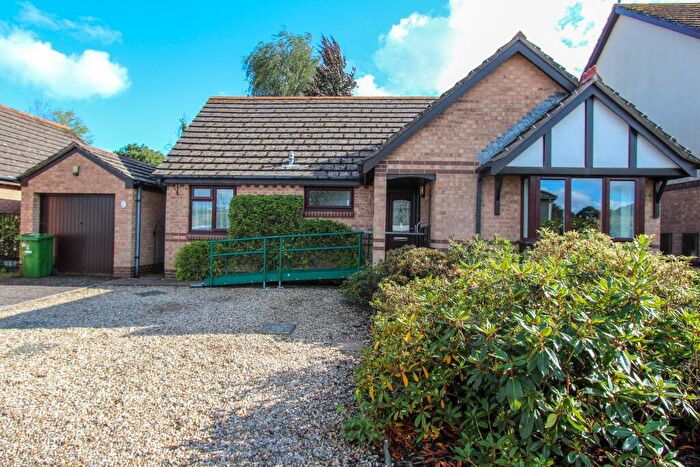
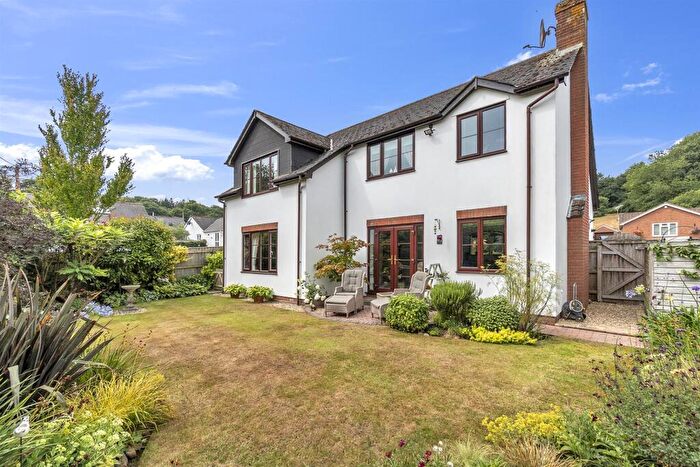
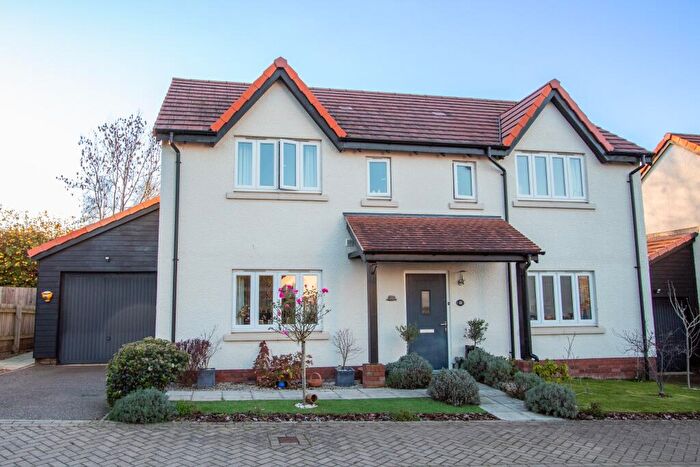
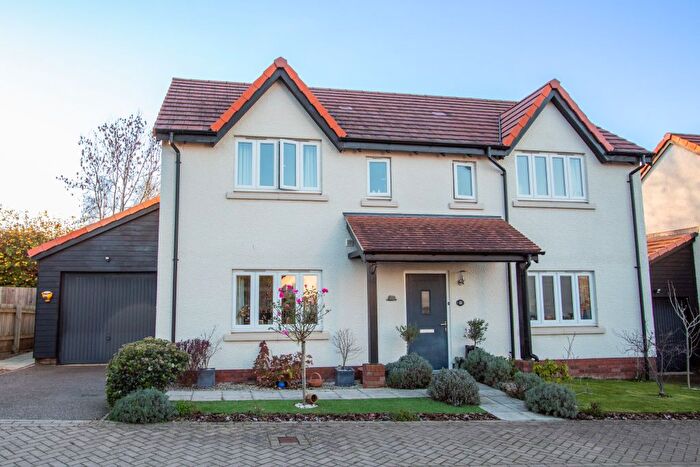
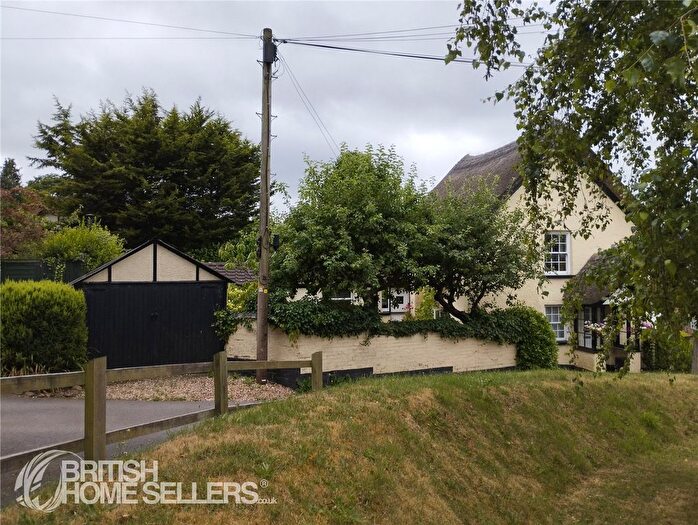
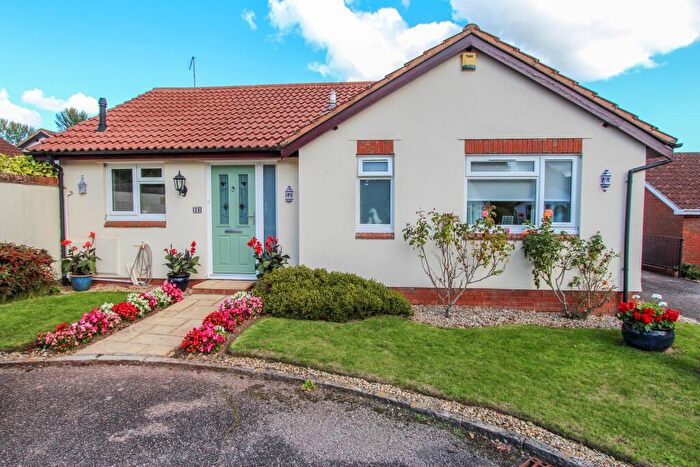
Properties for sale in Newton Poppleford And Harpford
Previously listed properties in Newton Poppleford And Harpford
Roads and Postcodes in Newton Poppleford And Harpford
Navigate through our locations to find the location of your next house in Newton Poppleford And Harpford, Sidmouth for sale or to rent.
| Streets | Postcodes |
|---|---|
| Back Lane | EX10 0BX EX10 0EY EX10 0EZ |
| Badger Close | EX10 0EA |
| Bridgend | EX10 0NG |
| Brook Meadow | EX10 0EQ |
| Burrow | EX10 0BP |
| Burrow Close | EX10 0BS |
| Burrow Lane | EX10 0BT EX10 0BW |
| Capper Close | EX10 0HD |
| Chestnut Way | EX10 0DL |
| Church Green | EX10 0DX |
| Down Close | EX10 0JD |
| Exeter Road | EX10 0BH EX10 0BJ EX10 0BL EX10 0FB EX10 0FD |
| Exmouth Road | EX10 0BE |
| Fairleigh | EX10 0SS |
| Glebelands | EX10 0HB |
| Goose Moor | EX10 0BN |
| Greenbank | EX10 0EB |
| Hacker Close | EX10 0HF |
| Hazel Close | EX10 0DJ |
| High Street | EX10 0BD EX10 0DR EX10 0DS EX10 0DT EX10 0DU EX10 0DW EX10 0ED EX10 0EF EX10 0EG |
| Higher Way | EX10 0NJ |
| Hillside | EX10 0BR |
| King Alfred Way | EX10 0DG |
| Lark Rise | EX10 0DH |
| Little Down Orchard | EX10 0BQ |
| Littledown Lane | EX10 0BG |
| Lower Farthings | EX10 0HE |
| Lower Way | EX10 0NQ |
| Lydia Close | EX10 0UA |
| Meadow Drive | EX10 0DN |
| Millmoor Lane | EX10 0EU |
| Oaktree Villas | EX10 0EP |
| Orchard Close | EX10 0BB |
| Otter Reach | EX10 0ST |
| Otter View | EX10 0EH |
| Parsons Close | EX10 0DQ |
| Robert Way | EX10 0SP |
| School Lane | EX10 0EJ |
| Station Road | EX10 0ER EX10 0ES EX10 0ET |
| Sunnyside | EX10 0HA |
| The Bank | EX10 0UZ |
| The Copse | EX10 0SU |
| The Gardens | EX10 0DP |
| Turner Close | EX10 0EN |
| Vale View | EX10 0DY |
| Venn Ottery Road | EX10 0BU |
| EX10 0AJ EX10 0AQ EX10 0BZ EX10 0DA EX10 0DD EX10 0EW EX10 0NH EX10 0NL |
Transport near Newton Poppleford And Harpford
-
Whimple Station
-
Feniton Station
-
Cranbrook Station
-
Exton Station
-
Lympstone Commando Station
-
Lympstone Village Station
-
Topsham Station
-
Exmouth Station
-
Newcourt Station
-
Digby and Sowton Station
- FAQ
- Price Paid By Year
- Property Type Price
Frequently asked questions about Newton Poppleford And Harpford
What is the average price for a property for sale in Newton Poppleford And Harpford?
The average price for a property for sale in Newton Poppleford And Harpford is £384,908. This amount is 19% lower than the average price in Sidmouth. There are 166 property listings for sale in Newton Poppleford And Harpford.
What streets have the most expensive properties for sale in Newton Poppleford And Harpford?
The streets with the most expensive properties for sale in Newton Poppleford And Harpford are Higher Way at an average of £1,677,500, Exmouth Road at an average of £650,000 and Venn Ottery Road at an average of £505,000.
What streets have the most affordable properties for sale in Newton Poppleford And Harpford?
The streets with the most affordable properties for sale in Newton Poppleford And Harpford are Turner Close at an average of £158,000, The Gardens at an average of £200,000 and Capper Close at an average of £206,875.
Which train stations are available in or near Newton Poppleford And Harpford?
Some of the train stations available in or near Newton Poppleford And Harpford are Whimple, Feniton and Cranbrook.
Property Price Paid in Newton Poppleford And Harpford by Year
The average sold property price by year was:
| Year | Average Sold Price | Price Change |
Sold Properties
|
|---|---|---|---|
| 2025 | £315,317 | -17% |
26 Properties |
| 2024 | £368,123 | -20% |
21 Properties |
| 2023 | £443,337 | 18% |
37 Properties |
| 2022 | £361,817 | -4% |
27 Properties |
| 2021 | £375,927 | 6% |
55 Properties |
| 2020 | £354,132 | 7% |
37 Properties |
| 2019 | £329,987 | -12% |
68 Properties |
| 2018 | £369,982 | 17% |
34 Properties |
| 2017 | £306,629 | 12% |
27 Properties |
| 2016 | £270,209 | -4% |
43 Properties |
| 2015 | £280,771 | 7% |
40 Properties |
| 2014 | £261,669 | 6% |
42 Properties |
| 2013 | £246,986 | -1% |
36 Properties |
| 2012 | £249,003 | -7% |
30 Properties |
| 2011 | £265,398 | 3% |
34 Properties |
| 2010 | £257,698 | 18% |
40 Properties |
| 2009 | £210,809 | -12% |
21 Properties |
| 2008 | £235,882 | -29% |
26 Properties |
| 2007 | £305,348 | 14% |
32 Properties |
| 2006 | £262,872 | 11% |
48 Properties |
| 2005 | £234,366 | -5% |
34 Properties |
| 2004 | £246,029 | 29% |
43 Properties |
| 2003 | £173,918 | 14% |
44 Properties |
| 2002 | £149,621 | 26% |
41 Properties |
| 2001 | £110,200 | 2% |
44 Properties |
| 2000 | £107,657 | 9% |
37 Properties |
| 1999 | £97,880 | -37% |
54 Properties |
| 1998 | £133,674 | 42% |
34 Properties |
| 1997 | £78,074 | 3% |
50 Properties |
| 1996 | £75,593 | -5% |
68 Properties |
| 1995 | £79,529 | - |
41 Properties |
Property Price per Property Type in Newton Poppleford And Harpford
Here you can find historic sold price data in order to help with your property search.
The average Property Paid Price for specific property types in the last three years are:
| Property Type | Average Sold Price | Sold Properties |
|---|---|---|
| Semi Detached House | £316,045.00 | 22 Semi Detached Houses |
| Detached House | £479,685.00 | 45 Detached Houses |
| Terraced House | £221,541.00 | 12 Terraced Houses |
| Flat | £227,000.00 | 5 Flats |

